©BEYKENT UNIVERSITY
NONLINEAR FINITE ELEMENT ANALYSIS OF
A CRACKED BEAM
Fuat DEMİR
Suleyman Demirel University Civil Engineering Department, IspartaE-mail:fudemir@mmf.sdu.edu.tr Received: 18 April 2007, Accepted: 05 May 2008
ABSTRACT
The cracks in reinforced concrete structures have an important effect on load carrying capacity of the structural elements. In many cases, crack phenomenon is taken into account by using cracked cross sections. In this study, crack phenomenon is investigated by using nonlinear finite element method. A computer program was developed by using Fortran coding. Smeared crack model for crack representation and discrete representation of reinforcement is used. Interaction between concrete and reinforcement is modeled by using link element. The effect of existing cracks in a reinforced concrete beam on the load carrying capacity and load deformation are investigated. The results are given in figures for nonlinear investigation.
Keywords: Crack, R/C beam, finite element method.
ÇATLAMIŞ BİR KİRİŞİN DOĞRUSAL
OLMAYAN DAVRANIŞININ SONLU
ELEMANLAR YÖNTEMİ İLE İNCELENMESİ
ÖZET
Betonarme elemanlardaki çatlama, bu elemanların taşıma kapasitelerinin belirlenmesinde son derece etkilidir. Hesaplamalarda çatlama genellikle çatlamış beton kesit özellikleri dikkate alınarak yapılmaktadır. Bu çalışmada çatlama durumu, doğrusal olmayan sonlu elemanlar yöntemi kullanılarak incelenmiştir. Bu amaç için fortran dilinde bir bilgisayar programı hazırlanmıştır. Çatlak oluşumun gösterimi için yayılı çatlak modeli, donatının modellenmesi için ise ayrık donatı modeli kullanılmıştır. Donatı ile beton arasındaki aderans yaylarla modellenmiştir. Betonarme bir kirişteki çatlak durumunun kirişin taşıma kapasitesi ve yük yerdeğiştirme eğrisindeki değişimi incelenmiş ve elde edilen sonuçlar şekillerde verilmiştir.
1. INTRODUCTION
Reinforced concrete (R/C) buildings have cracks in the structural sections even under service loads. So many different reasons could be counted for the cracks. Cracking could be reasoned with different reasons and they become larger and deeper in time by naturally.
In most cases, the reason of the cracking in R/C structural members is tension stress. Tensions could be related with axial tension load, bending moments, shear forces and torsional moments. For R/C structural members, when the concrete stress catches the tension stress, cracks are occurred [1]. Cracks cause decrease in structural bearing capacity. In the calculations this decrease should be taken care by rigidity of the cracked sections. Properties and chacteristics of cracks are related with decrease of cracked section rigidity.
In the present study, cracking in R/C buildings, location of the cracks, thickness and length of the cracks are investigated. A computer program was developed by using Fortran coding. Smeared crack model for crack representation and discrete representation of reinforcement is used.
2. MODELING OF CONCRETE MEMBERS EFFECT
A lot of experimental studies have been realized to investigate the nonlinear behavior of concrete for now. Various attempts have been made for formulation an algebraic equation to represent the nonlinear behavior of concrete obtained from the test results. One of these is the equation proposed by Desayi and Krishnan [2] for uniaxial behavior of concrete can be written as
where oc is concrete stress, ec is concrete strain , epm is peak strain, Ec initial elastic modulus and Ep = fc / epm is sekant modulus of concrete. Many experimental stdudies was done for modeling biaxial concrete behavior
[4-5]. Various attmepts have been made for formulation an algeraic equation to (1)
2
represent the failure envelop obatined from the test results. One of these equation proposed by Kupfer ve Gerstle [6] for o1> o2 is given as follow
f
f c fc v^
\
V fc- 3.65
V
fcJ
(3)• 0
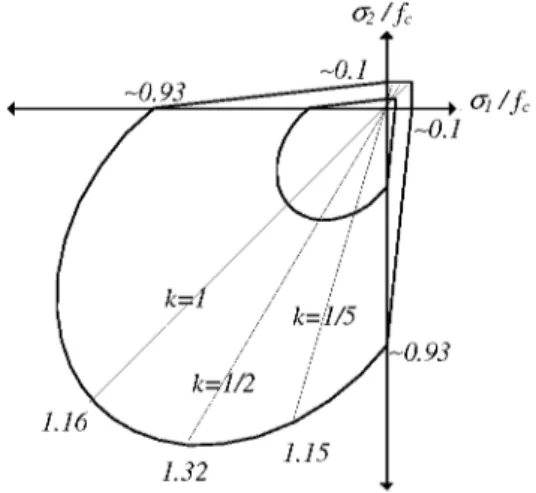
Another failure envelop proposed by Buyukozturk [7] was given in Fig. 1.
o2 / f c Ol / fc ~0.1
/
CI
~0.1 k= /k=i/5
kl2/ /
-0.93 1.16\ / 1-32 115..
Figure 1. Biaxial failure envelope for concrete
In the present study, the model given in equation 4 was used for nonlinear behavior of concrete [7].
f (II,J2) = 3J2 + fc IL =0
j 2 f2 (4)
_1 J c A
5
-9
Where, fc is uniaxial concrete strength, o0 hydrostatic stress , sij deviatoric stress, I1 stress invariant and J2 deviation stress invariant;
O = +O0 Sij ( 5 )
1
1, , (6) O0 = 3Ok k = 3 l O i +O2 2 +O3 3 ) = O j - O 0 ( 7 )1 i \
(8) h = Okk = 3 O0 , 12 = ^ O j O j -O i Oj j ) , 13 = OnO2 2O3 3J
2 2
Sij
SiJ
J3 3
Sii
S}k
Ski(9)
In the state of the plane stress, a region in the principle stress plane can be defined where a linear elastic stress-strain behavior for concrete can be assumed. One of the most simple and mathematically sound definition of this region can be done by adopting by back scaling back the failure envelop as follows
g(a, I
1, J
2)=3J
2+ aI
1+ I f / 5 - a / 9
(10)where the scaling factor is assumed to be 1/3. When the stress state is within this region linear elastic behavior is assumed, consequently a step-wise numerical analysis is not required. Having solved the system for a low stress state which is within the elastic region , the load can be increased the load proportionally up to the boundary of the elastic region with one step loading only. Beyond the elastic region the non-linear behavior of concrete is of significant importance. Under assumption that the strains are small, the total strain can be split into elastic and plastic parts.
[d£
e} = [ D]
-1{da}
(11)As it is the case with various materials, for concrete, the plastic part of the incremental strain can be assumed to be normal for plastic potential defined in the stress space. In the present study, as it done widely in the related literature, the equation which represents the outer boundary of the elastic region is assumed to be plastic potential. The calibration between the multiaxial stress state with the uniaxial concrete test data is realized by the proportionality constant between the plastic increment of the strain increment and the gradient of the plastic potential with respect to the corresponding stress.
Under this assumption and after various mathematical manipulation, the following stress-strain relationship can be obtained in incremental form for the total stress-strain relationship
{da}
[ D]
[ D] - —
d g l J d g l
d a f l d a l
[D]
2 a
( - y - Ii) H+
dg_
da
[D] dg_
da
(12){de}
{da}
=[ D
p]{de}
(13)where D is the material matrix, I1 is the first invariants of the stress tensor and H is the hardening parameter.
T
3. CRACKING MODELS OF CONCRETE
Cracking modeling could be defined in two ways as discrete and smeared [8]. In the present study, cracking is modeled with smeared model. In this model, existing stress in two dimensions are transferred in axial stress. When the tension stress of the member exceed the concrete tension strength, cracking starts in perpendicular direction of the tension stress. The continious model is given in material matrix as modulus of elasticity is equal to zero for this direction [9-10]. For example, material matrix of cracking is given below for a selected direction.
[ A ]
0 0 0
0 D22 0
Lo 0 p D33J
(14)Since when shear parameter is zero cause some numerical problems, this parameter is multiplied with p coefficient which could be taken 0.5 generally. When axial stress is compression, crushing of concrete could be defined with material matrix as modulus of elasticity is equal to zero for each direction
[11-12].
4. REINFORCEMENT MODELING
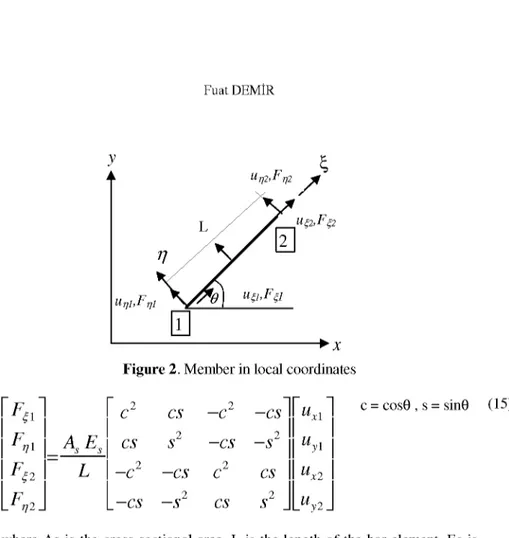
Modeling of the reinforced concrete finite element can be done generally by using of finite three representation techniques: Distributed, embedded and discrete. In the distributed modeling of reinforcement, steel is assumed to be distributed over the concrete element with a particular orientation. Perfect bond is assumed between concrete and steel. A composite concrete and reinforcement constitutive relation is used. This representation is very convenient in the analysis of plates and shells. In the embedded modeling of reinforcement, the reinforcing bars are assumed to be an axial member built into element. By considering perfect bond between concrete and steel, the displacements of steel and concrete finite element are assumed to be consistent. Discrete representation of the reinforcement has given widely used. In this representation, steel is assumed to be a force member connecting the nodal points having two degrees of freedom. In this case the one-dimensional steel element is superimposed on the corresponding two-dimensional concrete finite element easily. Beside of simplicity, this method account for possible displacement of reinforcement with respect to the surrounding concrete[13]. For these reason in the present study the discrete representation is adopted for plane stress state problems.
unı,Fnı
un2,F
a
•
• x
Figure 2. Member in local coordinates
F%1
c
2cs
-c
2-cs
Ux1 FniA
SE
Scs
s2-cs
- s
2 uy1L
- c
2-cs
c2cs
Ux2 Fn 2J
_
-cs
- s
2cs
s
2J
_Uy2 j c = cos0 , s = sin0 (15)where As is the cross-sectional area, L is the length of the bar element, Es is the modulus of elasticity., F1 and F2 are the axial end forces and u1 ande u2 axial end displacements of reinforcing bar as defined in Fig. 2.
5. BOND MODELLING
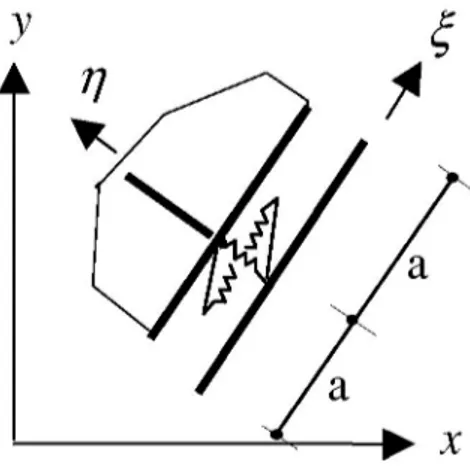
Ultimate load capacity of a reinforced member depends heavily on the bond between reinforcement and concrete. However, bond is very complex and depends on various parameters of concrete as well as on various parameters of concrete as well as on those of reinforcement. In the early finite element studies the influence of bond is taken account by assuming linear-elastic links between concrete and steel. By considering various test results, this assumption is redefined by developing more complex behavior. Some parameters, such as concrete quality, reinforcement quality and diameter, reinforcement surface, aggregate dispersion, and placement of reinforcement in concrete are important for bond [14].
J
•
C
• x
Figure 3. Bond Modeling
Bond is modeled by using springs to demonstrate the interaction between reinforcement and concrete. The constituve relationsip for the element relates shear and normal forces to the nodal displacement by
(16)
"
FC"
KC0
"
A£
"
L
Fn J
L 0
Kn _ L
An J
KC +K
¡fs
2K£c-Kfc -KC -K$ -K£c+Kf.
£ +KC -Ksc+Kfc - £ -K^S
K^+K/ Ksc-Ksc
simetrik
(17) c = cos0 , s = sin0K matrix given in 17 could be stated with matrix given in 16. Equavelent spring coefficients k^ is defined with Equation 18. Dowel effect kq is generally negletted.
K£ = 2a k£ (18)
Bond stress is derived by slip rigidity. Slip rigidity is defined as dxb / dA, and
Kc=
2a n 0
d Tbd
A(19)
Various formulations are proposed to represent the bond and stress-slip relation determined in the related experiments [15]. Nilson [16] the following
bond stress Tb and slip A relationship is used proposed based on experimental data of Bresler and Bertero [17]. In the present study Equation 20 is applied for bond stress:
T = 979 A - 57241 A2 + 835627 A3
(20)Here, Tb is in N/mm2 and A is mm units.
6. NUMERICAL EXAMPLE
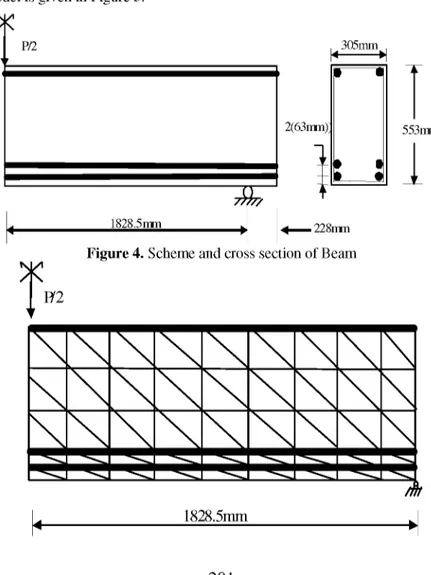
For numerical application, a simply supported beam with 3.7m span is used. This beam is experimentally investigated in a study of Bresler and Scordelis [18]. The scheme of the half part of beam is given in Figure 4. For analysis part, triangular finite element model with 6 degree of freedom is used. The model is given in Figure 5.
>K
P/2 305mm4———M
A)//
2(63mm) 553mm 1828.5mm 228mm NJ/1/ N
Figure 4. Scheme and cross section of Beam
P/2
1828.5mm
tit
—W
Figure 5. Finite Element Modeling of Sample Beam
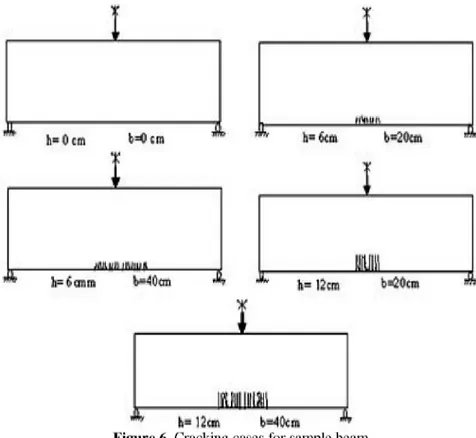
In the analyses, modulus of elasticity of concrete Ec=23215 N/mm2, concrete strength fc=24 N/mm2, modulus of elasticity of reinforcement Es=217880 N/mm2, yield strength fy=555 N/mm2, total reinforcement in tension As=2580 mm2 , total reinforcement in compression As = 253 mm2. In figure 6, different cases are shown where cracking length for beam span is h, and cracking depth is b.
1 1 r
8 12
Displacement (mm)
Figure 7. Load-Displacement Curve of Sample Beam
In Figure 7, load-displacement curve is given for the case before loading and without cracking in comparison with experimental results.
T
3 12
Displacement (nun)
In the analyses, when h is 6cm, and b increases from 20cm to 40cm, amount of cracking members increase 10% from the beginning. Collapse load capacity does not change. When h is 6cm, and b is 20cm, and single load in mid span comes up to 400 kN, bond is lost. However, when b is 40cm, and single load in mid span comes up to 325 kN, bond is lost. When h is 12 cm, and b is 20cm and 40cm, and single load in mid span comes up to 325 kN, bond is lost. In Figure 8, load-displacement curve of the beam for different cases is given
7. CONCLUSION
Cracks in concrete change the load carrying capacity of the structure. Especially, when the cracks appear at the mid span, structural behavior change reasonabely. As a result of nonlinear finite element modeling of the beam, continuous loading in mid span cause increase the cracking. When the cracking occur in concrete cover, initial modulus of elasticity and displacements do not change reasonabley. However it make cracking increase by loading. When the applied load is equal to 30% of the maximum carrying load, cracking is more effective on displacements. With the increase of the loading, the effectiveness is increasing. For analytical investigations of reinforced concrete structures, it is assumed that there is a perfect bond between concrete and reinforcement. Regarding with this assumption, for cracked section, bond analyses should be taken into consideration. Investigations show that, for cracked sections, increase of b and h causes bond in this sections is seen at lower load values. This cause increase the amount of cracks and decrease in load carrying capacity.
KAYNAKLAR
[1] Celep, Z. ve Kumbasar, N.; Betonarme Yapılar, Sema Matbaası, İstanbul, (1998). [2] Desayi, P., Krishnan, S.; Equation for the Stress-Strain Curve of Concrete, ACI J. 61 (1964), 345-350.
[3] Saenz, L. P.; Equation for the Stress-Strain Curve of Concrete, ACI J. 61 (1964), 1229-1235.
[4] Kupfer, H. B., Hildsdrof, H. K., Rüsch, H.; Behavior of Concrete under Biaxial Stresses, ACI J. 66 (1969), 556-566.
[5] Liu, T. C., Nilson, A. H., Slate, F. O.; Stress Strain Response and Fractures of Concrete in Uniaxial and Biaxial Compression, ACI J. 69 (1972) 291-295.
[6] Kupfer, H. B., Gerstle, K. H.; Behavior of Concrete under Biaxial Stresses, J. Eng. Mech. Div. 99 (1973), 552-866.
[7] Büyüköztürk, O.; Nonlinear Analysis of Reinforced Concrete Structure, Comp. and Struc. 7 (1977), 149-156.
[8] Chen, W. F.; Plasticity of In Reinforced Concrete, McGraw-Hill Book Company, New York, (1982).
[9] Rashid, Y. R.; Analysis of Prestressed Concrete Pressure Vessels, Nuclear Engineering and Design. 7 (1968), 334-344.
[10] Al-Mahaidi.; Nonlinear Analysis of Reinforced Concrete Deep Members, Research Report No. 79-1, Department of Structural Engineering, Cornell University (1979).
[11] Mufti, A. A., Mirza, M. S., McCutcheon, J. O., Houde, J. A.; Study of the Behavior of Reinforced Concrete Elements, Structural Concrete Series No.7-5, Mc Gill University, (1970).
[12] Mufti, A. A., Mirza, M. S., McCutcheon, J. O., Houde, J. A.; Study of the Nonlinear Behavior of Structural Concrete Elements, Proceeding of the Specialty Conference of Finite Element Method in Civil Engineering, Montreal, Canada, (1972). [13] ASCE Task Committee on Finite Element Analysis of Reinforced Concrete, ASCE Special Publication, New York, (1982).
[14] Allwood, R. J., Bajarwan, A. A.; Modeling Nonlinear Bond-Slip Behavior for Finite Element Analyses of Reinforced Concrete Structures, ACI Structural J. 93 (1996), 538-544.
[15] Bangash, M. Y. H.; Concrete and Concrete Structures: Numerical Modelling And Application, Elsevier Applied Science, London and New York, (1989).
[16] Nilson, A. H.; Nonlinear Analysis of Reinforced Concrete by Finite Element Method, ACI J. 65 (1968), 757-766.
[17] Bresler, B., Bertero, V.V.; Behavior of Reinforced Concrete Under Repeated Load, ASCE J. Struc. Div. 94 (1968), 1567-1590.
[18] Bresler, B., Scordelis, A. C.; Shear Strength of Reinforced Concrete Beams, J. ACI. 60 (1963), 51-72.
