THE RELATIONSHIP BETWEEN ECONOMIC GROWTH
AND STOCK RETURNS: AN EXAMPLE FROM TURKEY
EKONOMİK BÜYÜME VE BORSA GETİRİSİ ARASINDAKİ İLİŞKİ: TÜRKİYE ÖRNEĞİ
Mehmet ŞENTÜRK
(1), Gökcen SAYAR ÖZKAN
(2),
Yusuf Ekrem AKBAŞ
(3)(1) Kilis 7 Aralik University, Faculty of Economics and Administrative Sciences (2) Gaziantep University, Vocational High School
(3) Adiyaman University, Faculty of Economics and Administrative Sciences (1)[email protected], (2) [email protected], (3) [email protected] ABSTRACT: Financial development is one of the most important determinants of
the economic development. Financial developments in Turkey began in the early 1980s and still have continued. During this period, it has survived a severe interaction between financial development and economic growth. In this study, the causality relationship between stock returns and economic growth in Turkey it was analysed over the period 1998Q2-2014Q2. In this context; firstly, Bootstrapped Toda-Yamamoto and Frequency Domain causality tests were applied in order to understand the causality relationship between the two variables. As a result of the Bootstrapped Toda-Yamamoto causality test results, there is no relation of causality between the variables, but according to Frequency Domain causality test stock returns cause the economic growth in short term and economic growth cause stock returns in medium term.
Keywords: Financial Development; Stock Returns; Economic Growth; Turkey JEL Classifications: C32; D53; E44; G00; O16; O40
ÖZET: Finansal gelişme ekonomik kalkınmanın en önemli belirleyicilerinden
birisidir. Türkiye’de finansal gelişme 1980’li yılların başında başlamış ve halen de devam etmektedir. Geçen süre içerisinde finansal gelişme ile ekonomik kalkınma arasında ciddi bir etkileşim yaşanagelmiştir. Bu çalışmada, Türkiye’de 1998Q2-2014Q2 döneminde borsa getirisi ve ekonomik büyüme arasındaki ilişki incelenmiştir. Bu bağlamda, iki değişken arasındaki nedensellik ilişkisini tespit etmek amacıyla Bootstrap tabanlı Toda-Yamamoto ve frekans dağılımı nedensellik testleri uygulanmıştır. Bootstrap tabanlı Toda-Yamamoto nedensellik testi sonuçlarına göre değişkenler arasında nedensellik ilişkisi bulunmamaktadır. Fakat, frekans dağılımı nedensellik testi göstermektedir ki; borsa getirisi kısa dönemde ekonomik büyümenin ve ekonomik büyüme de orta dönemde borsa getirisinin nedenidir.
Anahtar Kelimeler: Finansal Gelişme; Borsa Getirisi; Ekonomik Büyüme; Türkiye
1. Introduction
Financial markets, especially stock exchange markets, are closely related to macroeconomic variables. The world economy has become more integrated with each other after acceleration of globalization in recent years, In fact, rises in commercial relations and degree of openness also increase the rate of economic risk.
Thus, the fluctuation in a market that the economy has tight connection in business could turn around the balance in that economy. This situation was seen in global financial crisis in 2008.
One of the fastest financial markets that react to the economic fluctuation is stock exchange markets. At that point, it could not be enough to examine stock exchange markets in order to make a reliable interpretation on the economic situation by itself but it could be an important measure. Additionally, stock exchange markets play a vital mirror role for economy. In fact, an increase in capacity of export and consequently growth in profitability, industrial production and expansion of the capacity utilization utterly affect the stock exchange markets positively. In addition, increase the benefits of stock exchange market strengths liquidity status and equity capital of companies in stock markets transaction. This situation has a positive impact on economic growth. However, there is a case should not be forgotten. It can cause important problems in economy if the number of people who call themselves as engineers of economy such as brokers, dealers etc. is more than engineers in real sector. In this case consumption exceeds production in economy. Therefore, experiencing fluctuation in the financial markets significantly affect the economy. Exactly at that point a question comes to the mind, what kind of relation does it have between stock markets and economic growth. The answer of this question may vary from region to region and country to country. Such that the degree of dependence on foreign economy, growth capacity, market size, production capacity, foreign share of the market etc. many factors can affect that.
2. Literature Review
There are many studies available in the literature that examines the relationship between economic growth and stock returns. However, there is not enough study about Turkey. VAR analysis and the Granger causality analysis has been used for Turkey whereas it has been used different methods in foreign studies. In this regard, the studies are as follows:
Gokdeniz et al. (2003), the impact of financial markets on economic growth was investigated with the method of least squares between 1989-2002 periods in Turkey. In this context, stock markets and private bonds have no effect on economic growth in Turkey. Basdas and Soytas (2009) have examined the relationship between the VAR analysis and the Granger causality analysis, economic growth, stock returns and interest rates in Turkey for 1997:01-2008:06 periods. As a result, two different causalities were determined from interest rates and stock revenue to economic growth.
Aydemir (2008), made some study for the same period by using Vector Error Correction Model (Vector Error Correction Model) (VECM) and Granger causality test, as a result of that he has identified in the long term meaningful and bidirectional relationship between stock returns and economic growth. According to Baker et al. (2005) between 1958-2004 periods, the return on financial assets in the United States was seen to increase in the period of economic growth.
Furthermore, the foreign trade balance must be equal to savings investment balance in order to have a strong economic structure.
Davis et al. (2010) has examined the long term relationship between stock market returns and economic growth in emerging economies during 2000:01 and 2009:12 periods. According to that study, there is a long-term correlation between economic growth and stock market returns.
Dallas and Hess (2005), have examined the relationship between financial development and stock market returns by analysing panel data in 47 countries during 1980-1999 period. They claim that financial development (banking sector) represents the economic growth. In this context, they have reached a conclusion that claims financial development has a profound effect on the stock market return. Madsen et al. (2013), has examined the relationship between stock market returns and economic growth in 20 OECD countries by using panel co-integration analysis. As a result of this analyse, he has come through that there is a positive and significant relationship between these variables apart from 1916-1950 period. In this study, it is investigated that causality relationship between economic growth and stock returns over the period of between 1998Q2-2014Q2. Although some studies available on this issue in the literature about Turkey, these studies were slightly dated. In fact, Turkey has entered a new phase since 2000s. In this period, the financial markets were affected significantly by the major developments such as the Central Bank of the Republic of Turkey become autonomous, transited from fixed exchange rate regime to floating exchange rate regime, the establishment of the Banking Regulation and Supervision Agency.
Thus, in this period it has arisen the importance of financial markets for Turkey. For this reason, this study is important for macroeconomic literature. The study consists of following sections, the first and second sections include introduction and literature review respectively. The third section includes the theoretical background related to relationship between the stock returns and economic growth. In the fourth section it is explained that financial markets which are affected by political dynamics. The fifth section introduces the methodology and data which are used in this study. The sixth section consists of the findings that obtained from the result of the empirical methods which are used in this study. Finally, the last section includes the conclusion and political recommendation.
3. Theoretical Background
There are a lot of theories that explain correlation between the economic growth and stock returns. However, we reviewed five existing theories in this study which were reviewed by Morck et al. (1990). These are; passive informant theory, accurate active informant theory, faulty active informant theory, financing theory and stock market pressure theory.
i. According to the passive informant hypothesis, stock prices reflect the present
discounted value of all future dividends and dividend growth is related to GDP growth. Thus, a correlation between this year’s stock returns and next year’s economic growth arises (Mauro, 2000: 5).
ii. In the accurate active informant hypothesis, stock price changes provide
information about the market’s expectations for future economic developments to investors. Investors base their investment decisions upon that information and justify
the market’s expectations. Therefore, the stock market acts as a sunspot. In this case, stock price changes turn out to be perfectly correlated with fundamentals (Mauro, 2000: 6).
iii. Under the faulty active informant hypothesis, decisions of investors are affected
by stock price movements. However, investors cannot distinguish between movements reflecting fundamentals and movements reflecting market sentiment. Therefore, stock market movements can mislead investors into overinvesting compared with what later turns out to be warranted by fundamentals (Mauro, 2000: 6).
iv. In the financing hypothesis, based upon Tobin q theory, It is argued that when
stock prices are high compared to the replacement cost of capital, investors expand their activities by investing new physical capital rather than purchasing existing firms on the stock market. Thus, high stock returns will tend to be followed by high investment and economic growth (Mauro, 2000: 6).
v. The last hypothesis is stock market pressure. This hypothesis suggests that stock
price changes can influence investment even if they neither transmit information nor alter financing costs. If investors have negative impression on a firm’s prospects decrease its stock price, investors may cut their investment prospects in order to protect themselves for possibility of being fired (Mauro, 2000: 6).
4. The Dynamics Affecting Financial Markets and Economic
Growth in Turkey
Especially since 2002, it is possible to say that there is a strong interaction between financial markets and economic growth. BIST stock index and stock returns provide important signals about general trend of economy. However, it is obvious that there are various issues adversely affecting economic and financial stability from time to time. In the period before 2002, there were much political turbulences that negatively affected economic growth. These turbulences not only weakened the political authority but also caused an unstable economy.
1980 military coup and its results are possibly the most distinctive turbulence that affected economic growth negatively. (Gokce, 2013: 223). During 1980-2002 period lots of adverse events, especially February 28th process, happened and there cases induced economic unsteadiness.
After the 2002 elections, compatible, comprisable, strong-willed and saving policies enabled the political authority to capture the absolute power since 2007. The political stability accompanied economic stability. In this term, some cases negatively affected economic growth time to time but these problems solved in a short time and economic growth prioritized.
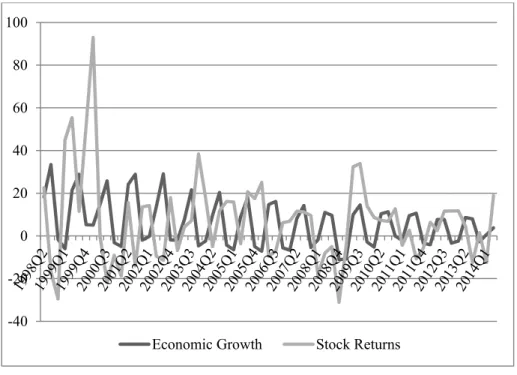
The most significant indicator that represents financial market in Turkey is Borsa Istanbul (BIST) National 100 Index. In this context, this paper considers return of BIST Index. Figure I show that the percentage change of economic growth and stock returns in the period of 1998-2014. According to this, especially in the next period
of 2002 a strong correlation can be seen between stock returns and economic growth.
Figure 1. Percentage Change of Economic Growth and Stock Returns in Turkey
Source: Prepared by authors using Central Bank of the Republic of Turkey data.
5. Data and Empirical Methodology
5.1. DataIn this study, the causality between the data of stock returns and economic growth in Turkey, covering 1998Q2-2014Q2, have been analysed by using unit root tests and causality tests. The two variables used in this test are stock returns (SR) and economic growth (EG).
Explanations of the variables are as follows;
SR: Total quarterly return rates (%) of entire BIST 100 Index (Borsa Istanbul). EG: Quarterly growth rate (%) of Turkey’s economy (GDP).
5.2. Empirical Methodology
In order to determine the stability of the series, Augmented Dickey Fuller (ADF) and Philips-Perron (PP) unit root tests will be used. After applying the unit root tests, and Bootstrapped Toda-Yamamoto and Frequency Domain causality tests will be used for determining the causality relationship between economic growth and stock returns. Bootstrapped Toda-Yamamoto and Frequency Domain causality tests are explained below.
5.2.1. Bootstrapped Toda-Yamamoto Causality Analysis
Toda-Yamamoto (1995), implement the Wald test, have a chi-square distribution, add degree of integration of the series to number of lag found in VAR model. Thus
-40 -20 0 20 40 60 80 100
Toda-Yamamoto eliminates the problems that create standard VAR model at level value of variables in causality analysis, emerges while they determine the degree of integration of the series. Accordingly, the process of VAR (2) can be expressed as;
max max 1 1 1 1 1 lnEGt k di
α
ilnEGti ik dβ
ilnEGtiε
t + + = = =
+
+ (1) max max 2 2 1 2 1 lnSRt ik dα
ilnSRti k diβ
ilnSRtiε
t + + = = =
+
+ (2) maxd States degree of maximum integration of variables in model k expresses optimal lag length achieved in VAR model.
ε
t States also error correction termbased upon white noise hypothesis.
Hacker and Hatemi-J (2006) proved that the implication based on the Toda-Yamamoto test statistic becomes more precise if Bootstrap distributions are utilized instead of asymptotic chi-square distributions. For this reason, we will make use of the Bootstrap simulation techniques to produce our own critical values in causality tests.
The Bootstrap technique is based on resembling the data set to estimate the distribution of a test statistic. Using this distribution can decrease deviation in implication by providing more precise critical values.
It should be referred this technique is based on the empirical distribution of the underlying data set and it is not sensitive to assumption of normality. Another issue that is important to take into account is the presence of autoregressive conditional heteroscedasticity (ARCH). In order to guarantee that the presence of ARCH effects does not render deviation in estimated results.
It is applied the following way for performing the Bootstrap causality test. First, the raw residuals are obtained with the restriction for the null hypothesis of no Granger causality on one of the included equations. Then, it is rescaled the estimated raw residuals with the leverages procedure suggested by Davison and Hinkley (1999) to obtain a correct variance. The next step is computed the adjusted residuals ensure that the mean of the adjusted residuals are zero. After adjusted residuals are computed, the simulated data, (yt*) based on the estimated coefficients (
1 , ,...A Ap
α∧ ∧ ∧ ) and the Bootstrapped adjusted residuals (
ε
∧t*). Finally, the MWALD test statistic is calculated. An important issue in applying the Bootstrapping simulation approach is the size of the Bootstrap sample (Nb). In this study, we will use Nb=1000 as a study of Davidson and MacKinnon (2004).5.2.2. Frequency Domain Causality Analysis
Frequency domain causality analysis explains the causal relations between the variables over the short, medium and long-terms. In this respect, it is separated from the traditional causality analysis. In particular, in this paper we employ a methodology founded upon the study of Breitung and Candelon (2006, 2001), which starts from the measures of causality in the frequency-domain proposed by Geweke (1982) and Hosaya (1991) to test for causality in predetermined frequency.
We assume that zt =[ , ]'x yt t is a two-dimensional vector of the time series observed
at t=1,...,T and that represents a finite delay VAR fermentation of the
following type (Breitung and Candelon, 2006: 364); ( )L zt t θ = (3) ε Where: 1 (L)=I- p p L L
θ
θ
− −θ
(4) is a 2 x 2 lag k zt t k L =z− polynomial.Let the error vector be white noise with ( ) = 0 and ( ′) = (where is positive) and the lower triangular matrix of the Cholesky decomposition =
. Thus, the moving average representation of the system (assumed to be stationary) is: 1 11 12 21 22 2 ( ) ( ) ( ) ( ) ( ) t t t t t t x L L z L y L L ε φ φ φ ε φ φ ε = = = (5) 1 11 12 1 21 22 ( ) ( ) ( ) ( ) ( ) t t t L L L L L η η Ψ Ψ η = Ψ =Ψ Ψ (6) Where
Φ
( )
L
=
θ
( )
L
−1 andΨ
( )
L
= Φ
( )
L G
−1 Equation 8 reports the spectral density of :{
2 2}
11 12 1 ( ) ( ) ( ) 2 i i x f ω e ω e ω π − − = Ψ + Ψ (7)While equations 9 and 10 define the causality measurements proposed by Geweke (1982) and Hosaya (1991): 2 11 2 ( ) ( ) log ( ) x y x i f M e ω π ω ω → − = Ψ (8)
( )
2 12 2 11 0 ( ) log 1 ( ) ( ) 0 i i y x e e H M ω ω ψ ψ ω ω − − → = + = = (9)If ψ12(e−iω) =0 then y is not a frequency causality
( )
ω
of x. Therefore, in order to test that y does not cause x at frequency
( )
ω
our null hypothesis is:0 y x( ) 0
6. Empirical Results
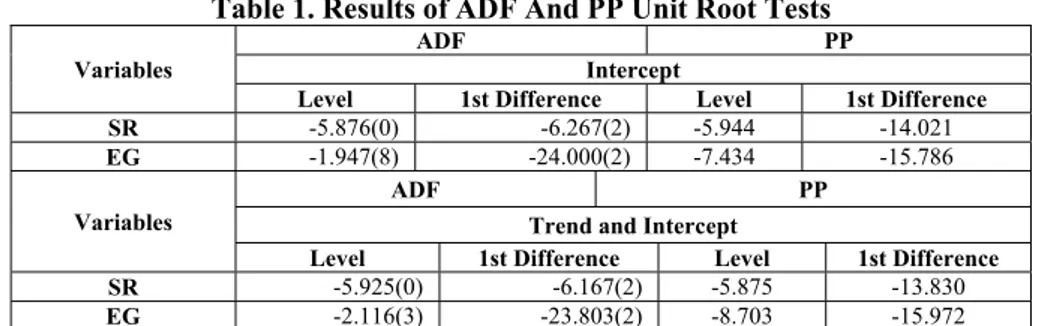
ADF and PP unit root tests are used for finding if the series have any unit roots and the degree of stationary of the series.
Table 1. Results of ADF And PP Unit Root Tests
Variables
ADF PP Intercept
Level 1st Difference Level 1st Difference
SR -5.876(0) -6.267(2) -5.944 -14.021
EG -1.947(8) -24.000(2) -7.434 -15.786
Variables
ADF PP Trend and Intercept
Level 1st Difference Level 1st Difference
SR -5.925(0) -6.167(2) -5.875 -13.830
EG -2.116(3) -23.803(2) -8.703 -15.972
* Figures in parenthesis below the lag lengths are selected using the Schwartz Information **The asymptotic critical values for intercept -3.571, -2.922 at the %1 and %5 levels. *** The asymptotic critical values for trend and intercept -4.156, -3.504 at the %1 and %5 levels.
According to ADF and PP unit root test, both variables’ series are stable. Therefore, both series are I(0). After using unit root test, causality tests are applied. In addition, Bootstrapped Toda-Yamamoto causality test results are shown in Table 2. According to Bootstrapped Toda-Yamamoto causality test results there is no causality between the variables.
Table 2. Results of Bootstrapped Toda-Yamamoto Causality Test
The Null Hypothesis The Estimated Test Value (MWALD) 1% Bootstrap Critical Value 5% Bootstrap Critical Value 10% Bootstrap Critical Value SR→EG 5.417 15.055 10.129 8.141 EG→SR 7.9 14.899 9.996 8.160
Notes: The notation → implies non-Granger causality. The notation ***, **, and * means that the null hypothesis on Non-Granger causality is rejected at the 1%, 5% and 10% significance level, respectively. The lag order of the VAR model, p, was set to four. Also the augmentation lag, d, was set to zero since all variables do not contain unit root.
Frequency domain causality analysis explains the causal relations between the variables over the short, medium and long-terms. In this respect, it is separated from the traditional causality analysis. So, it show that stock returns cause the economic growth in short term and economic growth cause stock returns in medium term.
Table 3. Results of the Frequency Domain Causality
i
ω
Long Term Medium Term Short Term 0.01 0.05 1.00 1.50 2.00 2.50 SR→EG 0.790 0.674 1.379 2.332 0.925 6.461* EG→SR 0.503 0.489 13.019* 1.961 0.272 2.728*Note: F- distribution with (2, T-2p) degrees of freedom equals 5.99. For every ωi (frequency) between 0
and
π
,ω∈(0, )π7. Conclusion
Liberalization and integration of financial markets have sped up due to globalization. This situation has created an attractive investment in countries like Turkey which also has increased the risks for premium financial markets. Higher risks affect the profitability. Moreover, as stated earlier in this study, Turkey went through a new period which Central Bank became autonomous, floating exchange rate was accepted as a policy, Banking Regulation and Supervision Agency (BRSA) was established and political stability was sustained. In addition to these developments, low exchange rate-high interest policy implemented since the early 2000s. It has increased the cost of physical investment and reduced the cost of portfolio investment. Therefore, applied policy has made portfolio investments attractive in Turkey since the early 2000s.
All these steps not only created a safer environment for financial markets but also attracted foreign direct investments. It also increased the stock return rates. Increased stock return rates strengthened the liquidity and capitals of the firms. Therefore, firms could increase the investments. Increased investment was positively affecting the economic growth. In this context, increasing in stock returns and economic growth due to the decline in portfolio investments is consistent with the financing hypothesis analysing the relationship between economic growth and stock returns. Accordingly, applied policy reduced the cost of portfolio investments in Turkey since the early 2000s. This situation considerable attracted the attention of investors. Hence, there has been a significant increase in portfolio investments during the subject work periods in addition to increase in physical investment. Therefore, it can be understood that passive informant and accurate active informant hypothesis are valid in Turkey.
In this study, the causality relationship between stock returns and economic growth of Turkey was examined by Bootstrapped Toda Yamamoto and Frequency Domain causality tests. As a result of the Bootstrapped Toda-Yamamoto causality test results, there is no causality between the variables, but Frequency Domain causality test show that stock returns cause the economic growth in short term and economic growth cause stock returns in medium term.
Although financial markets are crucial for economic growth, if the number of finance engineers exceed the number of real economy’s engineers by far, it will reverse the positive effect described above. Dealing only with financial markets and neglecting the importance of real economy will create a society of consumption. Insufficient production in real economy may lead to a chaos. What should be done is that, real economy and financial markets should grow in balance.
8. References
AYDEMIR, O. (2008). Hisse senedi getirileri ve reel sektör arasındaki ilişki ampirik bir çalışma. Afyon Kocatepe University Journal of Economics and Administrative, X(II), ss. 37-55.
BAKER, D., DeLONG, J.B., KRUGMAN, P. (2005). Asset returns and economic growth.
Economic Research Division of the Federal Reserve Bank of St. Louis, 36(1), pp.
236-330.
BASDAS, U., SOYTAS, U. (2009). Do stock returns trigger economic growth? evidence from Turkey. 13.th Annual International Conference on Macroeconomic Analysis and
BREITUNG, J., CANDELON, B. (2001). Testing for short and long run causality: the case of the yield spread and economic growth, Discussion Papers 96, Humboldt University of
Berlin, Interdisciplinary Research Project 373: Quantification and Simulation of Economic Processes.
BREITUNG, J., CANDELON, B. (2006). Testing for short and long-run causality: a frequency domain approach, Journal of Econometrics, 132, pp. 363−378.
Central Bank of the Republic of Turkey, evds.tcmb.gov.tr, (Access Date: 01.09.2014). DALLAS, H., HESS, M.K. (2005). Financial development and stock returns. Journal of
International Money and Finance, 24(6), pp. 891-912.
DAVIS, J.H., DIAZ, R.A., COLE, C.W., SHANAHAN, J. (2010). Investing in emerging markets: evaluating the allure of rapid economic growth. Vanguard Research, pp. 1-12. DAVISON, A. C., HINKLEY, D.V. (1999). Bootstrap methods and their application.
Cambridge University Press. Cambridge, UK.
GEWEKE, J. (1982). Measurement of linear dependence and feedback between multiple time series, Journal of American Statistical Association, 77, pp. 304–313.
GOKDENİZ, I., ERDOĞAN, M., KALYUNCU, K. (2003). Finansal piyasaların ekonomik büyümeye etkisi: Türkiye örneği (1989-2002). Journal of Trade and Tourism Education
Faculty, ss. 107-117.
GOKCE, A.F. (2013). Asker-sivil ilişkilerinde değişim ve dönüşüm, mağduriyetler ve sonuçlar. Kamu Yönetiminde Değişim ve Güncel Sorunlar, Ed. Eyüp Günay İsbir, ss. 213-239.
HACKER, R.S., HATEMI-J, A. (2006). Tests for causality between integrated variables using asymptotic and bootstrap distributions: theory and application. Applied Economics, 38, pp. 1489-1500.
HOSAYA, Y. (1991). The decomposition and measurement of the interdependence between second-order stationary process, Probability Theoryand Related Fields, 88, pp. 429-444. MADSEN, J.B., DZHUMASHEV, R., YAO, H. (2011). Stock returns and economic growth.
Applied Economics, 45, pp. 1257-1271.
MAURO, P. (2000). Stock returns and output growth in emerging and advanced economies,
IMF Working Papers, 89, pp. 1-35.
MORC, R., SHLEIFER A., VISHNY R. (1990). The stock market and investment: is the stock market a sideshow?. Brookings Papers on Economic Activity, 2, pp. 157-202. TODA, H.Y., YAMAMOTO, T. (1995). Statistical inference in vector autoregressions with