Tarım Bilimleri Dergisi
Tar. Bil. Der. Dergi web sayfası: www.agri.ankara.edu.tr/dergi
Journal of Agricultural Sciences
Journal homepage:www.agri.ankara.edu.tr/journal
TARIM BİLİMLERİ DERGİSİ
—
JOURNAL OF AGRICUL
TURAL SCIENCES
21 (2015) 108-122
Kinetic of Color and Texture Changes in Rehydrated Figs
Sara ANSARIa, Neda MAFTOON-AZADb, Ebrahim HOSSEINIa, Asgar FARAHNAKYc,
Gholam Hassan ASADIa
aDepartment of Food Science and Technology, Science and Research Branch, Islamic Azad University, Tehran, IRAN bFars Research Center for Agriculture and Natural Resources, Zarghan, IRAN
cDepartment of Food Science and Technology, School of Agriculture, Shiraz University, Shiraz, IRAN ARTICLE INFO
Research Article
Corresponding Author: Ebrahim Hosseini, E-mail: [email protected], Tel: +98 (021) 448 685 35 Received: 12 February 2014, Received in Revised Form: 22 March 2014, Accepted: 01 April 2014
ABSTRACT
Intermediate-moisture figs obtained by rehydration of dried figs are more suitable for direct consumption. Colour and texture are the most important quality attributes, which influence the acceptability of this product. In this research the kinetic of color and texture changes in rehydrated figs were studied as a function of time and temperature (25-90 °C). All hunter colour parameters (L*, a* and b*) were used to estimate the extent of colour change during rehydration. Results indicated that among different kinetic models, a combined kinetic model provided the best fit. Moreover, texture development kinetics over all temperature ranges were satisfactorily described by means of first-order kinetic model compared with second-order, Weibull and Peleg models. Model parameters including texture softening (k) and residual constant (A) values were calculated which also confirmed the decrease in firmness of the dried figs due to the plasticization effect of water intake. The Arrhenius model described well the temperature dependence of the reaction rate constant for colour and texture parameters.
Keywords: Dried figs; Rehydration; Kinetics model; Colour; Texture
Rehidrasyona Tabi Tutulan Kuru İncirde Renk ve Doku Değişim
Kinetiği
ESER BİLGİSİ
Araştırma Makalesi
Sorumlu Yazar: Ebrahim Hosseini, E-mail: [email protected], Tel: +98 (021) 448 685 35 Geliş Tarihi: 12 Şubat 2014, Düzeltmelerin Gelişi: 22 Mart 2014, Kabul: 01 Nisan 2014
ÖZET
Rehidrasyona uğramış kuru incirlerden ortalama neme sahip olanların doğrudan tüketimi mümkündür. Kuru incirin renk ve dokusu bu ürünün kabul edilebilirliğini etkileyen en önemli kalite özellikleridir. Bu araştırmada rehidre edilmiş incirlerin renk ve doku kinetiği, zamanın ve sıcaklığın (25-90 °C) fonksiyonu olarak ele alınmıştır. Rehidrasyon
Kinetic of Color and Texture Changes in Rehydrated Figs, Ansari et al
109
Ta r ı m B i l i m l e r i D e r g i s i – J o u r n a l o f A g r i c u l t u r a l S c i e n c e s 21 (2015) 108-1221. Introduction
Fig, one of the earliest cultivated fruits, is note of the most important dried products with several varieties dried and stored for later consumptiom. It is probably originated in Western Asia, and spread to the Mediterranean (Slavin 2006; Vinson 1999). Figs have a great importance in nutrition due to being important sources of carbohydrates. They contain essential amino acids and are rich in vitamins A, B1, B2 and C and minerals (Veberic et al 2008). The main exporters of dried figs are Turkey, United States of America and Iran, respectively. Iran has approximately 10% of the total production of the world, and about 90% of this crop is sold as dried fruit. Therefore, dried figs have a high economic value for Iran Agriculture. Most of the figs in Iran are produced in the Fars region (FAOSTAT 2010). The main problems with dried figs are a decrease in food quality and safety due to hazardous microorganisms, aflotoxin B1 and some storage pests such as Ephestia or Plodia (Oztekin et al 2006). Moreover, the process of drying figs may lead to important textural changes such as hardness and shrinkage, which may have a negative impact on their marketability (Farahnaky et al 2010). One way to increase the consumer acceptability of this valuable agricultural commodity is the production of “intermediate-moisture figs” (Pressi figs) in fig factories obtained by soaking of dried figs in water followed by conditioning. The main problem with this product is the rapid change of color after production which caused the product failure and may have a negative impact on its marketability. Rehydration, a part of industrial processing step for production of this new commodity, can be effective
in controlling the browning and texture of the final product.
Rehydration is a process of moistening dry material (Femenia et al 2000). Rehydration is usually carried out by soaking the dry material in large amounts of water, although, instead of this, some authors have used other liquids such as fruit juices, sucrose, glucose or glycerol solutions. (Maldonado et al 2010; Krokida & Marinos-Kouris 2003). Rehydration is influenced by several factors, grouped as intrinsic factors (product chemical composition, pre-drying treatment, drying techniques and conditions, post-drying procedure, etc.) and extrinsic factors (composition of immersion media, temperature, hydrodynamic conditions) (Rastogi et al 2004). It is more desirable for the rehydration process to be as fast as possible in order to retain suitable structural and chemical characteristics and acquire better quality-reconstituted products (flavor, texture and nutritional quality) (Sanjuan et al 2001). The knowledge of the rehydration kinetics of dried products is important to optimize processes from a quality viewpoint since rehydration is a key quality aspect for those dried products that have to be reconstituted before their consumption (Garcia-Pascual et al 2006). Texture and colour characteristics are important quality parameters which are related to temperature and the pre-drying time of the rehydration process. It is more desirable for colour properties to be as close to that of the fresh product as possible, so determining the most precise rehydration/dehydration conditions is of great economic importance (Moreira et al 2008). The majority of publications on the kinetics of food color changes report zero or first order degradation
sırasındaki renk değişiminin boyutlarını tahmin etmede tüm renk parametreleri (L *, a * ve b * ) kullanılmıştır. Sonuçlar, farklı kinetik modeller arasında, kombine kinetik modelin en uygun olduğunu göstermiştir. Ayrıca, tüm sıcaklık dağılımında doku gelişim kinetiğinin ikinci derece Weibull ve Peleg modeline göre birinci derece kinetik modelle daha iyi açıklanabileceği görülmüştür. Doku yumuşatıcı (k) ve atık sabitini (A) içine alan model parametreleri hesaplanmış ve su alımının plastikleşme etkisi nedeniyle kuru incirlerin sıkılığındaki azalma teyit edilmiştir. Renk ve doku parametreleri için sıcaklığın reaksiyon tepki hız sabitine olan bağımlılığını belirlemede Arrhenius modeli iyi sonuç vermiştir. Anahtar Kelimeler: Kuru incir; Rehidrasyon; Kinetik model; Renk; Doku
Rehidrasyona Tabi Tutulan Kuru İncirde Renk ve Doku Değişim Kinetiği, Ansari et al
110
Ta r ı m B i l i m l e r i D e r g i s i – J o u r n a l o f A g r i c u l t u r a l S c i e n c e s 21 (2015) 108-122reaction kinetic. Nisha et al (2006) used a first-order kinetic model to describe the textural changes of potatoes during thermal processing.
The objective of this study was to study experimentally the colour and textural changes of dried fig during rehydration at different temperatures. Different kinetic equations along with their corresponding coefficients were also evaluated in order to describe textural and colour changes occurring during dried fig immersion in water.
2. Material and Methods
2.1. Raw material
Dried figs (Sabz-cultivar) were purchased from Estahban Fig Research station (Fars province, southern Iran). They were packed in polyethylene bags and stored at 4 °C until analysis. Initial moisture content of dried figs was 6.15% (dry basis).
2.2. Rehydration experiments
Dried fig samples, with a fig to water ratio of 1:3 (w w-1), were rehydrated in distilled water at constant temperatures (25, 60, 70, 80 and 90 °C) for different time intervals using a thermostable water bath (± 0.1 °C). After rehydration, the samples were removed from the bath and weighed after blotting with tissue paper in order to remove superficial water. They were then packed and stored until moisture conditioning. The moisture content of samples was measured according to the AOAC methods (AOAC 1990).
2.3. Colour measurement
Colour of samples after each rehydration period was evaluated using a modified method of Yam & Papadakis (2004). A digital camera (Canon Power-Shot A720, 8.0 megapixels), previously calibrated with standard white and black tile was used to take pictures, after which pictures of the samples were transferred to a PC for further processing. Average values from experimental data at each time were determined. Using Adobe Photoshop CS5 software, the colour parameters of L* (lightness), a* (redness/ greenness) and b* (yellowness/blueness) were
determined in the “Lab” mode of the software. Total colour difference (DE*) was also calculated at the end of each rehydration period with respect to dried figs, employing CIELAB characteristic parameters L*, a*, and b* as follows:
2
12 0 2 0 2 0 * L L a a b b E (1) t K C C 0 0 (2)
K t
C C 0exp 1 (3)
K t
C K K K K C 0 1 1 0 1 0 exp (4)
Fx dt K
Fx d / or FxF0exp
K1t
(5)
K t
F Ft 0exp 1 (t 0 min) (6) t K F Ft1 t 2 1 or K t F F F F t t 2 0 0 (7)
( )
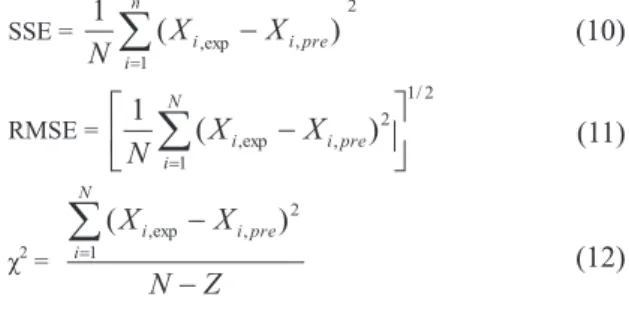
0 ) ( exp aT t bT t F F (8) ) /( 0 t A B t F Ft (9) SSE = 2 1( ,exp , ) 1
n i i ipre X X N (10) RMSE = 2 / 1 1 2 , exp , ) ( 1
N i Xi Xipre N (11) χ2 = Z N X X N i i ipre
1 2 , exp , ) ( (12)
E RT
A A 0exp a (13) (1) Where; L0, a0 and b0 refer to reference values, i.e., colour parameters of dried figs; and L, a and b refer to colour values at the end of various time frames during the rehydration process.2.4. Texture analysis
Texture profile analysis (TPA) of rehydrated samples after conditioning were carried out using a texture analyzer (Texture Analyzer, TA Plus, Stable Microsystems, Surrey, England) with a load cell of 30 kg. Each sample corresponding to a rehydration time after moisture conditioning was subjected to a double compression force test using a cylindrical probe having dimensions greater than those of the sample. Samples were compressed to 20% of their original height by two consecutive compressions using a cylindrical probe of 100 mm diameter at a speed of 1 mm/s. The waiting time between the two-cycles of the TPA test was 10 s. The compression force versus time was used to calculate texture profile parameters. Using the Texture Exponent Lite supplied by the manufacturer: hardness (N) was calculated as the maximum force of the first compression cycle, Compression energy (N sec) was the area under force versus time until maximum force obtained, the function gradient (dimensionless) calculates the gradient of the slope of the curve between the two selected points. All textural measurements were performed at room temperature (22 ± 2 °C) with three replications of each sample.
2.5. Mathematical modeling 2.5.1. Kinetics of colour changes
Numerous references have examined the kinetics of colour of food materials in the literature and the majority of them reported zero-order (Equation 2) or first-order (Equation 3) degradation reaction kinetics.
Kinetic of Color and Texture Changes in Rehydrated Figs, Ansari et al
111
Ta r ı m B i l i m l e r i D e r g i s i – J o u r n a l o f A g r i c u l t u r a l S c i e n c e s 21 (2015) 108-122
2
12 0 2 0 2 0 * L L a a b b E (1) t K C C 0 0 (2)
K t
C C 0exp 1 (3)
K t
C K K K K C 0 1 1 0 1 0 exp (4)
Fx dt K
Fx d / or FxF0exp
K1t
(5)
K t
F Ft 0exp 1 (t 0 min) (6) t K F Ft1 t 2 1 or K t F F F F t t 2 0 0 (7)
( )
0 ) ( exp aT t bT t F F (8) ) /( 0 t A B t F Ft (9) SSE = 2 1 ,exp , ) ( 1
n i i ipre X X N (10) RMSE = 2 / 1 1 2 , exp , ) ( 1
N i i ipre X X N (11) χ2 = Z N X X N i i ipre
1 2 , exp , ) ( (12)
E RT
A A 0exp a (13) (2)
2
12 0 2 0 2 0 * L L a a b b E (1) t K C C 0 0 (2)
K t
C C 0exp 1 (3)
K t
C K K K K C 0 1 1 0 1 0 exp (4)
Fx dt K
Fx d / or FxF0exp
K1t
(5)
K t
F Ft 0exp 1 (t 0 min) (6) t K F Ft1 t 2 1 or K t F F F F t t 2 0 0 (7)
( )
0 ) ( exp aT t bT t F F (8) ) /( 0 t A B t F Ft (9) SSE = 2 1( ,exp , ) 1
n i i ipre X X N (10) RMSE = 2 / 1 1 2 , exp , ) ( 1
N i Xi Xipre N (11) χ2 = Z N X X N i i ipre
1 2 , exp , ) ( (12)
E RT
A A 0exp a (13) (3) Where; (+) and (-) indicate formation and degradation of any quality parameter, respectively. But sometimes relatively simple models described above (Equations 2 and 3) do not adequately represent the colour change phenomena. Therefore, a combined kinetics has been developed in which colour change reactions are considered to consist of two stages: a first phase of coloured compound formation that follows a zero-order kinetic and a second phase of coloured polymers decomposition into non-coloured compounds following first-order kinetic. According to this model, the colour change process can be expressed as follows (Equation 4) (Garza et al 1999):
2
12 0 2 0 2 0 * L L a a b b E (1) t K C C 0 0 (2)
K t
C C 0exp 1 (3)
K t
C K K K K C 0 1 1 0 1 0 exp (4)
Fx dt K
Fx d / or FxF0exp
K1t
(5)
K t
F Ft 0exp 1 (t 0 min) (6) t K F Ft1 t 2 1 or K t F F F F t t 2 0 0 (7)
( )
0 ) ( exp aT t bT t F F (8) ) /( 0 t A B t F Ft (9) SSE = 2 1 ,exp , ) ( 1
n i i ipre X X N (10) RMSE = 2 / 1 1 2 , exp , ) ( 1
N i i ipre X X N (11) χ2 = Z N X X N i i ipre
1 2 , exp , ) ( (12)
E RT
A A 0exp a (13) (4) Where; C and C0 are the concentrations of colour parameters at any time t and initial concentration respectively; K0 is the zero-order kinetics constant and K1 is the first-order kinetics constant (min-1) in Equations 2–4. Correlation coefficients (R2) of each model in accordance with the initial values of estimated parameters were used as the basis to select the model which best described the experimental data.2.5.2. Kinetic of texture changes
To describe the textural changes during the rehydration process of dried figs, kinetic models including first order kinetics, second-order kinetics, Weibull and Peleg models were employed. Non-linear regression analysis was performed with the following equations.
An approach frequently applied in food softening studies has been to express the change of a texture parameter Fx with time t by a first order relation with apparent rate constant k (Equation 5) (Verlinden 1996).
2
12 0 2 0 2 0 * L L a a b b E (1) t K C C 0 0 (2)
K t
C C 0exp 1 (3)
K t
C K K K K C 0 1 1 0 1 0 exp (4)
Fx dt K
Fx d / or FxF0exp
K1t
(5)
K t
F Ft 0exp 1 (t 0 min) (6) t K F Ft1 t 2 1 or K t F F F F t t 2 0 0 (7)
( )
0 ) ( exp aT t bT t F F (8) ) /( 0 t A B t F Ft (9) SSE = 2 1( ,exp , ) 1
n i i ipre X X N (10) RMSE = 2 / 1 1 2 , exp , ) ( 1
N i Xi Xipre N (11) χ2 = Z N X X N i i ipre
1 2 , exp , ) ( (12)
E RT
A A 0exp a (13) (5)Texture parameter Fx represents the output of a texture measurement method such as penetrometer force, rupture stress in a tensile test, compression force in this current study and so on. Other researchers (Tijskens & Schijvens 1987) have added another term, ‘‘constant δ’’ (residual texture) to the model, which accounts for the final remaining texture at the end of processing. The modified-first order kinetic model is introduced as follows (Equation 6):
2
12 0 2 0 2 0 * L L a a b b E (1) t K C C 0 0 (2)
K t
C C 0exp 1 (3)
K t
C K K K K C 0 1 1 0 1 0 exp (4)
Fx dt K
Fx d / or FxF0exp
K1t
(5)
K t
F Ft 0exp 1 (t 0 min) (6) t K F Ft1 t 2 1 or K t F F F F t t 2 0 0 (7)
( )
0 ) ( exp aT t bT t F F (8) ) /( 0 t A B t F Ft (9) SSE = 2 1( ,exp , ) 1
n i i ipre X X N (10) RMSE = 2 / 1 1 2 , exp , ) ( 1
N i Xi Xipre N (11) χ2 = Z N X X N i i ipre
1 2 , exp , ) ( (12)
E RT
A A 0exp a (13) (6) Where; F0 and K1 represents the initial textural value of raw material and the texture softening rate constant, respectively (Farahnaky et al 2012). A second-order kinetic equation was also employed to model texture development of samples during rehydration process as follows (Equation 7) (Moreira et al 2008):
2
12 0 2 0 2 0 * L L a a b b E (1) t K C C 0 0 (2)
K t
C C 0exp 1 (3)
K t
C K K K K C 0 1 1 0 1 0 exp (4)
Fx dt K
Fx d / or FxF0exp
K1t
(5)
K t
F Ft 0exp 1 (t 0 min) (6) t K F Ft1 t 2 1 or K t F F F F t t 2 0 0 (7)
( )
0 ) ( exp aT t bT t F F (8) ) /( 0 t A B t F Ft (9) SSE = 2 1 ,exp , ) ( 1
n i i ipre X X N (10) RMSE = 2 / 1 1 2 , exp , ) ( 1
N i i ipre X X N (11) χ2 = Z N X X N i i ipre
1 2 , exp , ) ( (12)
E RT
A A 0exp a (13) (7)Where; Ft represents the textural value of raw material at time t; and K2 is the corresponding rate constant of the model (min-1) obtained as a measure of the fitness of the experimental data at each initial moisture content of samples. Weibull model was used as the primary model to describe the effect of heating time on degradation of firmness, as:
2
12 0 2 0 2 0 * L L a a b b E (1) t K C C 0 0 (2)
K t
C C 0exp 1 (3)
K t
C K K K K C 0 1 1 0 1 0 exp (4)
Fx dt K
Fx d / or FxF0exp
K1t
(5)
K t
F Ft 0exp 1 (t 0 min) (6) t K F Ft1 t 2 1 or K t F F F F t t 2 0 0 (7)
( )
0 ) ( exp aT t bT t F F (8) ) /( 0 t A B t F Ft (9) SSE = 2 1( ,exp , ) 1
n i i ipre X X N (10) RMSE = 2 / 1 1 2 , exp , ) ( 1
N i Xi Xipre N (11) χ2 = Z N X X N i i ipre
1 2 , exp , ) ( (12)
E RT
A A 0exp a (13) (8) Where; b(T) and a(T) are temperature dependent coefficients. This model is the cumulative form of Weibull distribution function, with the a(T) representing the ‘shape factor’ and the reciprocal of b(T) its ‘location factor’ (Corradini & Peleg 2006). When n<1, the isothermal of the semi-logarithmic curve has upper concavity and when n>1, the curve shows a downward concavity. The log-linear or first order kinetics was in fact the case when n=1, therefore the Weibull model offers a great of flexibility for biological systems (Yu et al 2011). Peleg model can also be used to describe textural changes by a two parameter non-linear model (Peleg 1988; Sacchetti et al 2003):Rehidrasyona Tabi Tutulan Kuru İncirde Renk ve Doku Değişim Kinetiği, Ansari et al
112
Ta r ı m B i l i m l e r i D e r g i s i – J o u r n a l o f A g r i c u l t u r a l S c i e n c e s 21 (2015) 108-122
2
12 0 2 0 2 0 * L L a a b b E (1) t K C C 0 0 (2)
K t
C C 0exp 1 (3)
K t
C K K K K C 0 1 1 0 1 0 exp (4)
Fx dt K
Fx d / or FxF0exp
K1t
(5)
K t
F Ft 0exp 1 (t 0 min) (6) t K F Ft1 t 2 1 or K t F F F F t t 2 0 0 (7)
( )
0 ) ( exp aT t bT t F F (8) ) /( 0 t A B t F Ft (9) SSE = 2 1( ,exp , ) 1
n i i ipre X X N (10) RMSE = 2 / 1 1 2 , exp , ) ( 1
N i Xi Xipre N (11) χ2 = Z N X X N i i ipre
1 2 , exp , ) ( (12)
E RT
A A 0exp a (13) (9) with the minus (–) sign corresponding to loss phenomena kinetics and the plus (+) sign corresponding to gain phenomena kinetics.The goodness of fit of the tested mathematical models to the experimental data was evaluated from the coefficient of determination (R2), sum square error (SSE; Equation 10), root mean square error (RMSE; Equation 11) and the chi-square (χ2; Equation 12) between the predicted and experimental values.
2
12 0 2 0 2 0 * L L a a b b E (1) t K C C 0 0 (2)
K t
C C 0exp 1 (3)
K t
C K K K K C 0 1 1 0 1 0 exp (4)
Fx dt K
Fx d / or FxF0exp
K1t
(5)
K t
F Ft 0exp 1 (t 0 min) (6) t K F Ft1 t 2 1 or K t F F F F t t 2 0 0 (7)
( )
0 ) ( exp aT t bT t F F (8) ) /( 0 t A B t F Ft (9) SSE = 2 1( ,exp , ) 1
n i i ipre X X N (10) RMSE = 2 / 1 1 2 , exp , ) ( 1
N i Xi Xipre N (11) χ2 = Z N X X N i i ipre
1 2 , exp , ) ( (12)
E RT
A A 0exp a (13) (10)
2
12 0 2 0 2 0 * L L a a b b E (1) t K C C 0 0 (2)
K t
C C 0exp 1 (3)
K t
C K K K K C 0 1 1 0 1 0 exp (4)
Fx dt K
Fx d / or FxF0exp
K1t
(5)
K t
F Ft 0exp 1 (t 0 min) (6) t K F Ft1 t 2 1 or K t F F F F t t 2 0 0 (7)
( )
0 ) ( exp aT t bT t F F (8) ) /( 0 t A B t F Ft (9) SSE = 2 1( ,exp , ) 1
n i i ipre X X N (10) RMSE = 2 / 1 1 2 , exp , ) ( 1
N i Xi Xipre N (11) χ2 = Z N X X N i i ipre
1 2 , exp , ) ( (12)
E RT
A A 0exp a (13) (11)
2
12 0 2 0 2 0 * L L a a b b E (1) t K C C 0 0 (2)
K t
C C 0exp 1 (3)
K t
C K K K K C 0 1 1 0 1 0 exp (4)
Fx dt K
Fx d / or FxF0exp
K1t
(5)
K t
F Ft 0exp 1 (t 0 min) (6) t K F Ft1 t 2 1 or K t F F F F t t 2 0 0 (7)
( )
0 ) ( exp aT t bT t F F (8) ) /( 0 t A B t F Ft (9) SSE = 2 1 ,exp , ) ( 1
n i i ipre X X N (10) RMSE = 2 / 1 1 2 , exp , ) ( 1
N i i ipre X X N (11) χ2 = Z N X X N i i ipre
1 2 , exp , ) ( (12)
E RT
A A 0exp a (13) (12)Where; Xi,exp is the experimental moisture content; Xi,pre is the predicted moisture content; N is the number of observations and z is the number of constants (Doymaz 2013).
In order to prove the temperature dependence of rate constants, the Arrhenius equation was applied as follows:
2
12 0 2 0 2 0 * L L a a b b E (1) t K C C 0 0 (2)
K t
C C 0exp 1 (3)
K t
C K K K K C 0 1 1 0 1 0 exp (4)
Fx dt K
Fx d / or FxF0exp
K1t
(5)
K t
F Ft 0exp 1 (t 0 min) (6) t K F Ft1 t 2 1 or K t F F F F t t 2 0 0 (7)
( )
0 ) ( exp aT t bT t F F (8) ) /( 0 t A B t F Ft (9) SSE = 2 1 ,exp , ) ( 1
n i i ipre X X N (10) RMSE = 2 / 1 1 2 , exp , ) ( 1
N i i ipre X X N (11) χ2 = Z N X X N i i ipre
1 2 , exp , ) ( (12)
E RT
A A 0exp a (13) (13)Where; A corresponds to the kinetic parameters of each model (Machado et al 1999; Sanjuan et al 2001; Turhan et al 2002); Ea refers to the activation energy (kJ mol-1); T is the absolute temperature (K) and R is the universal gas constant (8.314 ´ 10-3 kJ K-1 mol-1).
2.6. Statistical analysis
Analysis of variance (One-way ANOVA) of model parameters for colour and texture of samples rehydrated at different temperatures was performed to determine the presence of significant differences between the means; Duncan multiple range tests was used to compare among the means using IBM SPSS Statistics software, version 19.
3. Results and Discussion
3.1. Rehydration curves
Rehydration kinetic of food products can be described using changes in moisture content (calculated as grams of water/grams of solids) versus time of rehydration (Markowski & Zielinska 2011). Figure 1 shows moisture content as a function of time for the five rehydration temperatures. All rehydration curves demonstrate an exponential trend with high water absorption rates mainly at the beginning of the process. However, as rehydration time progressed, the driving force for water transfer decreased and the system slowly attained equilibrium. Increasing the rehydration temperature from 25 to 90 °C increased both the rehydration rate and amount of water absorbed (Ansari et al 2015). This behavior has been also reported by other authors for different rehydrated products such as apples, potatoes, carrots, bananas, peppers, garlic, mushrooms, onions, leeks, peas, corn, pumpkin, tomato, amaranth grains and chestnut (Krokida & Marinos-Kouris 2003; Resio et al 2006; Moreira et al 2008).
Figure 1- Rehydration rate curve for dried figs at different temperatures (25-90 °C). {Bars are ± standard deviation}
Şekil 1- Farklı sıcaklıklarda (25-90 °C) kuru incir için rehidrasyon oranı eğrisi {barlar ± standart sapmadır}
Kinetic of Color and Texture Changes in Rehydrated Figs, Ansari et al
113
Ta r ı m B i l i m l e r i D e r g i s i – J o u r n a l o f A g r i c u l t u r a l S c i e n c e s 21 (2015) 108-1223.2. Colour analysis during rehydration
Colour is one of the most important appearance attributes of food material, as it influences consumer acceptability. The change of product colour as a result of various reactions such as non-enzymatic browning and pigment destruction may cause the product to be rejected by consumers (Maskan 2001; Wong & Stanton 1993). Values of colour parameters for dried figs were: L*=66.42, a*=5.72 and b*=40.49. The results of colour parameters (L*, a*, b* and DE*) after rehydration at different temperatures (25-90 °C) are presented in Figures 2a and 2d.
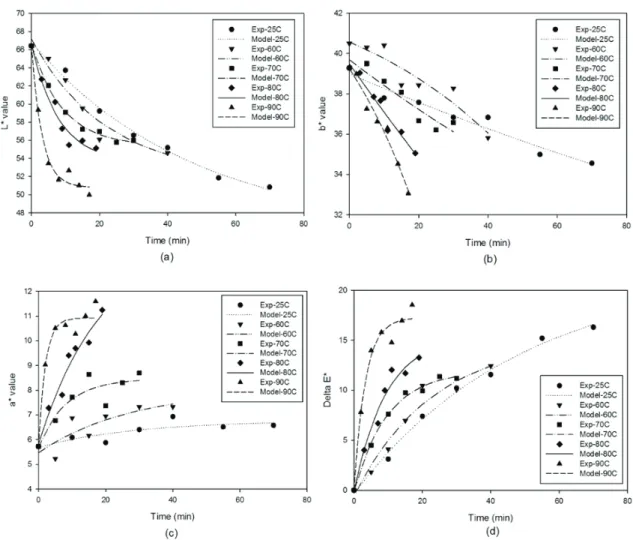
As can be seen in Figure 2a, lightness (L*) decreased with rehydration time for all considered temperatures. The fall of this parameter in dried samples can be taken as a measurement of browning (Ibarz et al 1999; Avila & Silva 1999). Moreover, as can be noted in Figure 2a, a decrease in lightness (L*) is strongly dependent on temperature of rehydration. Yellowness (a*) and Redness (b*) showed an opposite trend with rehydration time (Figures 2b and 2c). During rehydration a* values of dried figs increased, while b* values decreased. Similar to L* values, the extent of change in a* and b* values are higher in the samples rehydrated at higher temperatures. The observed behavior for a* and b* values, as a function of rehydration time, indicates an overall colour change from yellow towards reddish-brownish hues as previously stated by Comba et al (2010). Similar results for the decrease in L*/b* values and an increase in a* were reported by many authors in the drying of kiwi fruits (Maskan 2001), concentration of fig juice (Maftoonazad et al 2012), rehydration of chestnuts (Moreira et al 2008), thermal treatment of peach jam (Comba et al 2010), etc. Figure 2-d shows DE* changes calculated by use of Equation 1 , which indicated the magnitude of overall colour difference between dried and rehydrated figs. DE* values increased with rehydration time at all temperatures with the least colour change observed at lower temperatures (25 °C). Comparing these results with those reported by Moreira et al (2008) for rehydration of chestnuts confirmed a high dependency of DE* with temperature.
In the present study, variation of colour parameters (L*, a*, b* and DE*) with rehydration time and temperature were fitted to a zero-, first-order and combined kinetic models (Equations 2-4) using non-linear regression. The kinetic parameters, correlation coefficient (R2), and initial values of parameters (C0) estimated are shown in Table 1-3. Regression analysis revealed that the composite model better described the experimental data of parameters L*, a*, b* and DE* compared with zero- and first-order models due to the high R2 and reasonable C
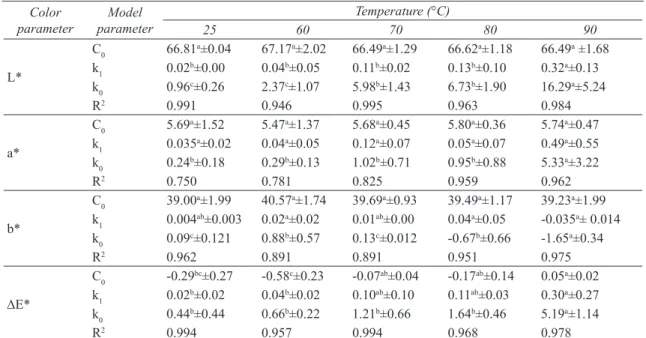
0 values obtained. However for L*, a* and b* values, both zero- and first-order reaction kinetic models can also be used adequately after combined kinetic model with R2 values of 0.751-0.961 (for L* values), 0.876-0.965 (for b* values) and 0.572-0.905 (for a* values) for the first-order model; But as the R2 values of these two models were not significantly different, determination of the better one after combined kinetic model is impossible. For DE*, zero order kinetic model demonstrated higher R2 compared to first order. However, the following authors stated that the first-order kinetic model was better for b* and L* values of concentrated tomato paste (Barreiro et al 1997), peach puree (Avila & Silva 1999; Garza et al 1999) and pear puree (Ibarz et al 1999), while Maskan (2001) reported that zero-order kinetic model fitted well with the data of a* values. This explains why authors such as Comba et al (2010), Maftoonazad et al (2012) and Garza et al (1999) used different models as combined models to describe a series of colour parameters. Moreover, as can be seen in Tables 1 and 2, in all cases (DE*, L*, a* and b*) the zero-order model kinetic constant values (K0) were higher than those of first-order model (K1). Comparing both constants of combined model (Table 3), it can be observed that K0 value is notably higher than K1 for parameters L*, b* and a* values. This implies that among the two stages supposed by this model, the rate of colour formation is higher than the colour destruction for all rehydration temperatures. These results are in agreement with the reports of other authors who examined the non-enzymatic browning of peach puree during heating (Garza et
Rehidrasyona Tabi Tutulan Kuru İncirde Renk ve Doku Değişim Kinetiği, Ansari et al
114
Ta r ı m B i l i m l e r i D e r g i s i – J o u r n a l o f A g r i c u l t u r a l S c i e n c e s 21 (2015) 108-122al 1999), colour changes of kiwifruits during drying (Maskan 2001), and fig juice during concentration (Maftoonazad et al 2012). The evident increase of all kinetic constants (K0 in zero-order, K1 in first-order and K0/K1 in combined kinetic model) with rehydration temperature confirmed that browning is favoured by the increase in treatment temperature, which is in accordance with Garza et al (1999).
To affirm the effect of temperature on colour changes, the constants obtained from the best fitted model (combined kinetic) were fitted to Arrhenius type equation (Table 4). An activation energy for total colour difference (DE*) was 13.6 kJ mol-1 for the zero-order and 21.32 kJ mol-1 for the first-order stage. This value was lower than the ones obtained by Lozano & Ibraz (1997) and Garza et al (1999)
Figure 2- Color kinetic of rehydrated dried figs at different temperatures (The symbols are experimental data and solid lines correspond to predicted values by Equation 4 combined kinetic): a, L* value; b, b* value; c, a* value; d, DE* value
Şekil 2 - Farklı sıcaklıklarda yeniden kurutulmuş incirin renk kinetiği (semboller deneysel veriler ve kalın çizgiler ise Eşitlik 4 tahmin denklemi değerlerine karşılık gelen kombine kinetiği ifade etmektedir): a, L * değeri; b, b * değeri; c, a * değeri; d, DE * değeri
Kinetic of Color and Texture Changes in Rehydrated Figs, Ansari et al
115
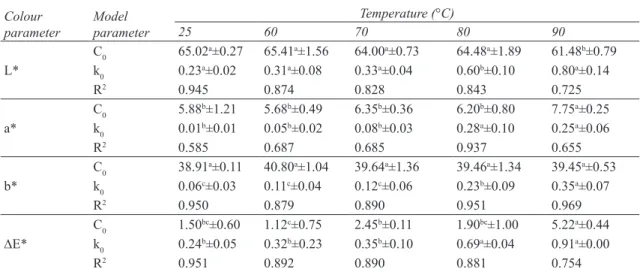
Ta r ı m B i l i m l e r i D e r g i s i – J o u r n a l o f A g r i c u l t u r a l S c i e n c e s 21 (2015) 108-122Table 1- Kinetics parameters of zero-order model (Equation12) for L*, a*, b* and DE* values at different rehydration temperatures∆
Çizelge 1- Sıfır sıralı modelinde (Eşitlik 12) kinetiği parametrelerin farklı rehidrasyon sıcaklıklarda L *, a *, b * ve ∆E * değerleri∆ Temperature (°C) Model parameter Colour parameter 25 60 70 80 90 61.48b±0.79 64.48a±1.89 64.00a±0.73 65.41a±1.56 65.02a±0.27 C0 L* k 0.23a±0.02 0.31a±0.08 0.33a±0.04 0.60b±0.10 0.80a±0.14 0 0.725 0.843 0.828 0.874 0.945 R2 7.75a±0.25 6.20b±0.80 6.35b±0.36 5.68b±0.49 5.88b±1.21 C0 a* k 0.01b±0.01 0.05b±0.02 0.08b±0.03 0.28a±0.10 0.25a±0.06 0 0.655 0.937 0.685 0.687 0.585 R2 39.45a±0.53 39.46a±1.34 39.64a±1.36 40.80a±1.04 38.91a±0.11 C0 b* k 0.06c±0.03 0.11c±0.04 0.12c±0.06 0.23b±0.09 0.35a±0.07 0 0.969 0.951 0.890 0.879 0.950 R2 5.22a±0.44 1.90bc±1.00 2.45b±0.11 1.12c±0.75 1.50bc±0.60 C0 DE* k 0.24b±0.05 0.32b±0.23 0.35b±0.10 0.69a±0.04 0.91a±0.00 0 0.754 0.881 0.890 0.892 0.951 R2
∆, data are reported as the mean (± SD) of three replicates. Means of model parameters in the same row with different letters are significantly different (a < 0.05) as estimated with Duncan’s test. {**: highly significant at a<0.01; *: significant at a<0.05; ns: not significant as estimated with ANOVA test}
Table 2- Kinetics parameters of first-order model (Equation 13) for L*, a*, b* and DE* values at different rehydration temperatures∆
Çizelge 2- Birinci sıralı modelde (Eşitlik 13) kinetiği parametrelerin farklı rehidrasyon sıcaklıklarda L *, a *, b * ve ∆E * değerleri∆ Temperature (°C) Model parameter Color parameter 25 60 70 80 90 61.94c±0.04 64.77ab±0.96 64.22b±0.89 65.68a±0.75 65.46ab±0.19 C0 L* k 0.004c±0.000 0.005c±0.000 0.006c±0.00 0.010b±0.000 0.010a±0.000 1 0.751 0.863 0.846 0.889 0.961 R2 7.46a±0.50 6.51ab±1.24 6.45ab±0.57 5.74b±0.32 5.89b±0.98 C0 a* k 0.002b±0.000 0.007b±0.000 0.010b±0.000 0.030a±0.010 0.030a±0.000 1 0.617 0.905 0.661 0.671 0.572 R2 39.50ab±0.51 39.50ab±0.96 39.66ab±1.03 40.83a±0.83 38.95b±0.05 C0 b* k 0.002c±0.001 0.003c±0.001 0.003c±0.001 0.006b±0.002 0.010a±0.002 1 0.965 0.951 0.891 0.876 0.951 R2 7.29a±1.09 4.18ab±0.93 4.15ab±0.76 3.20b±1.87 4.24ab±3.21 C0 DE* k 0.02c±0.01 0.04bc±0.01 0.04bc±0.03 0.07a±0.01 0.06ab±0.00 1 0.650 0.743 0.716 0.760 0.829 R2
∆, data are reported as the mean (± SD) of three replicates. Means of model parameters in the same row with different letters are significantly different (a < 0.05) as estimated with Duncan’s test. {**: highly significant at a<0.01; *: significant at a<0.05; ns: not significant as estimated with ANOVA test}
Rehidrasyona Tabi Tutulan Kuru İncirde Renk ve Doku Değişim Kinetiği, Ansari et al
116
Ta r ı m B i l i m l e r i D e r g i s i – J o u r n a l o f A g r i c u l t u r a l S c i e n c e s 21 (2015) 108-122 Table 3- Kinetics parameters of combined kinetic model (Equation 14) for L*, a*, b* and DE* values∆ Çizelge 3- L *, a *, b * ve DE * değerleri için kombine kinetik model (Eşitlik 14) parametreleri∆Temperature (°C) Model parameter Color parameter 25 60 70 80 90 66.49a ±1.68 66.62a±1.18 66.49a±1.29 67.17a±2.02 66.81a±0.04 C0 L* k1 0.02b±0.00 0.04b±0.05 0.11b±0.02 0.13b±0.10 0.32a±0.13 16.29a±5.24 6.73b±1.90 5.98b±1.43 2.37c±1.07 0.96c±0.26 k0 0.984 0.963 0.995 0.946 0.991 R2 5.74a±0.47 5.80a±0.36 5.68a±0.45 5.47a±1.37 5.69a±1.52 C0 a* k1 0.035a±0.02 0.04a±0.05 0.12a±0.07 0.05a±0.07 0.49a±0.55 5.33a±3.22 0.95b±0.88 1.02b±0.71 0.29b±0.13 0.24b±0.18 k0 0.962 0.959 0.825 0.781 0.750 R2 39.23a±1.99 39.49a±1.17 39.69a±0.93 40.57a±1.74 39.00a±1.99 C0 b* k1 0.004ab±0.003 0.02a±0.02 0.01ab±0.00 0.04a±0.05 -0.035a± 0.014 -1.65a±0.34 -0.67b±0.66 0.13c±0.012 0.88b±0.57 0.09c±0.121 k0 0.975 0.951 0.891 0.891 0.962 R2 0.05a±0.02 -0.17ab±0.14 -0.07ab±0.04 -0.58c±0.23 -0.29bc±0.27 C0 DE* k1 0.02b±0.02 0.04b±0.02 0.10ab±0.10 0.11ab±0.03 0.30a±0.27 5.19a±1.14 1.64b±0.46 1.21b±0.66 0.66b±0.22 0.44b±0.44 k0 0.978 0.968 0.994 0.957 0.994 R2
∆, data are reported as the mean (± SD) of three replicates. Means of model parameters in the same row with different letters are significantly different (a < 0.05) as estimated with Duncan’s test. {**: highly significant at a<0.01; *: significant at a<0.05; ns: not significant as estimated with ANOVA test}
Table 4- Arrhenius equation parameters for different studied parameters in rehydrated dried figs
Çizelge 4- Rehidrate incirde incelenen farklı parametreler için Arrhenius denklemi parametreleri
R2 Ea(kJ mol-1) Kinetic model Kinetic constant Parameter 0.910 21.776 Comb.1st stage(n=0) K0 L*
Colour kinetic K1 Comb.2nd stage(n=1) 23.553 0.884
0.744 13.601 Comb.1st stage(n=0) K0 DE* 0.869 21.321 Comb.2nd stage(n=1) K1 0.706 18.650 First-order k1 Hardness Texture kinetic 0.880 24.902 Second-order k2 0.895 22.474 Weibul b(except 25°C) 0.898 55.066 Peleg A(except 25°C) 0.627 16.484 First-order k1 Gradient k2 Second-order 20.219 0.848 0.683 25.496 Weibul b(except 25°C) 0.841 53.110 Peleg A(except 25°C) 0.804 24.422 First-order k1 Compression
energy kb(except 25°C)2 Second-orderWeibul 27.21919.346 0.8480.869
0.861 183.207
Peleg A(except 25°C)
Kinetic of Color and Texture Changes in Rehydrated Figs, Ansari et al
117
Ta r ı m B i l i m l e r i D e r g i s i – J o u r n a l o f A g r i c u l t u r a l S c i e n c e s 21 (2015) 108-122for fruit concentrate pulp and peach puree pulp. The activation energies found for L* value were 21.78 and 23.56 kJ mol-1 for the zero- and first-order stages. Thus, it can be concluded that browning in dried figs increased with rehydration temperature, which is in agreement with the results of Moreira et al (2008) in rehydrating chestnut.
3.3. Texture analysis during rehydration
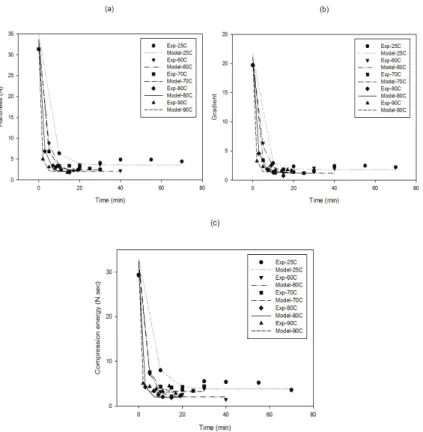
In order to study the textural changes during rehydration of samples; the hardness, gradient and compression energy changes of dried figs as a function of moisture content at different temperatures are presented in Figure 3. As expected the hardness of samples decreased as the moisture
content increased. In the beginning a dramatic decrease in texture hardness was observed followed by a progressive decrease. The hardness of dried figs decreased from 31N to the constant amount of 2-4N after rehydration. This behavior may be related to the transition of the glassy dried fig (tough to deform) into rubbery rehydrated fig (easy to deform). The compression energy and gradient of all samples, similar to hardness, were reduced as a function of moisture content. Compression energy, which is an indicator of the energy required to compress the samples to 20% of their original height (in this study) was about 29.3 N sec-1 in dried figs compared to approximately 2-4 N sec-1 in rehydrated ones (Table 5). This implies that rehydrated figs would
Figure 3- Texture kinetic of rehydrated dried figs at different temperatures (the symbols are experimental data and solid lines correspond to predicted values by Equation 6 first-order kinetic model): a, hardness; b, gradient; c, compression energy
Şekil 3- Farklı sıcaklıklarda rehidre kuru incir doku kinetiği (semboller deneysel verileri ve sürekli çizgiler Eşitlik 6 birinci dereceden kinetik model tahmin değerlerine karşılık gelmektedir): a, sertlik; b, gradyan; c,sıkıştırma enerjisi
Rehidrasyona Tabi Tutulan Kuru İncirde Renk ve Doku Değişim Kinetiği, Ansari et al
118
Ta r ı m B i l i m l e r i D e r g i s i – J o u r n a l o f A g r i c u l t u r a l S c i e n c e s 21 (2015) 108-122require less energy than dried figs, and that dried figs are softened during the rehydration process. Similar behavior has been reported by other authors on the soaking process of cereal grains in water (Sopade et al 1992) and breakfast cereals in semi-skimmed milk (Sacchetti et al 2003).
To describe the firmness of dried figs during the rehydration process, four models including first order kinetic, second-order kinetic, Weibull and Peleg models were employed at different temperatures (25-90 °C). Table 6 shows the kinetic constants of these four models for textural parameters including
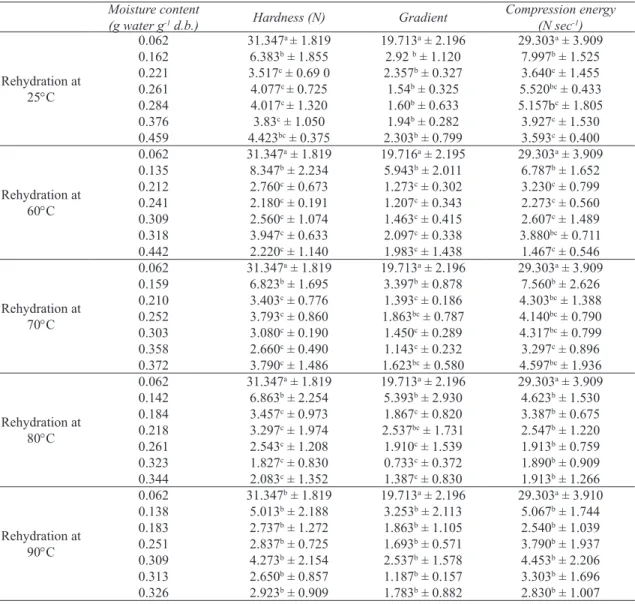
Table 5- Kinetics of texture development of dried figs rehydrated at different temperatures∆ Çizelge 5- Farklı sıcaklıklarda rehidre kuru incir doku gelişimi kinetiği∆
Moisture content
(g water g-1 d.b.) Hardness (N) Gradient Compression energy (N sec-1)
Rehydration at 25°C 0.062 31.347a ± 1.819 19.713a ± 2.196 29.303a ± 3.909 0.162 6.383b ± 1.855 2.92 b ± 1.120 7.997b ± 1.525 0.221 3.517c ± 0.69 0 2.357b ± 0.327 3.640c ± 1.455 0.261 4.077c ± 0.725 1.54b ± 0.325 5.520bc ± 0.433 0.284 4.017c ± 1.320 1.60b ± 0.633 5.157bc ± 1.805 0.376 3.83c ± 1.050 1.94b ± 0.282 3.927c ± 1.530 0.459 4.423bc ± 0.375 2.303b ± 0.799 3.593c ± 0.400 Rehydration at 60°C 0.062 31.347a ± 1.819 19.716a ± 2.195 29.303a ± 3.909 0.135 8.347b ± 2.234 5.943b ± 2.011 6.787b ± 1.652 0.212 2.760c ± 0.673 1.273c ± 0.302 3.230c ± 0.799 0.241 2.180c ± 0.191 1.207c ± 0.343 2.273c ± 0.560 0.309 2.560c ± 1.074 1.463c ± 0.415 2.607c ± 1.489 0.318 3.947c ± 0.633 2.097c ± 0.338 3.880bc ± 0.711 0.442 2.220c ± 1.140 1.983c ± 1.438 1.467c ± 0.546 Rehydration at 70°C 0.062 31.347a ± 1.819 19.713a ± 2.196 29.303a ± 3.909 0.159 6.823b ± 1.695 3.397b ± 0.878 7.560b ± 2.626 0.210 3.403c ± 0.776 1.393c ± 0.186 4.303bc ± 1.388 0.252 3.793c ± 0.860 1.863bc ± 0.787 4.140bc ± 0.790 0.303 3.080c ± 0.190 1.450c ± 0.289 4.317bc ± 0.799 0.358 2.660c ± 0.490 1.143c ± 0.232 3.297c ± 0.896 0.372 3.790c ± 1.486 1.623bc ± 0.580 4.597bc ± 1.936 Rehydration at 80°C 0.062 31.347a ± 1.819 19.713a ± 2.196 29.303a ± 3.909 0.142 6.863b ± 2.254 5.393b ± 2.930 4.623b ± 1.530 0.184 3.457c ± 0.973 1.867c ± 0.820 3.387b ± 0.675 0.218 3.297c ± 1.974 2.537bc ± 1.731 2.547b ± 1.220 0.261 2.543c ± 1.208 1.910c ± 1.539 1.913b ± 0.759 0.323 1.827c ± 0.830 0.733c ± 0.372 1.890b ± 0.909 0.344 2.083c ± 1.352 1.387c ± 0.830 1.913b ± 1.266 Rehydration at 90°C 0.062 31.347b ± 1.819 19.713a ± 2.196 29.303a ± 3.910 0.138 5.013b ± 2.188 3.253b ± 2.113 5.067b ± 1.744 0.183 2.737b ± 1.272 1.863b ± 1.105 2.540b ± 1.039 0.251 2.837b ± 0.725 1.693b ± 0.571 3.790b ± 1.937 0.309 4.273b ± 2.154 2.537b ± 1.578 4.453b ± 2.206 0.313 2.650b ± 0.857 1.187b ± 0.157 3.303b ± 1.696 0.326 2.923b ± 0.909 1.783b ± 0.882 2.830b ± 1.007
∆,data are reported as the mean (± SD) of three replicates. Means of model parameters in the same column with different letters are significantly different (a < 0.05) as estimated with Duncan’s test. {**: highly significant at a<0.01; *: significant at a<0.05; ns: not significant as estimated with ANOVA test}
Kinetic of Color and Texture Changes in Rehydrated Figs, Ansari et al
119
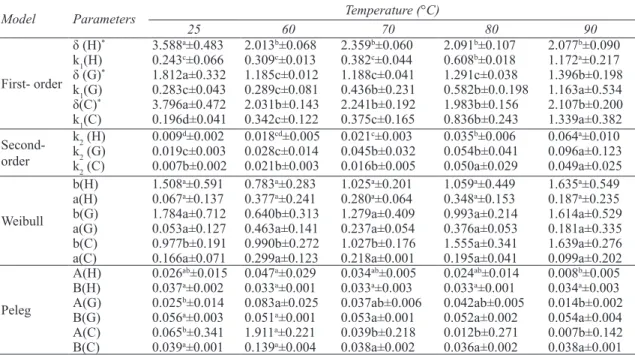
Ta r ı m B i l i m l e r i D e r g i s i – J o u r n a l o f A g r i c u l t u r a l S c i e n c e s 21 (2015) 108-122hardness, gradient and compression energy. As seen in first order and second order kinetic models the rate constants (K1 and K2) of hardness, gradient and compression energy tend to increase significantly with temperature implying the improvement of texture softening by temperature rehydration. These results were similar to Moreira et al (2008) who reported that during rehydration of chestnut the rate constants of modules derived decreased with initial increases in moisture content and increased with temperature. Another parameter obtained from first order kinetic is δ parameter (residual texture) shown in Table 6. The residual hardness (δ) of rehydrated dried figs at 25 °C was 3.588 (N) decreasing to 2.013, 2.359, 2.091 and 2.077 (N) after rehydrating at 60, 70, 80 and 90 °C, respectively. Although the residual hardness of rehydrated samples at temperatures higher than 60 °C was not significantly different. K1 and δ parameters
calculated from gradient and compression energy values of sample rehydrated at different temperatures, presented in Table 6, reveal similar trends as compared to K1 and δ values obtained from the hardness change. Regarding the effect of heat treatment on residual hardness, Farahnaky et al (2012) reported that after ohmic heating of carrots, red beets and golden carrots, the residual hardness (δ) reached from 270, 280 and 240 N to 0.14, 5.74 and 7.4 N respectively. Moreover, the initial rate (1/A) of hardness change calculated from Peleg model in samples rehydrated at lower temperatures (except for 25 °C) was lower than those soaked at higher temperatures (Table 6). Sacchetti et al (2003) also acquired similar results for breakfast cereals rehydrated in semi-skimmed milk. This could be due to a softening effect induced by moisture uptake phenomenon. In Weibull model, the a parameter which is known to be the “shape factor”
Table 6- Kinetic parameters of texture of rehydrated dried figs estimated from different models in accordance with statistical parameters∆
Çizelge 6- İstatistiksel parametrelere uygun farklı modellerden tahmin edilen rehidre kuru incir dokusu kinetik parametreleri∆ Temperature (°C) Parameters Model 90 80 70 60 25 2.077b±0.090 2.091b±0.107 2.359b±0.060 2.013b±0.068 3.588a±0.483 δ (H)* First- order 1.172a±0.217 0.608b±0.018 0.382c±0.044 0.309c±0.013 0.243c±0.066 k1(H) 1.396b±0.198 1.291c±0.038 1.188c±0.041 1.185c±0.012 1.812a±0.332 δ (G)* 1.163a±0.534 0.582b±0.0.198 0.436b±0.231 0.289c±0.081 0.283c±0.043 k1(G) 2.107b±0.200 1.983b±0.156 2.241b±0.192 2.031b±0.143 3.796a±0.472 δ(C)* 1.339a±0.382 0.836b±0.243 0.375c±0.165 0.342c±0.122 0.196d±0.041 k1(C) 0.064a±0.010 0.035b±0.006 0.021c±0.003 0.018cd±0.005 0.009d±0.002 k2 (H) Second-order k2 (G) 0.019c±0.003 0.028c±0.014 0.045b±0.032 0.054b±0.041 0.096a±0.123 0.049a±0.025 0.050a±0.029 0.016b±0.005 0.021b±0.003 0.007b±0.002 k2 (C) 1.635a±0.549 1.059a±0.449 1.025a±0.201 0.783a±0.283 1.508a±0.591 b(H) Weibull 0.187a±0.235 0.348a±0.153 0.280a±0.064 0.377a±0.241 0.067a±0.137 a(H) 1.614a±0.529 0.993a±0.214 1.279a±0.409 0.640b±0.313 1.784a±0.712 b(G) 0.181a±0.335 0.376a±0.053 0.237a±0.054 0.463a±0.141 0.053a±0.127 a(G) 1.639a±0.276 1.555a±0.341 1.027b±0.176 0.990b±0.272 0.977b±0.191 b(C) 0.099a±0.202 0.195a±0.041 0.218a±0.001 0.299a±0.123 0.166a±0.071 a(C) 0.008b±0.005 0.024ab±0.014 0.034ab±0.005 0.047a±0.029 0.026ab±0.015 A(H) Peleg 0.034a±0.003 0.033a±0.001 0.033a±0.003 0.033a±0.001 0.037a±0.002 B(H) 0.014b±0.002 0.042ab±0.005 0.037ab±0.006 0.083a±0.025 0.025b±0.014 A(G) 0.054a±0.004 0.052a±0.002 0.053a±0.001 0.051a±0.001 0.056a±0.003 B(G) 0.007b±0.142 0.012b±0.271 0.039b±0.218 1.911a±0.221 0.065b±0.341 A(C) 0.038a±0.001 0.036a±0.002 0.038a±0.002 0.139a±0.004 0.039a±0.001 B(C)
∆,data are reported as the mean (± SD) of three replicates. Means of model parameters in the same row with different letters are significantly different (a < 0.05) as estimated with Duncan’s test. {**: highly significant at a<0.01; *: significant at a<0.05; ns: not significant as estimated with ANOVA test} *H, hardness; G, gradient; C, compression energy
Rehidrasyona Tabi Tutulan Kuru İncirde Renk ve Doku Değişim Kinetiği, Ansari et al
120
Ta r ı m B i l i m l e r i D e r g i s i – J o u r n a l o f A g r i c u l t u r a l S c i e n c e s 21 (2015) 108-122is lower than one, which confirmed a downward concavity of the curve at all temperatures (25-90 °C) while b parameter increased with temperature (except for 25 °C).
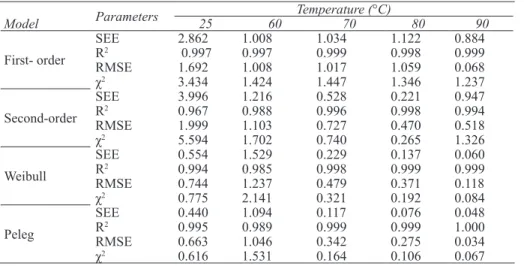
Table 7 shows the performance of four models in predicting the experimental data of hardness (R2, χ2, RMSE and SSE). The correlation coefficient (R2) of all four models varied from 0.966 to 0.999. Moreover, the experimental and predicted values for all models applied were significantly close (χ2 < critical value 5%) confirming the suitability of these models. The RMSE, expressed as percentage, was a maximum of 1.99% for second-order kinetic model. The SSE values of first order, second order, Weibull and Peleg models were 0.884-2.862, 0.221-3.996, 0.060-1.529 and 0.048-1.094, respectively. Therefore, all four models showed good performances for predicting texture values of dried figs after rehydration in the order of Peleg, first order, second-order and Weibull models. Moreover, regarding the temperature effect, only first order and second order kinetic models showed good fit over all temperature ranges studied
(25-90 °C), while the two other models could only be applied for the temperature range of 60-90 °C. Regarding the goodness of those four models for variation of gradient and compression energy similar results were obtained (data not shown).
Taking into account the influence of temperature on the rate constants estimated from first order and second order kinetic models, an Arrhenius equation (Equations 13) was employed at temperatures ranging from 25 to 90° C as presented in Table 4. Activation energies (Ea) for firmness reduction during rehydration process of dried figs were calculated to be 18.650 and 24.902 kJ mol-1, respectively. Since the K obtained from different regression models, the values of Ea calculated from these two models were inconsistent, which was in accordance with the results of Yu et al (2011) and Vu et al (2005) who reported a different Ea calculated from different models for firmness degradation of litchi and carrots during heat treatments. Similar values of activation energy for gradient and compression energy reduction has been obtained.
Table 7- Kinetic parameters of hardness of rehydrated dried figs estimated from different models in accordance with statistical parameters∆
Çizelge 7- İstatistiksel parametrelere uygun farklı modellerden tahmin edilen rehidre kuru incir sertliğinin kinetik parametreleri∆ Temperature (°C) Parameters 25 60 70 80 90 Model 0.884 1.122 1.034 1.008 2.862 SEE
First- order RRMSE2 0.9971.692 0.9971.008 0.9991.017 0.9981.059 0.9990.068
1.237 1.346 1.447 1.424 3.434 χ2 0.947 0.221 0.528 1.216 3.996 SEE Second-order RRMSE2 0.9671.999 0.9881.103 0.9960.727 0.9980.470 0.9940.518 1.326 0.265 0.740 1.702 5.594 χ2 0.060 0.137 0.229 1.529 0.554 SEE Weibull RRMSE2 0.9940.744 0.9851.237 0.9980.479 0.9990.371 0.9990.118 0.084 0.192 0.321 2.141 0.775 χ2 0.048 0.076 0.117 1.094 0.440 SEE Peleg RRMSE2 0.9950.663 0.9891.046 0.9990.342 0.9990.275 1.0000.034 0.067 0.106 0.164 1.531 0.616 χ2
∆, data are reported as the mean (± SD) of three replicates. Means of model parameters in the same row with different letters are significantly different (a < 0.05) as estimated with Duncan’s test. {**: highly significant at a<0.01 ; *: significant at a<0.05 ; ns: not significant as estimated with ANOVA test}