RESEARCH ARTICLE
Comprehensive tumor molecular profile
analysis in clinical practice
Mustafa Özdoğan
1, Eirini Papadopoulou
2*, Nikolaos Tsoulos
2, Aikaterini Tsantikidi
2, Vasiliki‑Metaxa Mariatou
2,
Georgios Tsaousis
2, Evgenia Kapeni
2, Evgenia Bourkoula
2, Dimitrios Fotiou
2, Georgios Kapetsis
2,
Ioannis Boukovinas
3, Nikolaos Touroutoglou
4, Athanasios Fassas
5, Achilleas Adamidis
5, Paraskevas Kosmidis
6,
Dimitrios Trafalis
7, Eleni Galani
8, George Lypas
9, Bülent Orhan
10, Sualp Tansan
11, Tahsin Özatlı
12, Onder Kırca
1,
Okan Çakır
13and George Nasioulas
2Abstract
Background: Tumor molecular profile analysis by Next Generation Sequencing technology is currently widely
applied in clinical practice and has enabled the detection of predictive biomarkers of response to targeted treatment. In parallel with targeted therapies, immunotherapies are also evolving, revolutionizing cancer therapy, with Pro‑ grammed Death‑ligand 1 (PD‑L1), Microsatellite instability (MSI), and Tumor Mutational Burden (TMB) analysis being the biomarkers employed most commonly.
Methods: In the present study, tumor molecular profile analysis was performed using a 161 gene NGS panel,
containing the majority of clinically significant genes for cancer treatment selection. A variety of tumor types have been analyzed, including aggressive and hard to treat cancers such as pancreatic cancer. Besides, the clinical utility of immunotherapy biomarkers (TMB, MSI, PD‑L1), was also studied.
Results: Molecular profile analysis was conducted in 610 cancer patients, while in 393 of them a at least one bio‑
marker for immunotherapy response was requested. An actionable alteration was detected in 77.87% of the patients. 54.75% of them received information related to on‑label or off‑label treatment (Tiers 1A.1, 1A.2, 2B, and 2C.1) and 21.31% received a variant that could be used for clinical trial inclusion. The addition to immunotherapy biomarker to targeted biomarkers’ analysis in 191 cases increased the number of patients with an on‑label treatment recommenda‑ tion by 22.92%, while an option for on‑label or off‑label treatment was provided in 71.35% of the cases.
Conclusions: Tumor molecular profile analysis using NGS is a first‑tier method for a variety of tumor types and
provides important information for decision making in the treatment of cancer patients. Importantly, simultaneous analysis for targeted therapy and immunotherapy biomarkers could lead to better tumor characterization and offer actionable information in the majority of patients. Furthermore, our data suggest that one in two patients may be eli‑ gible for on‑label ICI treatment based on biomarker analysis. However, appropriate interpretation of results from such analysis is essential for implementation in clinical practice and accurate refinement of treatment strategy.
Keywords: Molecular profile, Next Generation Sequencing, Targeted treatment, Immunotherapy, Tumor mutation
burden, PD‑L1, Microsatellite instability
© The Author(s) 2021. Open Access This article is licensed under a Creative Commons Attribution 4.0 International License, which permits use, sharing, adaptation, distribution and reproduction in any medium or format, as long as you give appropriate credit to the original author(s) and the source, provide a link to the Creative Commons licence, and indicate if changes were made. The images or other third party material in this article are included in the article’s Creative Commons licence, unless indicated otherwise in a credit line to the material. If material is not included in the article’s Creative Commons licence and your intended use is not permitted by statutory regulation or exceeds the permitted use, you will need to obtain permission directly from the copyright holder. To view a copy of this licence, visit http:// creat iveco mmons. org/ licen ses/ by/4. 0/. The Creative Commons Public Domain Dedication waiver (http:// creat iveco mmons. org/ publi cdoma in/ zero/1. 0/) applies to the data made available in this article, unless otherwise stated in a credit line to the data.
Background
In recent years, technological advances and active research have permitted extensive tumor molecular char-acterization and have revealed a variety of tumorigenic
Open Access
*Correspondence: [email protected]
2 Genekor Medical S.A, Athens, Greece
pathways presenting tumor-specific alterations. These distinctive molecular characteristics of cancer cells can be targeted as they represent the malignant cell’s Achille’s heel, without affecting the healthy ones. To this regard, of great importance was the previous knowledge gained by large scale studies that used various, advanced tech-nologies to obtain a comprehensive understanding of the tumor molecular profile [1].
Tumor molecular profile is nowadays becoming a reality mainly due to the increased availability, with concomitant reduction of cost of the Next Generation Sequencing technology (NGS) technology. The term per-sonalized medicine in anticancer treatment has emerged, indicating the need to treat each patient based on his/her tumor’s specific characteristics [2]. The individualization of treatment strategy entails the use of biomarkers that are those quantifiable characteristics that can be related to cancer prognosis and prediction of treatment response [2–4].
Currently, NGS analysis of more than 35 genes is mandatory for approved targeted treatment selection in
several neoplasias [4]. Furthermore, over 200 ongoing
clinical trials are investigating the clinical utility of novel biomarkers, leading to additional biomarker approval each year (www. clini caltr ials. org). Various studies have also shown the clinical benefit obtained using gene-directed treatment in comparison to unselected treat-ment assigntreat-ment for patients with metastatic tumors [5–7]. Thus, the abundance of treatments with approved gene targets available alongside the often low tissue avail-ability, entails the simultaneous analysis of biomarkers using multigene panels for various tumor types such as lung cancer, colorectal, gastrointestinal, ovarian, breast prostate cancer and others [3, 4, 8]. Besides, tumor agnostic therapies approvals, with biomarkers associated independently form tumor type, have also boosted the number of genes that should be analyzed when targeted treatment is considered [9]. It is thus apparent that in the era of personalized treatment, single or few gene analysis is no longer recommended, leading to missing treatment options for cancer patients.
Moreover, even in the absence of biomarkers associ-ated with on-label treatments, a broad molecular profile analysis could lead to the detection of an approved bio-marker for a different tumor type, giving the option of off-label treatment selection or enrolment in an ongoing clinical trial. To this regard, the contribution of active research for the identification of actionable alterations is enormous and has led to the discovery of new agents tar-geting genes previously known for their important role in oncogenesis but without predictive utility. A major para-digm of such gene is KRAS that has been considered for decades not targetable, while recent studies have shown
that certain frequently detected KRAS alterations, such as the G12C mutation, can be targeted efficiently lead-ing to an eventual upcomlead-ing FDA approval of new inves-tigational treatments showing efficiency at this regard [10–12].
The number of laboratories applying high throughput sequencing analysis is continuously increasing, in parallel with the increased request by the clinicians for such anal-ysis. The frequently insufficient amount of good quality tissue specimen, coupled with the increasing number of approved targeted agents, make the simultaneous analy-sis of multiple biomarkers using multigene panels imper-ative. Thus, advanced technology solves one of the most significant limitations of tissue testing. It is nevertheless noteworthy that, the optimal paraffin embedding proce-dure remains crucial for obtaining accurate NGS results [13, 14].
Currently, in parallel with targeted therapies, an increasing armamentarium of immunotherapy agents is also emerging, revolutionizing cancer therapy. The high cost and toxicity that often accompanies immunothera-peutic agents mandate the use of appropriate biomarkers for selecting patients more likely to benefit from them.
The most widely used biomarker is currently PD-L1 expression, assessed by Immunohistochemistry (IHC) [15]. However, it is well known that this is not an ideal biomarker since it is not related to treatment response in many tumor types, while it is clearly not the sole predic-tor of response to check point inhibition. Moreover, even for those tumors with a proven utility for PDL-1 IHC testing, such as lung cancer, several questions regarding methodology and cut offs remain [15, 16].
Additionally, microsatellite instability (MSI) has also been associated with response to anti-PD-L1 treatment with pembrolizumab receiving approval for MSI-H tumors [17–19]. Of note, MSI was the first tumor agnos-tic biomarker that had ever shown efficiency regardless of tumor type. However, the presence of MSI varies among tumor types with the rate of MSI-H tumors ranging from 10 to 15% for colon cancer to 0% in others such as lung cancer [20]. Thus, still, the majority of responders will not be identified by it. Hence, the enrichment of biomarkers for the identification of patients eligible for immunother-apy administration is required.
Several additional biomarkers of immune response have been proposed and are currently under investigation while it seems that their combined use could increase the predictive value of the information obtained [21, 22]. Among the most studied ones is the analysis of Tumor Mutational Burden (TMB) that measures the number of somatic mutations present in a tumor sample. It has been shown in several studies and clinical trials that the greater the number of somatic alterations identified the
greater the probability of response to immune treatment
[23–25]. It has been reported that TMB cutoff values
associated with improved survival from immunotherapy treatment vary significantly between cancer types [25]. Nevertheless, in the majority of studies and clinical trials, a cut off of 10 muts/MB is used [26–28]. Furthermore, the clinical utility of TMB as a predictive biomarker for anti-PD1 treatment administration has been shown in the KEYNOTE 158 study leading to the tumor agnostic approval by the USA FDA of pembrolizumab for meta-static untreatable solid tumors with tissue TMB value of ≥ 10 muts/MB [29].
The present study aimed to reveal the applicability and utility of tumor profile analysis in clinical practice, using a pan-cancer NGS panel for cancer treatment selection. The panel used in this study analyses 161 sin-gle genes using the Oncomine Technology (Thermo Fis-cher Scientific) and was selected based on the amount of actionable information contained, the robustness of the assay and its relatively low cost, which enables its use in clinical practice. A variety of tumor types have been analyzed, including aggressive and hard to treat cancers such as pancreatic cancer. Moreover, the clinical utility of immunotherapy biomarkers (TMB, MSI, PD-L1) was also explored.
Methods
Patients
In the present study, 629 cancer patients were referred by their treating oncologist for extensive molecular profile analysis from November 2017 to April 2020. All patients participating in the study provided written informed consent. Information concerning sex, age, and tumor histology was accessible, while the pathology report was available in all cases. In addition to molecular analysis for targeted treatment selection, analysis for at least one immunotherapy biomarker (PDL-1, MSI, TMB) was also requested in 395 patients. The analysis was performed using the most recent tissue specimen available.
Tissue selection and nucleic acid isolation
Genomic DNA and RNA were isolated from formalin-fixed and paraffin-embedded (FFPE) tumor biopsies
using the MagMAX™ Total Nucleic Acid Isolation Kit
(Thermo Fischer Scientific) according to the Manufac-turer’s instructions. The nucleic acid isolation was con-ducted in the areas of the FFPE block with the majority of tumor cell content (TCC), as indicated by experienced pathologists in Hematoxylin and eosin-stained sections. Minimum required TCC was over 20%, in a tumor area of > 4mm2.
Next Generation Sequencing
Whenever tumor molecular profile analysis for targeted therapies was requested, the Oncomine Comprehensive Assay v3 (OCAv3) (Thermo Fischer Scientific) was per-formed, which is an amplicon based targeted NGS assay. This assay allows the identification of various muta-tion types such as Single nucleotide Variants (SNVs), insertion-deletions (indels), Copy Number Variations (CNVs), and gene fusions, from 161 unique genes. Run
metrics were accessed in the Torrent Suite™ software,
using the coverage analysis plugin v5.0.4.0. NGS data
analysis was completed with the Ion Reporter™ 5.10.1.0
software (Thermo Fisher Scientific) using the manufac-turer’s provided workflow (Oncomine Comprehensive v3-w3.2-DNA and Fusions-Single Sample). Furthermore, the analysis software Sequence Pilot (version 4.3.0, JSI medical systems, Ettenheim, Germany) was used for vari-ant annotation. Sequencing data were aligned against the human reference assembly GRCh37/hg19.
Tumor Mutational Burden analysis was carried out using the Oncomine Tumor Mutation Load Assay (Thermo Fischer Scientific). This is a targeted NGS assay, with 1.65 MB of genomic coverage (1.2 MB exonic) that analyzes 409 genes to provide accurate quantitation of somatic mutations used for tumor mutation burden cal-culation, in FFPE tissues.
TMB was calculated using the Ion reporter pipeline that utilizes a custom variant calling and germline vari-ant filtering to accurately calculate the number of exonic somatic mutations per MB (Oncomine Tumor Mutation Load-w2.0-DNA-Single Sample).
Microsatellite analysis was conducted using the Ion
AmpliSeq™ Microsatellite Instability Panel (Thermo
Fis-cher Scientific) which is an NGS based assay analyzing 76 markers to assess Microsatellite Instability (MSI) status in tumor-only and tumor-normal samples as indicated by the manufacturer. Analysis of the sequencing out-put from this panel was carried out using the “MSICall” plugin in the Torrent Suite.
Variant classification
Variants were classified according to their predictive value using the four-tiered system jointly recommended by the Association for Molecular Pathology (AMP), the American College of Medical Genetics (ACMG), the American Society of Clinical Oncology (ASCO) and the College of American Pathologists (CAP) for the classifi-cation of somatic variants [30]. The Joint consensus rec-ommendation system proposed by these major scientific institutions classifies the variants based on their clinical significance in 4 tiers 1–4. Tier 1 variants are of the most substantial clinical significance and are subdivided to
those related to sensitivity or resistance to FDA approved treatments (Tier 1A.1), those proposed by professional guidelines to have predictive value (Tier 1A.2), and those with a strong consensus concerning their predictive sig-nificance (Tier 1B). The Tier 2 class involves biomarkers with potential clinical relevance. It can be subdivided in variants related to an approved treatment for a different tumor type (Tier 2C.1), variants related to investigational treatments that can be used as an inclusion criterion for patients’ enrollment in clinical trials (Tier 2C.1), and variants that have shown predictive value in preclinical studies (Tier 2D). Finally, the 3 and 4 Tiers, include bio-markers of unknown clinical significance and the benign or likely benign ones respectively [30, 31].
Gene panel comparison
The clinical utility of the 161-gene panel used in this study was assessed by comparison with gene panels com-prising a smaller number of genes. For this purpose, we selected two hotspot panels of 24 and 50 genes, respec-tively, that have been previously used both in our labo-ratory and in several publications for routine access to predictive biomarkers in various tumor types [32–36]. Thus, we compared the alterations that would have been detected in our cohort if the analysis was performed by these panels instead of the broader panel used. (Addi-tional file 1: Table S1). Both smaller panels also included the analysis of 6 fusion driver genes (ALK, ROS1, RET,
NTRK1, NTRK2 and NTRK3) analyzed at the RNA level.
Furthermore, in order to investigate if the number of genes analyzed is adequate for implementation in clinical practice, or if by increasing the number of genes tested a more informative result could be retrieved, we com-pared the actionability of the results obtained from this panel to those obtained using a more comprehensive tumor panel that utilizes the same NGS technology. The panel implemented for this evaluation was the Oncomine Comprehensive plus assay (Thermo Fischer Scientific) that analyses the full coding sequence of 313 genes, hot-spot analysis of 169 genes, CNV of 313 genes (most of them also analyzed for SNV and indels). Furthermore, it includes RNA analysis for 51 fusion driver genes (38 of them also analyzed at the DNA level), adding up to a total of 514 unique genes present in this panel. The intra-panel comparison was performed through a retrospective analysis of genomic data from The Pan-cancer Analysis of
Whole Genomes (PCAWG) study [37].
The web-based Xena Browser was used for visualiza-tion and exploravisualiza-tion of the data [38, 39]. More specifically available data sets from specimens with coding driver alterations information, including single nucleotide vari-ations (SNVs) and small insertions-deletions (indel) and with consensus whole-genome copy number data as well
as consensus fusion calls were downloaded and explored. The 990 specimens with information concerning all three types of alterations available were selected. Subse-quently, we simulated the results that would have been obtained if this analysis had been performed using the gene sets included in the aforementioned panels and we explored the magnitude of the clinically actionable infor-mation obtained in each case. Variant classification and biomarker interpretation were performed as described above. For the copy number variation analysis, only the 43 genes of the Oncomine Comprehensive Panel v3 and the 333 of the Oncomine comprehensive plus panel with focal Copy Number Variations were included. In order to resemble the cutoff values used in everyday practice in our laboratory, a threshold of > 7 copies was used for considering a sample positive for copy number amplifi-cation and a threshold of < 1 copy for considering a gene loss [40].
PD‑L1 expression by immunohistochemistry
For the majority of tumors analyzed (such as lung, colo-rectal, pancreatic and ovarian cancer) as well as for tumors of unknown primary origin, the level of PD-L1 protein expression was defined as the percentage of via-ble tumor cells (TC) showing partial or complete mem-brane staining at any intensity. Furthermore, in some cases, the percentage of tumor Infiltrating Immune Cells (IC) showing staining at any intensity was also calculated [41–43]. In case of bladder, urothelial, and cervical car-cinomas, PD-L1 was calculated through the Combined Positive Score (CPS) which is the percentage of positive cells (tumor, lymphocytes, and macrophages) showing partial or complete membrane staining at any intensity [44, 45]. In case of Head and Neck Squamous Cell
Carci-noma, both CPS and TC values were calculated [46]. The
analysis was conducted using the Immunohistochemis-try (IHC) assay VENTANA PD-L1 (SP263) Assay (Roche Diagnostic) that utilizes the Monoclonal Mouse Anti-PD-L1, Clone SP263 accompanied by OptiView DAB IHC Detection Kit on a VENTANA BenchMark Series automated staining instrument.
For breast cancer patients, the VENTANA Monoclonal Mouse Anti-PD-L1, Clone SP142 antibody was used. The level of expression of the PD-L1 protein was defined as the percentage of tumor-infiltrating Immune Cells show-ing stainshow-ing at any intensity [47].
Physicians survey
In order to investigate the utility of a multi-biomarker analysis in clinical practice and if the results obtained from such approach have an impact in clinical decision making, a questionnaire was given to the referring oncol-ogists, asking whether based on their experience, they
consider such analysis useful for patients with the follow-ing tumor histological type:
Lung, Colorectal, Breast, Ovarian, Prostate, and rare or unknown origin tumors. It was a multichoice survey with the following options of response: (a) Useful, (b) in the metastatic setting only (c) not useful and (d) I do not know/not respond.
Statistical analysis
Fisher’s Exact Test was used to compare the median TMB values and the percentages of TMB positivity of selected groups of patients (PD-L1 positive/negative, MSI-high/ MSS) with SPSS (version 20. IBM SPSS STATISTICS). The p-values were based on Fisher’s Exact Test. A p value < 0.05 was considered to be statistically significant. Box plots were created using the Plotly.js charting library.
Results
Molecular analysis for targeted therapy
In the present study, 629 tumor tissues were subjected to targeted treatment biomarkers’ analysis, using a 161 gene NGS panel. Successful molecular analysis was achieved in 610 of the 629 patients analyzed, while in 19 (3.03%) cases, no results could be obtained due to low DNA/RNA
quality or quantity. The tumor types analyzed included common tumor types with targeted treatment available, such as lung, breast and colorectal cancer, but also vari-ous hard to treat diseases such as pancreatic, ovarian, prostate, brain cancers, sarcomas, cholangiocarcinomas, and others (Fig. 1).
In total, 936 pathogenic variants in 112 genes were detected in 472 patients (Additional file 2: Table S2). Of those, 85.15% were single nucleotide Variants (SNVs) or a small insertions-deletions (indels) detected at the DNA level, while 3.31% of the variants concerned gene fusions and 11.54% Copy Number Variations (CNVs). 11.22% of the 936 variants identified were classified as Tier 1, 86.65% of them as Tier 2 and 2.14% as Tier 3 (Fig. 2,
Additional file 3: Table S3). At least one variant was
detected in 78.52% of the cases. 34.98% of the individu-als analyzed carried one genomic alteration, while 23.81% and 19.87% carried two and three or more mutations respectively. The main reason for multigene test request was the assignment of the appropriate treatment based on patients’ molecular profile. Thus, patients were appor-tioned based on the clinical significance of the altera-tions detected. In the case of multiple mutaaltera-tions present in the same patient, the variant with the highest level of
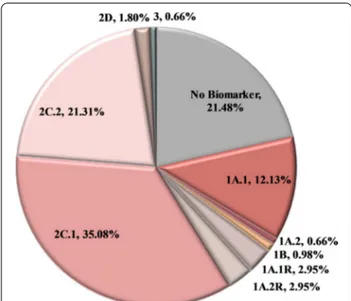
evidence (LoE) was used for establishing the patient’s category. Using this biomarker-defined categorization, 54.75% of the patients analyzed received information that is related to on-label or off-label treatment (Tiers 1A.1, 1A.2, 1B, and 2C.1). Additionally, the variant detected could be used as a criterion for inclusion in clinical tri-als (2C.2) or is under investigation in preclinical stud-ies (2D) in 21.48% and 1.80% of the cases respectively. Furthermore, 5.90% of the patients harbored a variant associated with resistance to treatment (1A.1R, 1A.2R) (Fig. 3). As expected, the most frequently mutated gene in this cohort was the gatekeeper TP53 gene, followed by the KRAS and PIK3CA genes. These genes were mutated in 36.39%, 24.75% and 10.98% of the patients, respectively
(Fig. 4). Furthermore, 7.05% of the patients carried an
alteration in a gene involved in the homologous recom-bination pathway. This type of alterations could be used as predictive biomarkers of response to PARP inhibitors (PARPi) treatment [48, 49].
Tissue specific tumor molecular profile
In order to evaluate if molecular profile analysis is more useful in specific tumor types compared to others, the mutation frequency and clinical significance of the vari-ants detected were calculated for the most common
tumor types analyzed in our cohort (Additional file 4:
Table S4).
Pancreatic cancer
In the present study, 118 patients undertaking tumor molecular analysis had a diagnosis of pancreatic cancer.
KRAS mutation was the prevalent mutated gene in this
tumor type, with a mutation frequency of 74.57%. In 64.41% of the patients, an alteration in this gene was the finding with the higher LoE. However, other gene altera-tions with predictive value (2C.1) coexisted in 10.16% of the KRAS mutant patients. Moreover, in 6 cases (5.08%), the mutation detected was in an HR gene (1 ATM, 2
PALB2, 1 CDK12, 1 FANCA, 1 NBN) with evidence of
Fig. 2 Tier Classification of the 936 pathogenic variants identified in the 610 tumors analyzed based on their predictive value. 1A.1: Biomarkers
related to on‑label treatment, 1A.2: biomarkers included in guidelines, 1B: biomarkers with strong evidence of correlation to treatment, 2C.1: biomarkers related to off‑label treatment, 2C.1: biomarkers related to clinical trials, 2D: biomarkers with preclinical evidence of actionability, 3: biomarkers with unknown actionability
response to PARPi. Additional variants with associated off-label treatments were detected in FGFR1 & 4, HER2,
MET, PIK3CA and POLE genes (Fig. 5, Additional file 5: Figure S1).
Furthermore, 2 patients (1.69%) carried a somatic mutation related to an on-label drug or with strong evi-dence of actionability. These mutations were detected in genes of the mismatch repair complex (MLH1 and
MSH2) and were indicative of microsatellite instability
and thus response to immunotherapy.
Lung cancer
In the 67 Lung cancer, patients tested an
altera-tion was detected in 86.57% of the cases (Fig. 5). The
variant identified was related to an FDA approved treatment in 20.89% of the patients. These variants con-cerned EGFR, BRAF (p.V600) and HER2 mutations in percentages of 8.96%, 4.48% and 1.49%, respectively. Moreover, ALK and RET translocations were detected in 1.49% and 4.48% of the cases, respectively. EGFR TKI resistance conferring KRAS mutations (Tier 1A.2) were detected in 26.87% of the cases. Apart from these estab-lished biomarkers, the expanded gene panel analysis was able to detect additional mutations in multiple other genes with 2C.1 evidence of predictive value in 16.42% of the cases (Additional file 6: Figure S2). Unexpectedly, 6 of the patients (8.95%) carried a mutation in a gene related to PARP inhibitor therapy.
Breast cancer
In the 62 Breast Cancer Patients included in our cohort, a pathogenic variant was found in 80.65% of the cases.
Fig. 3 Patients categorization in the entire cohort based on the
most clinically significant variant detected. In the case of multiple mutations present in the same patient, the variant with the higher level of evidence was used for establishing patient’s category. 1A.1: Biomarkers related to on‑label treatment, 1A.1R: biomarkers related to resistance to an on‑label treatment, 1A.2: biomarkers included in guidelines, 1A.2R: biomarkers related to resistance in a treatment included in guidelines, 1B: biomarkers with strong evidence of correlation to treatment, 2C.1: biomarkers related to off‑label treatment, 2C.1: biomarkers related to clinical trials, 2D: biomarkers with preclinical evidence of actionability, 3: biomarkers with unknown actionability, no biomarker: patients with no biomarker available. In the case of colorectal cancer patients, the clinical significance of the RAS wild type phenotype was not considered in this figure
A Tier 1 variant was detected in 41.94% of the patients, while in 9.68% a Tier 2C.1 variant, related to off-label treatment, was identified. The most prevalent altered gene in these patients was the PIK3CA gene, with 33.87% mutation rate. Additionally, an HR gene alteration was present in 9.68% of the tumors analyzed (Additional file 7: Figure S3).
Other cancers
In the 44 patients with Colorectal cancer, the muta-tion rate was 84.09% (Fig. 5, Additional file 8: Figure S4). Eighteen patients (40.91%) carried a mutation in one of the RAS genes which are biomarkers of resist-ance to EGFR antibodies treatment [50, 51]. Additionally, three patients carried a targetable BRAF somatic muta-tion. One PMS2 positive tumor mutation was proven to be of germline origin, and thus it was considered eligible for immunotherapy treatment. Tumor analysis is essen-tial for patients with colorectal carcinoma, because it provides Tier 1 information on treatment strategy in all cases. Thus, treatment can be directed toward EGFR anti-body therapy in the presence of a wild-type KRAS/NRAS gene finding or toward alternative treatment options if a mutation is detected.
Among the 35 patients with prostate cancer, at least one somatic alteration was identified in 74.29% of them (Fig. 5). In 6 cases, the mutation detected was in an HR gene (17.14%). Furthermore, 87.88% of the 33 patients with ovarian cancer, carried at least one somatic altera-tion. Four patients carried a mutation in BRCA1/2 genes, which are biomarkers of response to PARPi therapy, while in four patients, somatic mutations in off-label biomarkers were identified. Concerning brain tumors, the mutation rate was 83.33%. An alteration with asso-ciated potentially significant predictive biomarker was detected in 13 patients (72.22%) (Fig. 5). However, in this tumor histology, the multigene analysis seems to confer not only predictive but also prognostic/diagnostic infor-mation [52, 53]. Genes with diagnostic significance are used by the World Health Organization Classification of Tumors of the Central Nervous System. For example,
IDH1 and IDH2 mutations are used for distinguishing
primary from secondary gliomas, while the simultaneous presence of IDH1/2 and TP53 alterations are distinctive of the diffuse astrocytoma histology [52].
Concerning the other histological types, even if the number of patients tested is small, it seems that in tumors of the endometrium (18 cases), esophagus (8 cases) and cholangiocarcinoma (25 cases) the mutation
Fig. 5 Mutation Rate and patients’ categorization based on the Tier classification of the most clinically significant variant for each tumor histology.
The following categories were used: 1A/1B: patients harboring alterations that are biomarkers for on‑label treatments or with strong evidence of predictive value for an on‑label treatment (Tier 1), 2C.1: patients with biomarkers related to off‑label treatment, 2C.2: patients with biomarkers related to clinical trials, 2D: patients with biomarkers with preclinical evidence of predictive value, 3: patients harboring alterations with conflicting evidence of cancer association. B. Percentage of patients with On‑label and off‑label mutations identified and the type of alterations detected. Genes of the homologous recombination complex are labeled in blue.
rate is relatively high (94.44%, 75.00% and 72.00% respec-tively). On the contrary low mutation rates are observed in gastric tumors (35 cases), hepatocellular carcinomas (10 cases) as well as in the 34 sarcomas analyzed (65.71%, 50.00% and 47.06% respectively).
Panel comparison
The genetic information obtained by the 161 gene panel used in this study compared to that obtained from pan-els containing fewer genes was evaluated. At this regard, we conducted a comparison of the alterations that would have been detected if two smaller hotspot panels, of 24 and 50 genes respectively, had been used in the 610 patients analyzed (Additional file 9: Table S5).
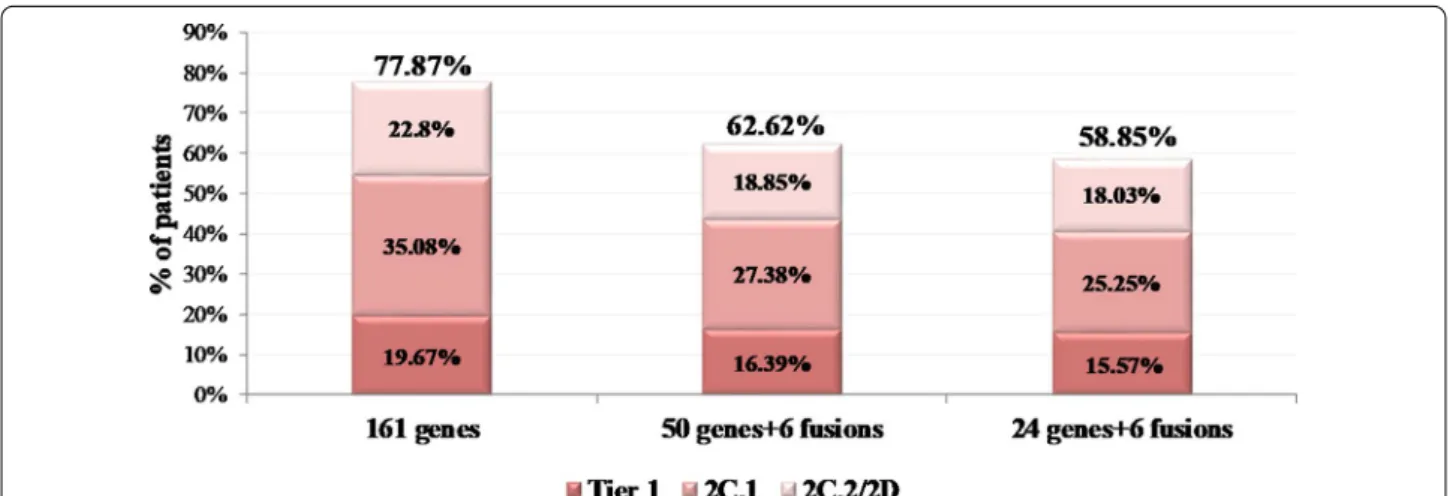
If the 24 gene panel had been used in our cohort, a clinically significant variant (Tier 1 and 2) would have been detected in 58.85% of the cases. In comparison, this percentage would have been 62.62% by using the 50 gene panel. However, these rates are much lower than the 77.87% obtained by the 161 gene panel. Furthermore, considering the on-label and off-label biomarkers, the larger panel managed to detect 13.94% and 10.98% more on/off-label treatment-related biomarkers compared to the 24 and 50 gene panel respectively (Fig. 6).
In order to evaluate if the number of genes analyzed is adequate for implementation in clinical practice, or if by increasing the number of genes tested a more informa-tive result would have been obtained, we compared the actionability of our panel with a more comprehensive panel containing 501 DNA genes and 51 fusion drivers genes (38 of them also analyzed at the DNA level), for a total of 514 unique genes present in this panel (Addi-tional file 10: Table S6, Additional file 11: Table S7).
Among the 990 patients with DNA sequencing results available, an SNV or indel alteration to a driver gene was obtained in 90.4% (895/990) of the cases using the whole genome sequencing approach of the study. In comparison the 161 gene panel would have detected such alterations in 72.12% of the patients and the larger panel 83.03%. At least one Copy Number Variations would have been detected in 29.09% and 47.37% of the cases by the smaller (161 genes) and bigger panel (500+ genes) respectively. Both panels would have detected a fusion driver gene in 7.68% of the cases.
Considering all type of alterations (SNV, indel, CNV, gene fusion), at least one actionable alteration would have been identified in 80.00% of the samples if the 161 gene panel was used and in 90.10% of them if the 514 gene panel was implemented for the analysis (Fig. 7). Further-more, at least one clinically relevant biomarker, related to on/off-label treatment or to clinical trials would have been detected in 78.28% and 85.56% of the cases by the 161 and the 514 gene panels respectively.
Thus, the increase in the number of genes analyzed seems to increase the yield of patients who could benefit from targeted treatments.
Physicians survey
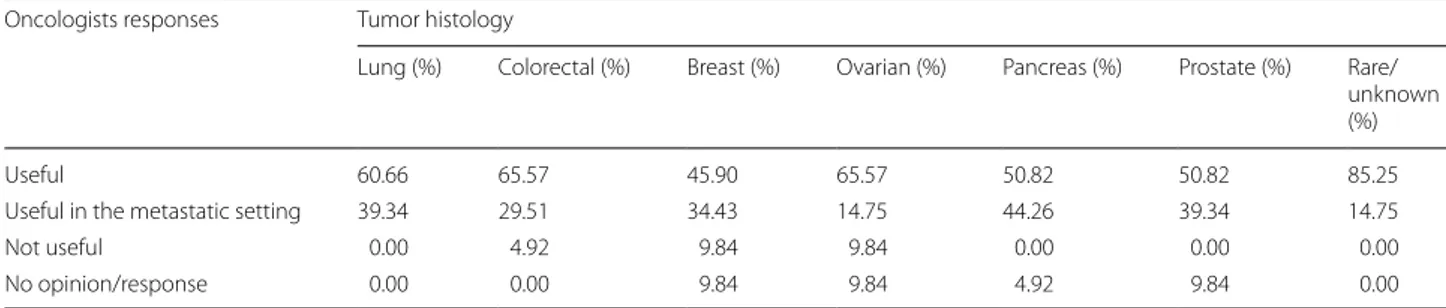
Additionally, in order to investigate the implementation of tumor molecular profile analysis among physicians, a questionnaire was sent to referral oncologists asking whether they consider useful, such analysis for treat-ment decision making in various tumor types. 61 physi-cians responded to the survey. By far, the tumor type with the majority of positive responses was lung cancer, with 100% of the physicians responding that multigene panel should be performed for such tumor type (Table 1).
Fig. 6 Simulation of patients’ biomarker‑defined categorization based on their most clinically significant variant when the analysis is performed
using either the 161 or the 50 or the 24 gene panels. The following categories were used: 1A/1B: patients carrying Tier 1 alterations, 2C.1: patients with 2C.1 alterations, 2C.2/2D Patients with 2C.2 or 2D alterations
For colorectal cancer patients, a multigene analysis was considered useful in the primary or metastatic setting by 95.08% of the participants. For breast, ovarian, prostate and pancreatic cancers, the NGS utility was recognized by 80.33%, 80.32%, 90.16% and 95.08% of the participants respectively.
Immunotherapy biomarkers analysis
Tumor testing can give information for the selection of both appropriate targeted treatment and immuno-therapy. The most known immunotherapy biomarkers are TMB, PD-L1 and MSI analysis. In the cohort of 610 patients with successful NGS testing for targeted therapy, 395 also requested TMB analysis. PD-L1 testing was per-formed in 198 cases, and MSI analysis in 206 patients. In 204 cases, all three immunologic biomarkers were
analyzed (Additional file 12: Table S8) with successful analysis for all of them achieved in 191 cases.
Tumor Mutation Burden
Among the 395 patients with TMB analyzed, 14 cases (3.54%) could not receive a result due to the low quality of the genetic material analyzed. In these cases a high pro-portion (> 60) of variants consistent with de-amination artifacts was detected, and thus these sequencing result could not be evaluated for TMB analysis, as indicated by the manufacturer [54]. A successful TMB calculation was obtained for the remaining 381 patients.
The TMB value ≥ 10 muts/MB has been employed to separate high and low TMB values as indicated by the results of the open-label, phase 2 KEYNOTE-158 study that led to the recent FDA approval of Pembrolizumab
for metastatic solid tumors [29]. The median TMB value
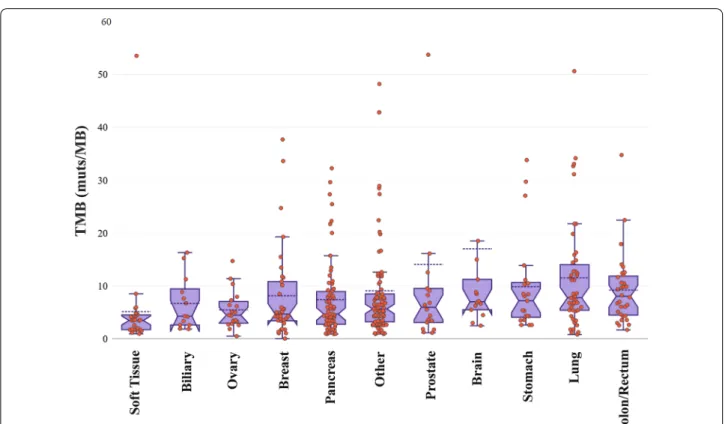
obtained was 5.60 (min 0; max 134), with 96 samples showing a TMB value higher than 10 muts/Mb and 285 samples with a lower than 10 muts/Mb value. The tumor type with the highest TMB median value in our cohort was colorectal cancer (median TMB = 8.02), with 11 samples showing TMB > 10 and 21 samples TMB < 10 muts/Mb, followed by lung cancer (median TMB = 7.72, 25 samples with TMB > 10 and 22 with TMB < 10 muts/ Mb (Fig. 8). The tumor types with the lowest TMB values were sarcomas, ovarian and pancreatic cancers (median TMB 3.43, 4.44 and 4.63 muts/Mb respectively). Accord-ingly, the positivity rates varied by tumor type with lung cancer showing the highest (42.55%) and soft tis-sue tumors displaying the lowest positivity rate (3.70%) (Fig. 9).
PD‑L1 expression
Among the 206 patients referred for PD-L1 analy-sis by immunohistochemistry, a successful analyanaly-sis was achieved in 198 cases. PD-L1 positivity (> 1%) was observed in 38.89% of them (77/988). Moreover, an intense PD-L1 expression was observed in 9.09% of the patients, exhibiting TPS values greater than 50% or CPS greater than 50.
Fig. 7 Simulation of the 990 PCAWG samples’ categorization based
on their most clinically significant variant when the analysis is performed using either the 161 the 514 gene panels. The following categories were used: Tier 1 variants: patients carrying at least one Tier 1 alteration, 2C.1: patients whose most clinically significant variant is classified as 2C.1, 2C.2: patients with 2C.2 alterations, 2D: patients with 2D alterations, Tier 3: patients carrying Tier 3 alterations
Table 1 Oncologists responses concerning the clinical utility of NGS multigene analysis in various tumor types
Oncologists responses Tumor histology
Lung (%) Colorectal (%) Breast (%) Ovarian (%) Pancreas (%) Prostate (%) Rare/ unknown (%)
Useful 60.66 65.57 45.90 65.57 50.82 50.82 85.25
Useful in the metastatic setting 39.34 29.51 34.43 14.75 44.26 39.34 14.75
Not useful 0.00 4.92 9.84 9.84 0.00 0.00 0.00
Fig. 8 Box plots showing the median TMB values in various tumor types. Three samples with TMB values > 60 were omitted from the plot for
visualization purposes
In the 26 lung cancer patients tested 69.23% had a TPS value > 1, with 19.23% showing an intense (> 50%) PD-L1 expression. The positivity rate in various tumor types is illustrated in Fig. 10. Among the 77 PD-L1 positive cases identified in our cohort 26 patients (33.77%) showed con-comitant TMB positivity (> 10muts/MB).
In accordance to previous studies, no association of TMB and PD-L1 values was observed (Fig. 11) [55, 56].
Microsatellite instability
Microsatellite instability was detected in 8 out of the 206 tumors tested (3.88%), while for one tumor the analy-sis failed due to the low quality of the genetic material obtained. Patients with tumors showing MSI high status had a diagnosis of Ovarian cancer, Pancreatic cancer, Colorectal cancer, Prostate cancer, Gastric cancer and Sarcoma. In 2 cases, the tumor instability was linked to hereditary mutations in MMR genes (MSH2 and
PMS2). TMB analysis data were also available in 7 of
these patients with 6 of them showing high TMB value (> 13.46muts/MB). Thus a strong correlation between TMB and MSI was observed with MSI high tumors showing higher median TMB values, in accordance with previous studies [57, 58]. However, it should be noted that among the 193 MSI stable patients with TMB data available, high TMB values were also observed in 42 cases (Fig. 11).
MSI is known to be caused by impairment of the MMR gene system, leading to increased neo-antigen burden and thus elevated TMB. However, this represents only one of the oncogenic processes related to elevated TMB values. Several other mechanisms, such as environmen-tal carcinogens and specific gene alterations are known to induce mutagenesis and thus TMB increment, result-ing in higher positivity rates for this biomarker in several tumor types [59, 60]. Given its compelling evidence of predictive value; TMB is superior to MSI analysis, iden-tifying more patients eligible for PD-1/PD-L1 blockade compared to MSI.
Immunotherapy biomarkers’ comparison
Among the 191 patients with all three immunotherapy biomarkers tested, ICIs option based on TMB result could be considered in 44 patients (23.04%), 26 of them with simultaneous PD-L1 positivity. Furthermore, 51 additional patients showed PD-L1 positivity and 1 MSI-high result. Collectively, positivity to one of these bio-markers and thus a possibility of benefit from ICIs treatment was observed in 50.26% (96/191) of these patients.
Furthermore, the analysis of both targeted treatment and immunotherapy biomarkers, revealed an actionable finding (Tier 1 or 2) in 83.25% of the cases. Moreover, the addition of the immunotherapy biomarkers to the molec-ular profile analysis increased the number of patients
with an on-label treatment recommendation by 22.92%
(Fig. 12). TMB analysis increased the LoE of treatment
recommendations to 1A.1 in 36 cases, with 23 of them showing concomitant PD-L1 positivity.
The value of ICI biomarker analysis was also observed in tumor types that are highly represented in this cohort, such as lung and pancreatic cancer. In the 26 lung can-cer patients analyzed for both types of biomarkers, an increase in on-label treatment recommendation of 61.54% was observed after targeted therapy ers were supplemented with immunotherapy biomark-ers, with 96.15% of these patients having an on-label or off-label biomarker detected. In addition, among the 29 pancreatic cancer patients with comprehensive tumor analysis of ICI and targeted therapy biomarkers, a bio-marker associated with on-label treatment was detected in 10.34% of cases, whereas this percentage would be reduced to 3.45% if ICI biomarkers were excluded from the analysis.
Discussion
Molecular profile analysis
In the present study, 629 cancer patients have been referred by their treating physician for biomarkers’ analy-sis using a 161 gene NGS panel. In 610 of them, a suc-cessful tumor molecular profile was obtained with at
least one actionable variant (Tier 1–2) being detected in 77.87% of the cases. All pathogenic variants were catego-rized based on their clinical significance, and only Tier 1
Fig. 11 TMB‑MSI and TMB‑PD‑L1 correlation
Fig. 12 Patients’ categorization based on the level of evidence of
the most clinically significant variant associated with response, with and without the use of immunotherapy biomarkers. Biomarkers associated with resistance were excluded from this analysis
and 2 variants were reported since variants of unknown significance, and the benign/likely benign ones were con-sidered confusing rather than useful for the treatment course information. In 54.75% of the patients, the infor-mation obtained could be used for on-label or off-label treatment reception (Tiers 1A.1, 1A.2, 1B, and 2C.1) while 21.31% of the cases received a variant that could be used for clinical trials inclusion.
Tests offering comprehensive tumor molecular profil-ing are currently beprofil-ing requested by a steadily increasprofil-ing number of oncologists, especially for patients with lim-ited treatment options available. A good implementa-tion of tissue analysis in treatment decision making was observed in the survey conducted in this study among oncologists. More than 80% of the participating physi-cians consider clinically useful the tissue NGS analysis for a variety of common tumor types. This percentage was increased to 100% for tumors with many targeted treatment options available such as lung cancer and for tumors with few treatments available such as tumors of unknown origin or rare tumors.
Advances in sequencing technologies and NGS plat-forms throughput have permitted simultaneous analy-sis of multiple tumor biomarkers at an adequate time frame to be tailored fit in the design of the treatment plan and at an affordable cost for the patients. The infor-mation obtained can be used to address targeted treat-ment, immunotherapies or in case of negative results traditional treatment approaches. Various studies have shown the efficacy of gene-directed treatment com-pared to the unselected treatment assignment [5, 61, 62]. In the IMPACT (Initiative for Molecular Profiling and Advanced Cancer Therapy) study the overall response rate (ORR), and the time-to-treatment failure (TTF) were higher in patients with a molecular aberration that received a matched treatment compared to those who received unmatched treatment [6]. Similarly, in the IMPACT/COMPACT trial, the response rate of patients treated according to their genotype had an overall response rate superior compared to those treated on gen-otype unmatched clinical trials (19% VS 9% respectively)
[7]. Accordingly, the National Comprehensive Cancer
Network (NCCN) guidelines outline the contribution of broad molecular profile analysis in the improvement of patients’ care in various tumor types. Likewise, the European Society for Medical Oncology (ESMO) rec-ommends routine utilization of tumor NGS analysis for NSCLC, prostate cancer, ovarian cancer and cholangio-carcinoma [63].
Furthermore, more than 200 ongoing clinical tri-als are currently investigating the impact of molecu-lar directed treatment and the eventual benefit of this approach in patients with several advanced solid
tumors and hematological malignancies (www. clini caltr
ials. org). Among these, several tumor-agnostic rand-omized (NCT02152254, NCT03084757) and non-rand-omized (NCT02465060, NCT03155620, NCT02693535, NCT02290522, NCT03297606, NCT02029001) trials are expected to provide evidence of the clinical benefit of such approach in multiple solid tumor types. Hence, several pharmaceutical companies are focusing on the development of treatments with pan-cancer efficacy
[9]. The first tumor agnostic therapy with a biomarker
included receiving FDA approval was the PD-1 inhibitor Pembrolizumab, which was approved for patients with
MSI unstable tumors [9]. Subsequently, TRK inhibitor
therapy gained approval in NTRK fusion-positive can-cers independently from the tumor’s histology [64–66]. Even though the clinical value of these biomarkers can-not be disputed, the percentage of patients positive for these biomarkers is relatively small. For example, in our study, only 8 out of the 198 patients analyzed presented microsatellite instability. This biomarker seems to be more significant for colorectal cancer patients, where it is present in 10–15% of the cases, while it is of no use for other tumor types, where it is rarely detected [20]. Simi-larly, the frequency of NTRK fusions in solid tumors of adults is extremely rare in certain tumor types [64, 67]. Consequently, no positive NTRK tumor was detected in our cohort.
On the other hand, there are agents, with associ-ated biomarkers, that have shown activity in a variety of tumor types. PARP inhibitors are a typical example of such agents having already received approval for Ovar-ian, Breast, Pancreatic and Prostate cancer patients har-boring BRCA1/2 mutations (https:// www. fda. gov). Apart from BRCA1/2 mutations, other genes involved in the same pathway of homologous recombination seem to be adequate biomarkers of response to such agents, with several clinical trials investigating the expansion of PARPi targeting biomarkers [48, 68–71] (www. clini caltr ials. org). These efforts led to the recent approval of the PARP inhibitor Olaparib for metastatic castrate-resistant pros-tate cancer patients with mutations in other HR genes besides BRCA1/2, increasing the percentage of patients with a potential predictive biomarker result who could
benefit from that treatment [69, 72]. Thus, multigene
analysis providing comprehensive information about the mutational status of HR genes should be used for bet-ter identification of responders to such therapy. In our cohort, 7.05% of the patients carried an alteration in an HR gene, with certain tumors showing increased levels of these alterations, such as breast cancer (9.68%), ovarian cancer (20%) and prostate cancer (17.14%). Moreover, the majority (74.42%) of the HR-positive patients, carried an HR gene mutation in a non BRCA1/2 gene, indicating the
necessity of gene panel analysis for the identification of patients eligible for PARPi treatment.
An important issue when a multigene analysis is requested is the number of genes that should be included in such analysis and whether analyzing so many genes is offering more solutions in the physicians’ search for an appropriate targeted treatment option for their patients. Therefore, we compared our 161 gene panel with two smaller ones of 24 and 50 genes. The genes included in these panels have been widely used in our laboratory and others to identify clinically relevant mutations in various
tumor types [32–36]. However, recent advances in the
discovery of predictive biomarkers seem to be forcing the analysis of more genes that could provide more treat-ment options for these patients. Nevertheless, there is still skepticism among some oncologists about the clini-cal utility of broader gene analysis. However, our results showed that if the analysis had been performed with the 24 and 50 gene panels, the percentage of positive cases would have been reduced to 58.85% and 62.62%, respec-tively, compared to the 77.87% obtained with the 161-gene panel. On the contrary, for lung cancer patients, the use of 24 gene panel seems acceptable for analysis since it could identify all biomarkers related to on-label treat-ments’ sensitivity or resistance (46.97%). Thus, our results indicate that the 24 and 50 gene panels are not adequate for pan-cancer analysis since drug approvals of the recent years recommend the analysis of more biomarkers, with the exception of lung cancer.
A panel analyzing 514 single genes has been recently implemented for tumor analysis in our laboratory. Since we have observed an increase in the rate of patients with a positive tumor finding of at least 10% in the first 50 samples analyzed, we decided to compare it with the panel used in this study in order to evaluate if it could increase the actionable information obtained by tumor testing analysis. Thus, 990 samples with known genetic profile from PCAWG database were used in order to simulate the percentage of tumor alterations that could be obtained using different size of cancer panels. Among these samples, if the 161 gene panel was used, an SNV or indel alteration in a driver gene would have been detected in about 72% of the cases. The utilization of a larger panel slightly increases the number of actionable alterations obtained to 83%.
A result related to on/off-label treatment or to a clini-cal trial would be obtained in 85.56% of the cases if the 514 gene panel was used compared to 78.28% obtained by the 161 gene panel. Thus, both panels seem to give comparable results in terms of the actionable informa-tion obtained with the 514 gene panel, including the most actionable biomarkers. The main limitation of this comparison is that the variant calling, and copy number
methodologies vary between the targeted assays and the whole genome methodology used in the PCAWG project. Nevertheless, the increase in the number of clinically significant variants identified when a larger panel is used, reflects what is usually observed in clini-cal practice.
Despite all the advantages, there is much skepticism concerning the use of a personalized selection of appro-priate treatment. A first difficulty in using broad tumor molecular profile analysis for treatment selection is the unavailability in some cases of appropriate tumor tis-sue to perform the analysis. This could be due to the low quantity/quality of the tissue available or to its inacces-sibility in some inoperable tumor types [73, 74]. It has been shown that among patients enrolled in tumor-directed treatments, only 70–90% of them had adequate tissue quantity/quality to achieve a successful molecular
profile [75]. The technology used in our study permits
tumor molecular profile analysis from a limited quantity of genetic material. Hence, in our cohort more than 97% of the tumor samples were successfully analyzed.
Furthermore, such analysis can provide an immense quantity of genetic data that needs to be appropriately analyzed and interpreted. Thus, the role of bioinformatics analysis is becoming major to provide accurate
molecu-lar analysis results [76]. Moreover, standardization of
variant annotation and reporting could facilitate the understanding of the results obtained and increase their reliability. In our experience, in the majority of cases with findings associated to off-label treatments recommenda-tions, the long lasting procedures required for the off-label approval of the suggested treatment from the local National Drug Organization for Medicines (“EOF”), or for clinical trial enrollment, often challenged the utiliza-tion of the results, especially in cases with advanced dis-ease, requiring immediate management.
While, it is standard practice to perform accurate pre- and post-test counseling prior to a genetic testing for hereditary cancer susceptibility, this is not the case for somatic mutation analysis [77]. However, it is critical that patients referred for genetic tumour analysis to be accu-rately informed of the need for and potential outcomes of such testing. In addition, patients should be informed of the possibility that a variant in a gene with known germline mutations may be identified and that variants detected in a high percentage (> 40%) are considered ger-mline suspicious. Since this analysis cannot distinguish between germline and somatic variants, clarification of the origin of a variant requires analysis of the patient’s healthy tissue, usually blood or saliva.
In our cohort, 17 patients with a family history of can-cer, requested blood analysis for suspicious germline variant identified in tissue. In 14 of them (82.35%) the
germline origin of the tissue alteration was confirmed (Additional file 13: Table S9).
Immunotherapy biomarkers
Analysis of the tumor’s molecular profile useful as it is, it seems to be just another piece of the puzzle, since com-prehensive tumor profile should include both biomark-ers to guide treatment decision making for both targeted therapy as well as for immunotherapy. Thus, the physi-cian having more biomarkers in his disposition could bet-ter comprehend the tumor’s biology and decide whether targeted therapy or immunotherapy matches better in each case. In our cohort analysis of biomarkers for both immunotherapy and targeted therapy, was requested in 395 patients, with TMB being the most common immu-notherapy biomarker requested. All three biomarkers’ analysis was successful in 191 cases.
25.20% of the 381 patients tested had a TMB value > 10muts/MB and thus were eligible for ICI treat-ment. The median TMB values observed in our popula-tion were slightly increased compared to those observed in previous studies [57, 78]. This could be attributed to methodological differences and to the fact that in the majority of cases the patients analyzed have received more than one treatment lines, commonly chemother-apy, which is known to increase tumor’s mutation load
[79]. Similarly, to our study a TMB positivity rate of
21.1% was observed in a recent study analyzing
immu-notherapy biomarkers in 48.782 clinical samples [80].
TMB has emerged as a promising biomarker of response to such treatments, and several clinical trials have shown that both blood and tissue samples TMB can effectively be used [23, 25, 27, 81]. Moreover, the recent approval of anti-PD1 treatment Pembrolizumab for metastatic can-cer patients harboring a TMB value > 10mut/ΜΒ renders the analysis of such biomarker indispensable for treat-ment selection strategy.
However, this biomarker has also limitations since TMB calculation methods can differ between different assays, while the gene content of the methodology used
seems to affect the TMB values obtained [82–84].
Fur-thermore, the cut-off values for this marker are not yet fully established. All these issues are addressed from the International harmonization initiatives led by Friends of Cancer Research (FOCR) and the Qualitätssicherungs-Initiative Pathologie (QuIP) [82–84].
Concerning the other immunotherapy biomarkers, analyzed in this study (PD-L1 and MSI), they could assist in a more accurate patients’ selection for treatment with checkpoint inhibitors. PD-L1 expression, measured by immunohistochemistry methods is the most widely used biomarker and the first to be approved for
treat-ment with checkpoint inhibitors [15]. Nevertheless, it
is not applicable in many tumor types, and its sensitiv-ity and specificsensitiv-ity in identifying patients eligible for immunotherapy have also been questioned [15, 16, 27,
85–87]. Moreover, while MSI analysis seems to be an
appropriate biomarker, its low incidence in the ity of tumor types limits its clinical utility in the major-ity of neoplasms. In our cohort microsatellite instabilmajor-ity was observed in just 3.88% of the cases; thus, it cannot stand alone as an immunotherapy biomarker, render-ing the addition of other biomarkers indispensable to increase the number of patients who could benefit from such treatments.
The incidence of TMB positivity is superior to that of MSI (25.20% compared to 3.88%). Furthermore, in 21.88% (42/193) of the MSI stable cases, a TMB value of > 10muts/MB was observed; thus, these patients could receive ICI based on the TMB result only. Moreover, no association between TMB and PD-L1 values was observed. This is in agreement with previous studies, indicating lack of association between median values of these biomarkers. However, in accordance to a recent study, a higher TMB positivity rate was observed in
the PD-L1 positive group [80]. The TMB positivity rate
among the PD-L1 positive patients was 33.77% (26/77) compared to 15.79% (18/114) in the PD-L1 negative group (p = 0.005). Importantly, it has been reported that patients with positive values for both TMB and PD-L1 could have greater benefit from such treatment com-pared to those showing positivity for only one of these biomarkers [55, 56]. Collectively, among the 191 patients with all three immunotherapy biomarkers tested, ICIs option based on TMB result could be considered in 44 patients (23.04%), 26 of them with simultaneous PD-L1 positivity.
As it can be seen in the Venn diagram (Fig. 13) showing the correlation among these biomarkers in 191 patients tested for all three biomarkers, 50.26% of the cases had at least one positive biomarker. A positive result for both PD-L1 and TMB was seen in 13.61% of the cases (with simultaneous MSI high result in 3 cases). In 2 patients concomitant TMB and MSI high values were observed (1.05%). An additional 35.60% % of the patients could receive immunotherapy-based one either TMB or PDL-1 or MSI positivity (8.38%, 26.70%, 0.52% respectively).
The analysis of immunotherapy biomarkers, though, does not seem to be the only determinant of response to ICI, since the tumor mutational status also seems to have a significant influence on the probability of response. For example, several studies have shown the reduced efficacy of ICIs in Non-Small Cell Lung cancer patients harboring EGFR mutations and ALK rearrangements [55, 88, 89]. The absence of such targetable alteration could direct the treatment strategy to immunotherapy in
these malignancies. In addition, it has been shown that alterations in certain genes, such as KRAS, TP53, MET,
ARID1A and others are enriched in immunotherapy
responsive patients. Thus, their identification could lead to such treatment option [90–92].
Moreover, alterations in DNA repair genes such as the MMR genes, POLE and HR genes have been shown to have a positive predictive effect and are correlated to
increased TMB values [93–96]. In contrast, other gene
alterations such as JAK1/2 and STK11/LKB1, KEAP1 and PTEN mutations are related to resistance to PD-1 Blockade [90, 97–99]. Interestingly, in our study, 2 of the patients with TMB high values and one patient with PD-L1 positive result also harbored an STK11 mutation. In none of these cases, immunotherapy response was achieved.
Thus, the addition of immunotherapy biomarkers to tumor molecular profiling seems to be a one-way road in order to achieve a comprehensive tumor characterization and provide the right treatment option for each patient. Moreover, the simultaneous analysis of such biomarkers, leads to the increase of patients with an on-label treat-ment recommendation by 22.92%. By combining immu-notherapy and targeted therapy biomarkers, 71.35% of the patients analyzed received information related to on-label or off-on-label treatments. This is obviously improved compared to the 50.52% of on/off-label biomarkers
achieved by analyzing only the molecular profile of the tumor in the same patient cohort.
Nowadays it seems that the tissue is not the issue any-more, since NGS technological advantages permit the simultaneous analysis of many targets from limited tis-sue material, achieving to analyze up to 97% of the tistis-sue samples as in the present study. The challenge, though, when these analyses are performed is their implementa-tion in clinical practice. Thus, the results obtained must be appropriately comprehended and adopted for the des-ignation of the treatment selection strategy, which can be achieved through inter-discipline collaboration. To this regard, of great use would be the presence of a mul-tidisciplinary Molecular Tumor Board that could assist in the accurate interpretation of the findings obtained from such complex NGS analysis and provide therapeutic recommendations based on all available clinical data for each individual patient [100–102].
Conclusions
The NGS analysis conducted in this study offered action-able information (Tier1 and 2) in 77.87% of the 610 patients with tumor molecular profile analysis available. Moreover, simultaneous analysis for targeted therapy and immunotherapy biomarkers resulted in a better tumor characterization and provided actionable infor-mation in 83.25% of the 191 patients tested, with one to
two patients being eligible for ICI treatment based on the biomarkers’ analysis. Thus, the comprehensive analysis of these biomarkers increased the number of patients with a treatment-related finding and contributed to a more individualized approach for cancer treatment. In conclu-sion, the present study has shown that the implementa-tion of molecular profiling using appropriate pan-cancer panels in clinical practice is feasible. Of significance, is the appropriate comprehension of the molecular results obtained from such analysis and their proper utilization for designing the treatment selection strategy, which can be achieved through inter-discipline collaboration. Abbreviations
NGS: Next Generation Sequencing technology; IHC: Immunohistochemistry; MSI: Microsatellite instability; TMB: Tumor Mutational Burden; SNVs: Single nucleotide Variants; Indels: Insertion–deletions; CNVs: Copy Number Variations; AMP: Association for Molecular Pathology; ACMG: The American College of Medical Genetics; ASCO: The American Society of Clinical Oncology; CAP: The College of American Pathologists; TC: Tumor cells; IC: Immune cells; ICI: Immune checkpoint inhibitors; ESMO: European Society for Medical Oncol‑ ogy; NCCN: National Comprehensive Cancer Network; PARPi: PARP inhibitors.
Supplementary Information
The online version contains supplementary material available at https:// doi. org/ 10. 1186/ s12920‑ 021‑ 00952‑9.
Additional file 1: Table S1. Title: Genomic Regions and fusions analyzed with the 24 and 50 gene panels. Additional file 2: Table S2. Title: Gene alterations detected by the 161 gene panel. Description: The frequency of the different mutation types (SNVs, indels, CNV, fusions) for each gene is reported. Additional file 3: Table S3. Title: Alterations identified by the 161 gene panel in the 610 patients analyzed. Description: Genomic alterations and level of evidence of the variants detected in the 610 patients analyzed. The tumor type, age of diagnosis and gender are also reported. Additional file 4: Table S4. Title: Biomarker’s summary in the 610 patients included in the study. Description: Patients’ categorization based on TIER classification of their most clinically significant variant and immunotherapy biomarkers’ results are reported. Additional file 5: Figure S1. Title and description: Pancreatic cancer patients’ categorization based on TIER classification of their most clinically significant variant. A. Pancreatic cancer patients’ categorization based on TIER classification of their most clinically significant variant. Patients were categorized in the following categories: No Biomarker: Patients with no biomarker available, 1B: Patients harboring biomarkers with strong evidence of correlation to treatment, 2C.1 KRAS: Patients with a single finding in the KRAS gene, 2C.1: Patients with biomarkers related to off‑label treatment. B. Percentage of patients with On‑label and off‑label mutations identified and the type of alterations detected. Genes of the homologous recombination complex are labeled in blue. Additional file 6: Figure S2. Title and description: Lung cancer patients’ categorization based on TIER classification. A. Lung cancer patients’ categorization based on TIER classification of their most clinically significant variant. The following categories were used:, 1A.1: Patients with biomarkers related to on‑label treatment, 1B: Patients harboring biomarkers with strong evidence of correlation to treatment, 2C.1: Patients with biomarkers related to off‑label treatment, 1A.2R; 2C.1: Patients harboring a KRAS mutation related to resistance to treatment plus an off‑label, 1A.2R: Patients harboring a KRAS mutation related to EGFR TKIs resistance, 2.C.2: Patients B. % of patients with On‑label and off‑label mutations identified and the type of alterations detected. Genes of the homologous recombination complex are labeled in blue. Additional file 7: Figure S3. Title and description: Breast cancer patients’ categoriza‑ tion based on the TIER classification. A. Patients’ categorization based on
TIER classification of their most clinically significant variant. The following categories were used: No Biomarker: Patients with no biomarker avail‑ able, 1A.1: Patients with biomarkers related to on‑label treatment, 2C.1: Patients with biomarkers related to off‑label treatment, 2C.2: Patients with biomarkers related to clinical trials, 2D: Patients with biomarkers with preclinical evidence. B. Percentage of patients with On‑label and off‑label mutations identified and the type of alterations detected. Genes of the homologous recombination complex are labeled in blue. Additional file 8: Figure S4. Title and description: Colorectal cancer patients’ cat‑ egorization based on TIER classification. A. Patients’ categorization based on TIER classification of their most clinically significant variant. Patients were categorized in the following categories: No Mutation, 1A.1: Patients with no mutation in KRAS/NRAS genes with or without other variations, 1A.2: Patients with biomarkers included in professional guidelines, 1A.1R: Patients harboring either KRAS or NRAS mutations related to resistance to treatment. B. % of patients with on‑label and off‑label mutations identified and the type of alterations detected. Additional file 9: Table S5. Title and description: Alterations that would have been detected if two hotspot panels of 24 and 50 genes respectively, had been used in the 610 patients analyzed. Additional file 10: Table S6. Title and description: Simulation results of the alterations that would have been identified if the gene set of the 161 gene NGS panel was used in the PCAWG samples. Additional file 11: Table S7. Title and description: Simulation results of the alterations that would have been identified if the gene set of the 514 gene NGS panel was used in the PCAWG samples. Additional file 12: Table S8. Title and Description: TMB, PD‑L1 and MSI results in the 395 patients with at least one immunotherapy biomarker requested. Additional file 13: Table S9. Title and Description: Patients with suspicious hereditary pathogenic find‑ ings detected in tumor tissue.
Acknowledgements
The authors would like to thank all the doctors who participated in this study and all the patients who consented to the use of their genetic material. Authors’ contributions
MO: Conceptualization, Data curation, Formal analysis, Methodology, Supervi‑ sion, Writing—original draft, Writing—review and editing. EP: Conceptualiza‑ tion, Data curation, Formal analysis, Methodology, Supervision, Writing— original draft, Writing—review and editing. NT: Data curation, Supervision, Writing—review and editing. AT: Methodology, Writing—review and editing. VM: Data curation, Writing—review and editing. GT: Data curation, Writ‑ ing—review and editing. EK: Analysis of Data, Writing—review and editing. EB: Analysis of Data, Writing—review and editing. DF: Analysis of Data, Writ‑ ing—review and editing. GK: Analysis of Data, Writing—review and editing. IB: Data curation, Writing—review and editing. NT: Data curation, Review and editing. AF: Data curation, Review and editing. AA: Data curation, Review and editing. PK: Data curation, Review and editing. DT: Data curation, Review and editing. EG: Data curation, Review and editing. LG: Data curation, Review and editing. BO: Data curation, Review and editing. ST: Data curation, Review and editing. TO: Data curation, Review and editing. OK: Data curation, Review and editing. OC: Data curation, Review and editing. GN: Data curation, Resources, Writing—original draft, Writing—review and editing. All authors read and approved the final manuscript.
Funding
GENEKOR MSA provided support in the form of salaries for authors EI, NT, AT, VM, GK, EK, EB, GT, DF and GN but did not have any additional role in the study design, data collection and analysis, decision to publish, or preparation of the manuscript. The specific roles of these authors are articulated in the ‘author contributions’ section.
Availability of data and materials
All data generated or analyzed during this study are included in this published article and its supplementary information files.