Contents lists available atScienceDirect
Computers and Electronics in Agriculture
journal homepage:www.elsevier.com/locate/compagOriginal papers
A study on visual features of leaves in plant identi
fication using artificial
intelligence techniques
Enes Yigit
⁎, Kadir Sabanci, Abdurrahim Toktas, Ahmet Kayabasi
Depertment of Electrical Electronics Engineering, Engineering Faculty, Karamanoglu Mehmetbey Unıversity, 70100 Karaman, Turkey
A R T I C L E I N F O
Keywords: Plant species Identification
Image processing technique Artificial intelligence techniques Fourier Transform
A B S T R A C T
In this paper, artificial intelligence techniques (AIT) such as artificial neural network, naive bayes algorithm, random forest algorithm, K-nearest neighborhood (KNN) and support vector machine (SVM) are implemented to design an automatic identifier for the plant leaves. For this purpose, data of 637 healthy leaves consisting of 32 different plant species are used. 22 visual features (VF) of each leaf are extracted by using image processing techniques. These 22 VF are considered in 4 groups including dimension (D#6), color (C#6), texture (T#5) and pattern (P#5). In order to investigate the effects of these groups on the classifying performance, 15 possible different combinations from the 4 groups are constituted. The models are then trained via the data of 510 leaves, and their accuracy are tested through the data of 127 leaves. From the results of the test, SVM model with the accuracy of 92.91% is found to be the most successful identifier for combination including all groups. The next best result is achieved with the accuracy of 87.40% for the combination of D#6, C#6 and P#5 groups. Since the most important issue in the classification process is the use of the minimum number of VF, 16 most effective VF on the identification are determined by means of correlation-based feature selection (CFS) method. The best result for these 16 VF is also achieved with the accuracy of 94.49% by the SVM model. Then the performance of the proposed method is tested to identify the diseased and defected leaves. Therefore, 637 healthy and 33 diseased/defected leaves are put together. Randomly selected 536 leaves corresponding to 80% of all leaves are used for training and the remaining 134 leaves are used for testing, and identified with the accuracy of 92.53% by the SVM model. With this study, it is numerically revealed that the P#5 is the most effective feature group. Moreover, it has been determined that the most effective feature in the P#5 group is the feature of edge Fourier transform. The results point out that, if AIT models are properly modelled and trained, they can be successfully and effectively applied to the identification of the plants even if there are diseased and defected samples.
1. Introduction
Identification of plant species from leaf, bark and needle images is an important requirement for the foresters and botanists. However, for non-specialists it is difficult to determine the plant species from the leaves of a plant. That’s why, automatic identification of plant species according to their visual features (VF) have become a significant topic in recent years (Grinblat et al., 2016; Sladojevic et al., 2016; Zhao et al., 2015). Artificial intelligence techniques (AIT) can be integrated to computer vision so as to provide automatic quality assessment. The use of image processing and artificial intelligence combination to solve such classification problems produces effective results (Bakhshipour and Jafari, 2018; Kazmi et al., 2015; Munisami et al., 2015b; Yasar et al., 2015). Thus, a rapid and unmanned system with reduced errors can be developed to identify the plants from their leaves.
The well-known AIT applied for modelling identifier are Artificial Neural Network (ANN) (Bakhshipour and Jafari, 2018; Yasar et al., 2015), support vector machine (SVM) (Kazmi et al., 2015) and K-nearest neighbors (KNN) (Munisami et al., 2015b; Yigit, 2018). These identifiers classify leaves using different feature groups regarding the shape, color, texture and pattern of the leaves. To test the performances of the AIT, various sets of leaf species such as Flavia (Laga et al., 2012; Sulc and Matas, 2014), AgrilPlant (Pawara et al., 2017), LeafSnap (Kumar et al., 2012), Swedish Leaf (Hu et al., 2012; Kazmi et al., 2015) and Folio (Munisami et al., 2015b) have been employed and several studies have been conducted to identify leaf species in the literature. Beghin, et al., (Beghin et al., 2010) introduced an approach that com-bines relatively simple methods utilizing shape and texture groups. The study using shape and texture groups only provided 81% accuracy. Arun, et al., (Arun and Durairaj, 2017) presented an automated system
https://doi.org/10.1016/j.compag.2018.11.036
Received 11 June 2018; Received in revised form 20 September 2018; Accepted 26 November 2018 ⁎Corresponding author.
E-mail address:[email protected](E. Yigit).
Available online 03 December 2018
0168-1699/ © 2018 Elsevier B.V. All rights reserved.
for recognizing the medicinal plant leaves by using the feature-com-putation. These features included grey textures, grey tone spatial de-pendency matrices and local binary pattern operators. In (Arun and Durairaj, 2017), six different classifiers were used and the best result was obtained with the accuracy of 94.7%. Hu R. et al., (Hu et al., 2012) presented a contour-based shape descriptor called multiscale distance matrix which is used to capture the geometry of shapes. Kadir, et al., (Kadir et al., 2013) proposed a method that incorporates shape, vein, color, and texture groups. The proposed method gave average accuracy of 93.75% when it was tested on Flavia set which contains 32 species of plant leaves. Munisami et al., (Munisami et al., 2015b) used KNN based classifier with the Folio leaf set. For each plant, they achieved 83.5% classification success with shape characteristics. They then improved the accuracy performance to 87.5% by adding color histograms (Munisami et al., 2015b). As reviewed the literature, limited accuracy rate was obtained through restricted number of features. Therefore, a comprehensive study is needed to determine influential VF to achieve the identification with high accuracy.
In this study, the effectiveness of AIT together with VF on the leaf classification is investigated. For this purpose, AIT of ANN, naive bayes algorithm (NBA), random forest algorithm (RFA), KNN and SVM are employed through the Folio leaf-set. In order to input the AIT models, 22 VF from each leaf of the entire 637 leaves are extracted using image processing techniques (IPT). The features of 510 and 127 leaves which are uniformly selected from the total number of 637 leaves are re-spectively employed to train the models and test the accuracy of the identifier. Moreover, 15 possible different combinations of feature groups such as dimension (D#6), color (C#6), texture (T#5) and pat-tern (P#5) are constituted to particularly investigate the impact of those combinations on the classification. Then 16 most effective fea-tures from 22 VF on the identification are determined by means of correlation-based feature selection (CFS) method (Hall, 1999). The minimum number of features that can be utilized for an effective identification are thus determined. The presented study is outlined as follows: InSection 2, extracting VF from Folio leaf-set, employing AIT and constituting combinations from feature groups are presented, re-spectively. InSection 3, the results for all AIT and various combinations of the VF are given in detail. In Conclusion Section, the contribution of the study is clearly stated by summarizing the results andfindings. 2. Material and methods
2.1. Extracting features data from leaf images
In order to implement the AIT, the feature data matrix is obtained by applying IPT to the Folio image set (Munisami et al., 2015a) as shown inFig. 1. The processes of data matrix acquisition are described step by step in the subsections.
2.2. Leaf-Set
The identification of plant is carried out through leaf-set reported elsewhere (Munisami et al., 2015a) containing 32 kind of plant species each has 20 different pictures. The leaf-set comprising the images of leaves has been taken in broad daylight via a camera with full HD re-solution. The pictures illustrated inFig. 2are taken from the farm of the University of Mauritius and the area around it.
2.3. Image processing technique
Thefirst process of the IPT is to resize all of the leaf images for making them to be the same dimensions (Fig. 3a). Then, the Red, Green and Blue (RGB) levels of each pixel in the images of leaves are defined. These images are then converted to grayscale format as shown in Fig. 3b. The grayscale images are then converted to binary images (black/white) by using Otsu's method (Otsu, 1979). The gray level pixel
values greater than the threshold value are set to 1 (corresponds to white color) and remaining pixel values are set to 0 (corresponds to black color) (Gonzalez and Woods, 2008). In order to remove the small objects from binary image the“bwareaopen” command of the Matlab® software is used. This command removes all connected components (objects) that have fewer than defined pixels from the binary image. Then the “imclose” command is utilized to perform morphological closing on the binary image. The morphological close operation is a dilation followed by an erosion, using the same structuring element for both operations (Raid et al., 2014). As a result of these enhancement processes, the area surrounding the entire structure of the leaf is totally set to 1 (corresponds to white color) and the area outside the leaf is totally set to 0 as illustrated inFig. 3c. Finally, the binary images are reversed as shown inFig. 3d. Thus, all VF of the leaves are obtained from this reversed image.
2.4. Visual feature data acquisition
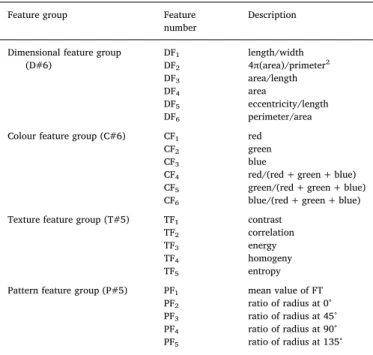
Each leaf’s VF related to dimension, color, texture and pattern are acquired for forming dataset given inTable 1. Dimensions of the leaves (length, width, perimeter and area) are extracted from the reversed binary images. To provide robustness of identifier, some features re-lated to dimensions are reproduced from those parameters in terms of fullness [4π (area)/primeter2], length/width, area/length, and peri-meter/area. Three color features of the leaves are also extracted from RGB values of each pixel. Therefore, the mean RGB levels of leaves are arithmeticallyfigured out according to these pixels. Likewise, 3 features regarding colors are also reproduced as given below,
= + + = + + = + + CF R R G B CF G R G B CF B R G B , , 4 5 6 (1) where R, G and B is the mean values of the Red, Green and Blue colors of the leaves, respectively.
In order to evaluate the colorful image according to its texture features such as contrast, correlation, energy, homogeneity and en-tropy, it need to be converted to gray scale image shown inFig. 3b. Then these texture features of the image can be extracted by means of gray-level co-occurrence matrix (Haralick and Shanmugam, 1973) ob-tained from gray scale image. In order to get pattern features (PF) of the images, the coordinates of leaf’s both edges and centroids are extracted as given inFig. 4a by means of Matlab® software. Then theX andY
axises of each pixel in the boundaries of binary image are detected by utilizing“bwboundaries” command of Matlab (Piramli et al., 2016). The center of the binary image of leaf is obtained by taking mean values of
XandY vectors. Hence the distances from center of the image to the each pixel of boundaries are calculated by using Euclid distance as
given below,
= − + −
Le (Xc X)2 (Yc Y)2 (2)
whereLe is a distance vector of leaf, Xc andYc are the center of
Cartesian coordinates of the binary image as illustrated inFig. 4a. The
angle of each pixel (in the boundary of the leaf) with theX-axisθecan
be found by using the following equation.
= − − − θ tan Y Y X X (| | | |) e c c 1 (3) Therefore, the length and angle values correspond to each pixel are Fig. 2. Plant species of Folio leaf-set (Munisami et al., 2015a).
obtained. To make a standard assessment, the lengths corresponding to each one degree are selected, and so the size ofLevector is reshaped to
360°. The representation of the Le vector in the cylindrical and
Cartesian coordinates are illustrated inFig. 4b and c respectively. To eliminate the orientation differences of the leaf, the distance vector is aligned to set the longest distance value as a starting point (as illu-strated inFig. 4d and e). Since the general patterns of leaves mostly
resemble to each other, effective classification may not be performed by using only the distance vector. However, it is possible to make a more consistent classification by means of the edge properties (flat, threaded, segmented and partly edged) of the leaves. By taking the Fourier transform (FT) of the distance vector, these types of edge properties can be effectively obtained (Fig. 4f). In this study, FT values are exploited as an identification parameter (PF1) by taking mean value of the FT vector.
For another classification parameter, the symmetrical properties of leaves are evaluated. For this purpose, the ratio of the symmetrical distances corresponding to the angles of 0⁰, 45⁰, 90⁰ and 135⁰ are taken into account as a comparator parameters PF2, PF3, PF4 and PF5, re-spectively. Since each value of distance vector corresponds to a degree of distance, the comparator parameter values are obtained by the fol-lowing equation, = = = = PF DV DV PF DV DV PF DV DV PF DV DV (1) (180), (45) (225), (90) (270), (135) (315) 2 3 4 5 (4) where DV is the distance vector and the values in the brackets are the corresponding values of the distance vector. Therefore, a total of 22 different numeric properties are extracted for the VF of a leaf. The AIT performances of these features are discussed in the following section.
2.5. Design of the AIT
In order to perform the automatic identification of the leaves from the images, ANN, NBA, RFA, KNN and SVM techniques are im-plemented to the leave data. All AIT presented in this study are mod-elled by an empirical manner. The models are therefore optimized by essaying an extent candidate set of values and functions. So, the process parameters selected for each AIT are given inTable 2.
ANN is a mathematical system consisting of many process units/ Table 1
The features and dataset reproduced from the leaf images.
Feature group Feature number
Description
Dimensional feature group (D#6) DF1 length/width DF2 4π(area)/primeter2 DF3 area/length DF4 area DF5 eccentricity/length DF6 perimeter/area
Colour feature group (C#6) CF1 red
CF2 green
CF3 blue
CF4 red/(red + green + blue)
CF5 green/(red + green + blue)
CF6 blue/(red + green + blue)
Texture feature group (T#5) TF1 contrast
TF2 correlation
TF3 energy
TF4 homogeny
TF5 entropy
Pattern feature group (P#5) PF1 mean value of FT
PF2 ratio of radius at 0°
PF3 ratio of radius at 45°
PF4 ratio of radius at 90°
PF5 ratio of radius at 135°
Fig. 4. (a) The center and edges of the non-oriented leaf, (b) Distances from origin to edges for non-oriented leaf, (c) 1D distance vector of non-oriented leaf, (d) The edges of the oriented leaf, (e) 1D distance vector of oriented leaf, (f) FT of the oriented leaf in logarithmic scale.
neurons connected with each other in a weighted manner. The process unit receives signals from the other neurons; combines, transforms them and generates a numerical result. In general, the process units are corresponding to the real neurons and are interconnected in a network so that this structure constitutes the ANN. In order to identify the leaves according to the VF, ANN model based on Multi-Layer Perception is designed (Sabanci et al., 2017) as shown inFig. 5.
NBA is an independent feature models which is based on the Bayes theorem. It forecasts different probability clusters according to state values in a given class. The assumption of independence is based on a strong classification of Naïve Bayes. The values of the attributes are independent regardless of other properties of the variable class (Jie and Bo, 2011).
RFA is an effective technique based on the decision tree method. The main idea behind RFA is to try and alleviate problems of decision tree. In RFA, randomness is applied in the training of trees and the output of multiple randomized trees is combined into a single classifier. For this reason, RFA produces lower test errors than traditional decision trees (Schroff et al., 2008).
KNN algorithm is one of the most basic sample-based learning al-gorithms (Ozkan and Murat, 2017). It does not need to use training data points to make any generalizations. The KNN firstly forms a multi-dimensional feature space consisting of initial data. Then the test object can be defined according to the nearest neighbors’ value in this mea-surement space (Yigit, 2018).
SVM is an efficient classifier for the linear and non-linear problems. One of most important factors in the classification problems is to find proper decision surface. A separation hyperplane having the maximum
distance to the nearest points of the training set can be determined with a suitable decision surface. SVM classifier provides good decision hy-perplane by using the kernel functions. The idea of a kernel function is to perform operations in the input space rather than potentially a high-dimensional feature space. For this reason, the internal product need not be evaluated in the feature space. Choosing the right kernel would improve the SVM's raisin classification performance. That’s why, four popular kernel functions which are polynomial, normalized poly-nomial, radial basis and universal Pearson VII are used in this study (Cristianini and Shawe-Taylor, 2000).
2.6. Organization of data sets
To investigate the effect of different VF groups on the classification accuracy, 15 possible combinations of 4 groupsCT are generated
ac-cording the following equation.
= − + − + − + − = C 4! 4! (4 4)! 4! 3! (4 3)! 4! 2! (4 2)! 4! 1! (4 1)! 15 T (5) The organization of the combinations given inTable 3are used as input parameters of the AIT for training and testing. The features of 510 and 127 leaves which are uniformly selected from the total number of 637 leaves are respectively employed to train the models and test the accuracy of the classifiers.
3. Results and discussion
The input data related to the features of the leaves given inTable 3 are utilized in the implemented AIT. The classification results in terms of the accuracy are given inTable 4. The features given inTable 3are used to classify the leaves by 5 different AIT. The results of each technique for 15 possible different combinations and the average values of the 5 techniques are given inTable 4. In the literature, the most commonly used groups of the leaf classification are color, texture and dimension corresponding to Comb_12 feature groups. In Comb_12, the average accuracy result of all AIT obtained using these three groups is found as %83.3. It is also evident that the most accurate result for Comb_12 is achieved as %85.83 by SVM.
To investigate the effects of pattern characteristics on classification, the pattern group given inTable 3is also added to these three groups. Thus the Comb_1 containing 22 features is resulted with an average accuracy of 88.66%. Among the 5 AIT, SVM is the most successful classifier for all group combinations and its average success rate is found 72.02% as seen inTable 4. The best result of SVM is obtained for Comb_1 with the accuracy of 92.91%. On the other hand, the worst Table 2
Parameters in setting the AIT.
Models Parameters Set type/value
ANN Epochs 500
Learning rate 0.3 Momentum parameter 0.2
Learning algorithm Levenberg–Marquardt Hidden layer 1
SVM Kernel function Radial Basis Kernel function coefficient 1.0 Slack variable coefficient (C) 100,000 KNN Distance function Euclidean Distance
K neighborhood number 1 RFA Number of trees 100
Number of execution slots 1 NBA Number of decimal places 2
Fig. 5. The ANN model for classification of the leaves.
Table 3
Various combinations of VF groups.
Group combination
Combination Number of VF
Dimension Colour Texture Pattern
C(4,4) Comb_1 22 D#6 C#6 T#5 P#5 C(4,1) Comb_2 6 D#6 – – – Comb_3 6 – C#6 – – Comb_4 5 – – T#5 – Comb_5 5 – – – P#5 C(4,2) Comb_6 11 – C#6 T#5 – Comb_7 12 D#6 C#6 – – Comb_8 11 D#6 – T#5 – Comb_9 11 D#6 – – P#5 Comb_10 11 – C#6 – P#5 Comb_11 10 – – T#5 P#5 C(4,3) Comb_12 17 D#6 C#6 T#5 – Comb_13 17 D#6 C#6 – P#5 Comb_14 16 D#6 – T#5 P#5 Comb_15 16 – C#6 T#5 P#5
accuracy is obtained with Comb_3 related to color features. While the most successful combination including single group is the D#6 with the accuracy of 53.23%, Comb_7 and Comb_12 which include D#6 are the other most successful groups in double and triple combinations re-spectively as seen inTable 4. These results show that the D#6 group which contains dimension features is the most dominant group at the leave classification. Since theTable 4presents the accuracy rates of all groups of different combinations with 5 AIT, it provides the most ap-propriate technique and combinations according to the requirements.
The influence of each feature on the classification accuracy is a significant question, as well. The most important issue in the classifi-cation process is to get highest accuracy by using minimum number of the features. There are many attribute evaluation algorithms in the literature such as chi-square, gain-ratio, information-gain, relief, sym-metrical uncertainty, principal component analysis and CFS algorithm (Hall, 1999). These algorithms commonly appraise the attributes of a groups by selecting the highly correlated features with the results. In this study, CFS algorithm is preferred for feature selection because it gives not only the most correlated features but also achieves more sa-tisfactory results over the classification.
3.1. CFS algorithm
The CFS algorithm is an efficient method used for machine learning applications. Thanks to the CFS, features with low or negative impact on classification can be eliminated. CFS is a simple algorithm that sorts the features subclasses according to the correlation-based heuristic evaluation function (Hall, 1999). The bias of the evaluation function includes the subsets including the features that are uncorrelated with each other and highly correlated with feature-class. Thus the highest-valued output of each feature combination (single, double, triple, etc.) is selected to form the next combination (Hall, 1999). This process continues up to all features are included in the Feature Evaluation function shown inFig. 6.
The feature subset evaluation function of the CFS is given below.
= + − V nr n n n r ¯ ( 1) ¯ s cf ff (6)
whereVs is the heuristic merit of the feature subset which contains n
features.r¯cf is the average value of the feature-class correlation andr¯ff
is the mean value of the feature-feature correlation (Hall, 1999). The implementation of CFS can be chosen by three way: Forward selection, backward elimination, and bestfirst. Forward selection begins with no
features and one by one adds one feature at a time until no possible single feature addition resulting in a higher evaluation. Forward se-lection starts with no feature and adds one property at each time, until no possible single feature persists. The following methodology can be applied to perform forward selection CFS algorithm:
1. Forn=1, take a feature and calculate thercf¯ andr¯ff
2. Find theVs values for each feature and choose the feature
corre-sponding to heightsVsvalue,
3. For =n 2, take the selected feature in the previous step and in turn, calculate theVsvalues for double combinations with other features.
Then select the double feature combination corresponding to heightsVsvalue,
4. For =n 3, take the selected feature combination in the previous step and calculateVs values for an increased combinations with other
features. Then select an increased feature combination corre-sponding to heightsVsvalue,
5. Continue to the processes until all features are used and select the combination that gives the highestVsvalue among the all results.
In this way, CFS algorithm evaluates the effect of each feature of a dataset on the classification and selects the best feature combination among all possible combination. Therefore, the best combination in-cluding 16 most effective features on the identification from 22 features are successfully selected by means of CFS algorithm.
3.2. Gain ratio attribution
Among the 22, 16 features that improve classification performance are identified by means of CFS algorithm. In order to find out the percentage effect of the selected 16 features on the results, the gain ratio attribute (Karegowda et al., 2010) can be exploited. The brief formulation of gain ratio can be described as follows. In case the data setD, consisting ofddata samples, occurs with h distinct class, the expected information (EI) is given by,
∑
= − ⎛ ⎝ ⎞ ⎠ = EI D d dlog d d ( ) i h i i 1 2 (7) whered di is the probability that belongs to class S
i. Let, featureFhas x
different values and subset Dj includes dij samples. So the
en-tropyEnt F( )is given by,
∑
= + + ⋯ = Ent F EI D d d d d ( ) ( ) i h i i hi 1 1 2 (8) and the gain G F( )is defined by the following equation.= −
G F( ) EI D( ) Ent F( ) (9)
In order tofind the ratio of any feature, the split information for D (SI DF( )) is given by,
∑
= ⎛ ⎝ ⎞ ⎠ ⎛ ⎝ ⎞ ⎠ = SI D D D log D D ( ) | | | | 2 | | | | F i x i i 1 (10)Eq.(10)represents the information obtained by dividing the set of training dataDinto x sections corresponding to the x results of a test on the featureF. Thus, gain ratio GR F( )can be expressed by the following equation. = GR F G F SI D ( ) ( ) ( ) F (11)
Thus the gain ratios of 16 features are obtained by using Eq.(11) and the results are given to theTable 5.
As seen fromTable 5, DF3, DF6, CF3, CF5, TF2and TF3features are eliminated after applying of CFS algorithm. As a result, the effect rates of the remaining features have changed. When theTable 3is examined, the color group has the lowest influence on classification performance. Table 4
The accuracy of classification results of AIT.
Group combinations
Combinations Accuracy (%)
ANN NBA RFA KNN SVM Average Value C(4,4) Comb_1 90.55 86.61 88.19 85.04 92.91 88.66 C(4,1) Comb_2 58.27 44.88 49.61 51.97 61.42 53.23 Comb_3 40.94 40.94 41.73 38.58 41.73 40.79 Comb_4 54.33 40.94 47.24 52.76 53.54 49.76 Comb_5 42.52 50.39 48.82 39.37 43.31 44.88 C(4,2) Comb_6 71.65 61.42 64.57 65.35 72.44 67.09 Comb_7 77.95 73.23 77.17 73.23 80.32 76.38 Comb_8 79.53 63.78 72.44 70.08 83.46 73.86 Comb_9 68.50 65.35 70.08 66.14 69.29 67.87 Comb_10 64.57 74.02 74.80 68.50 66.14 69.61 Comb_11 72.44 66.93 68.50 61.42 73.23 68.50 C(4,3) Comb_12 84.25 79.53 83.46 83.46 85.83 83.31 Comb_13 86.61 81.10 86.61 77.17 87.40 83.78 Comb_14 80.32 74.80 83.46 74.02 84.25 79.37 Comb_15 80.32 81.10 83.46 74.80 85.04 80.94 Average accuracy 70.18 65.67 69.34 65.46 72.02
However, after applying CFS algorithm, it is seen fromTable 5that the new color group has a higher influence than the new texture group. These results indicate that CFS technique changes the effects of features on the classification performance. Although some features of color, texture and dimension groups are selected as a result of CFS, the se-lection of all features of the pattern group shows the influence of pat-tern features. Since the FT evaluates the edge properties of the leaf, it provides superiority in classification. As shown inTable 5, among the 16 selected features, the most effective feature on the classification is the PF1in the pattern group. If the values inTable 5are examined, it is seen that although the most effective group on the classification per-formance is the dimension group, the effect rate of the pattern group is very close to dimension group. Therefore, the accuracy of classification has been considerably increased with the support of pattern group.
After the most effective features are found out, their performance on classification by AIT are evaluated and the results are compared with the results of Comb_1 given in Table 3. As seen from Table 6, the classification in which 16 features are used yields higher accuracy than the 22-featured implementation for all AIT. In both cases, the most successful technique seems to be SVM. Thanks to CFS, 1.58% higher accuracy is achieved by using 27% less number of features. These re-sults put forward that choosing the effective features is more important than using of many features in the classification process.
3.3. The performance of the AIT on diseased and defected leaf classification Table 6gives the results of completely healthy leaves including both young and mature leaves. However, classification performance of the above-mentioned methods on the diseased and defected (DD) leaves are also curious topic. For this reason, a new data set containing a total number of 33 DD leaves are constituted and shown inFig. 7. To test the performance of the AIT, 16 features obtained fromSection 3.1are used for 3 different data sets. In the first data set, 637 healthy leaves are used for training and 15 of the 33 DD leaves are randomly chosen for testing. As seen fromTable 7, since there are no DD leaves in the training data, effective classification cannot be done. In the second data set, 18 of the 33 DD leaves are added to 637 healthy leaves and the total number of 655 leaves are employed for the training and the remaining 15 DD leaves are utilized for the testing. Thus, for the test data consisting only DD leaves, SVM achieves the best classification accuracy by 86.67% as seen fromTable 7. For the third data set, 637 health and 33 DD leaves are put together. Then randomly selected 536 leaves corresponding to 80% of all leaves are used for training and the remaining 134 leaves are used for testing. The results for different AIT are shown inTable 7that SVM classifies the leaves with accuracy of 92.53%. When theTable 6 (selected data) andTable 7(data set 3) are compared with each other, it is seen that the accuracy decreased by 2%. The main reason of this consequence is the non-uniform distribution of the healthy and DD leaves. It can be concluded that, if it is desired to make most accurate classification on leaves, it is necessary to use a data set in which all leaf types (such as, young, mature, healthy, diseased and defected) should have uniform distribution.
4. Conclusion
In this study, the effects of different AIT and VF on the automatic leaf classification are investigated. For this goal, ANN, NBA, RFA, KNN and SVM algorithms have been implemented to Folio leaf-set. 22 dif-ferent VF are evaluated in 4 different groups of color, texture, dimen-sion and pattern as visual parameters. The edge FT technique is Fig. 6. Correlation Based Feature Selectin Algorithm.
Table 5
The percentage effects of the selected features in the classification.
Visual data Input Effects on the results (%)
Effect rate of the groups on the results (%) Dimension DF1 7.53 29.99 DF2 7.11 DF4 7.70 DF5 7.65 Colour CF1 6.67 24.44 CF2 5.76 CF4 6.28 CF6 5.73 Texture TF1 5.42 16.40 TF4 4.95 TF5 6.03 Pattern PF1 7.73 29.17 PF2 4.80 PF3 5.01 PF4 6.23 PF5 5.40 Table 6
Comparison of the classification accuracy of tested AIT for Comb_1.
Input Number of features Accuracy (%)
ANN NBA RFA KNN SVM Comb_1 22 90.55 86.61 88.19 85.04 92.91 Selected Data 16 92.13 89.76 88.19 88.16 94.49 Processing time (s) 5.78 0.03 0.36 0.02 0.84
developed to effectively define the edge properties of the leaf in the pattern group. 637 different images of 32 leaf species are processed with IPT and 22 VF are acquired from each leaf. 510 records belonging to the leaves are used as training data and 127 records are considered as test data. In order to evaluate the classification performance of different groups, 15 possible different combinations of 4 various feature groups are generated and the accuracies of all combinations are presented. It has been proven that the groups with pattern features produce higher accuracy. The CFS algorithm is utilized to select the most effective features among the 22 features and the 16 most effective features are determined. Thus the effects of 16 selected features on the classification performance have changed. In order tofind out the percentage effect of the selected features on the results, the gain ratio attribute is presented and PF1is found to be the most effective feature. SVM come out as the most successful technique among AIT in all tests. While the success rate of KNN technique in their own Folio leaf-set was obtained as 87.2% accuracy; in this study, the success rate is achieved as 88.6% by KNN technique and 94.2% by SVM technique. Thanks to the proposed edge FT feature and implemented CFS algorithm, the automatic leaf classi-fication accuracy is considerably increased. It is also demonstrated that SVM technique is more successful than KNN at leaf identification. In case the processing times of AIT are observed, it seen that KNN is the fastest technique. Although ANN yields close results to SVM, it seems that the processing speed is approximately 7 times longer than SVM. That’s why, the use of ANN is not seem feasible in practice. In this study, which examines the effects of VF on classification performance, the preliminary results of DD leaves detection are also given. It is concluded from the test results, when it is desired to make most accu-rate classification on leaves, it is necessary to use a data set in which all leaf types (such as, young, mature, healthy, diseased and defected) have uniform distribution.
Appendix A. Supplementary material
Supplementary data to this article can be found online athttps:// doi.org/10.1016/j.compag.2018.11.036.
References
Arun, C., Durairaj, D.C., 2017. Identifying medicinal plant leaves using textures and optimal colour spaces channel. J. Ilmu. Komputer dan Informasi 10, 19–28.https://
doi.org/10.21609/jiki.v10i1.405.
Bakhshipour, A., Jafari, A., 2018. Evaluation of support vector machine and artificial neural networks in weed detection using shape features. Comput. Electron. Agr. 145, 153–160.https://doi.org/10.1016/j.compag.2017.12.032.
Beghin, T., Cope, J.S., Remagnino, P., Barman, S., 2010. Shape and texture based plant leaf classification. In: International Conference on Advanced Concepts for Intelligent
Vision Systems. Springer, pp. 345–353.
Cristianini, N., Shawe-Taylor, J., 2000. An Introduction to Support Vector Machines and
Other Kernel-based Learning Methods. Cambridge University Press.
Gonzalez, R.C., Woods, R.E., 2008. Digital Image Processing. Pearson/Prentice Hall.
Grinblat, G.L., Uzal, L.C., Larese, M.G., Granitto, P.M., 2016. Deep learning for plant identification using vein morphological patterns. Comput. Electron Agr. 127, 418–424.https://doi.org/10.1016/j.compag.2016.07.003.
Hall, M.A., 1999. Correlation-based feature selection for machine learning. Haralick, R.M., Shanmugam, K., 1973. Textural features for image classification. IEEE
Trans. Syst. Man Cybernet. 610–621.https://doi.org/10.1109/TSMC.1973.4309314. Hu, R., Jia, W., Ling, H., Huang, D., 2012. Multiscale distance matrix for fast plant leaf recognition. IEEE Trans. Image Process. 21, 4667–4672.https://doi.org/10.1109/
TIP.2012.2207391.
Jie, L., Bo, S., 2011. Naive Bayesian classifier based on genetic simulated annealing al-gorithm. Procedia Eng. 23, 504–509.https://doi.org/10.1016/j.proeng.2011.11.
2538.
Kadir, A., Nugroho, L.E., Susanto, A., Santosa, P.I., 2013. Leaf classification using shape, color, and texture features. arXiv preprint arXiv:1401.4447.
Karegowda, A.G., Manjunath, A., Jayaram, M., 2010. Comparative study of attribute selection using gain ratio and correlation based feature selection. Int. J. Info. Technol.
Knowledge Manage. 2, 271–277.
Kazmi, W., Garcia-Ruiz, F., Nielsen, J., Rasmussen, J., Andersen, H.J., 2015. Exploiting affine invariant regions and leaf edge shapes for weed detection. Comput Electron Agr 118, 290–299.https://doi.org/10.1016/j.compag.2015.08.023.
Kumar, N., Belhumeur, P.N., Biswas, A., Jacobs, D.W., Kress, W.J., Lopez, I.C., Soares, J.V.B., 2012. Leafsnap: A Computer Vision System for Automatic Plant Species
Identification. Springer Berlin Heidelberg, Berlin, Heidelberg, pp. 502–516.
Laga, H., Kurtek, S., Srivastava, A., Golzarian, M., Miklavcic, S.J., 2012. A riemannian elastic metric for shape-based plant leaf classification. In: Digital Image Computing
Techniques and Applications (DICTA). International Conference on. IEEE, pp. 1–7.
Munisami, T., Ramsurn, M., Kishnah, S., Pudaruth, S., 2015a, Folio Data Set UCI Machine Learning Repository <https://archive.ics.uci.edu/ml/datasets/Folio> .
Munisami, T., Ramsurn, M., Kishnah, S., Pudaruth, S., 2015. Plant leaf recognition using shape features and colour histogram with K-nearest neighbour classifiers. Procedia Comp. Sci. 58, 740–747.https://doi.org/10.1016/j.procs.2015.08.095.
Otsu, N., 1979. A threshold selection method from gray-level histograms. IEEE Trans. Syst. Man Cybernet. 9, 62–66.https://doi.org/10.1109/TSMC.1979.4310076. Ozkan, I.A., Murat, K., 2017. Skin lesion classification using machine learning algorithms.
Fig. 7. Diseased and defected leaf data set.
Table 7
Comparison of classification accuracy of tested AIT for DD leaves.
Data Sets # Training data # Test data Accuracy (%)
ANN NBA RFA KNN SVM Data set 1 637 15 33.33 20.00 33.33 26.67 46.67 Data set 2 655 15 80.00 60.00 73.33 73.33 86.67 Data set 3 536 134 91.04 85.07 86.57 86.57 92.53
Int. J. Intelligent Syst. Appl. Eng. 5, 285–289.https://doi.org/10.18201/ijisae.
2017534420.
Pawara, P., Okafor, E., Schomaker, L., Wiering, M., 2017. Data Augmentation for plant classification, international conference on advanced concepts for intelligent vision
systems. Springer, pp. 615–626.
Piramli, M.M., Rahman, A.F.N.A., Abdullah, S.F., 2016. Rice Grain grading classification based on perimeter using moore-neighbor tracing method. J. Telecommun. Electronic
Comput. Eng. (JTEC) 8 (2), 23–27.
Raid, A.M., Khedr, W.M., El-Dosuky, M.A., Aoud, M., 2014. Image restoration based on morphological operations. Int. J. Comput. Sci. Eng. Info. Technol. (IJCSEIT) 4 (3),
9–21.
Sabanci, K., Kayabasi, A., Toktas, A., 2017. Computer vision-based method for classifi-cation of wheat grains using artificial neural network. J. Sci. Food Agri. 97,
2588–2593.
Schroff, F., Criminisi, A., Zisserman, A., 2008. Object class segmentation using random
forests. BMVC 1–10.
Sladojevic, S., Arsenovic, M., Anderla, A., Culibrk, D., Stefanovic, D., 2016. Deep neural networks based recognition of plant diseases by leaf image classification. Computat. Intelligence Neurosci. 2016.https://doi.org/10.1155/2016/3289801.
Sulc, M., Matas, J., 2014. Texture-based leaf identification. In: European Conference on
Computer Vision. Springer, pp. 185–200.
Yasar, A., Saritas, I., Sahman, M.A., Dundar, A.O., 2015. Classification of leaf type using artificial neural networks. Int. J. Intelligent Syst. Appl. Eng. 3, 136–139.https://doi.
org/10.18201/ijisae.49279.
Yigit, E., 2018. Operating frequency estimation of slot antenna by using adapted kNN algorithm. Int. J. Intelligent Syst. Appl. Eng. 6, 4.https://doi.org/10.18201/ijisae.
2018637927.
Zhao, C., Chan, S.S., Cham, W.-K., Chu, L., 2015. Plant identification using leaf shapes—A pattern counting approach. Pattern Recognition 48, 3203–3215.https://doi.org/10.