T.C.
ISTANBUL AYDIN UNIVERSITY
INSTITUTE OF SOCIAL SCIENCES
MARKET ANALYSIS AND FORECASTING OF OIL
AND GAS (LUBRICANT) MANAGEMENT IN NIGERIA:
A CASE STUDY OF GRAND PETROLEUM
Thesis
Helix Osabuohien AIDEYAN
DEPARTMENT OF BUSINESS
BUSINESS MANAGEMENT PROGRAM
THESIS ADVISOR: Yrd. Doç. Dr. NIMA MIRZAEI
T.C.
ISTANBUL AYDIN UNIVERSITY
INSTITUTE OF SOCIAL SCIENCES
MARKET ANALYSIS AND FORECASTING OF OIL AND GAS
(LUBRICANT) MANAGEMENT IN NIGERIA:
A CASE STUDY OF GRAND PETROLEUM
Thesis
Helix Osabuohien AIDEYAN
(Y1212.130033)
DEPARTMENT OF BUSINESS
BUSINESS MANAGEMENT PROGRAM
THESIS ADVISOR: Yrd. Doç. Dr. NİMA MIRZAEI
ii
FOREWARD
Firstly, I would like to express my sincere gratitude to my hard working and humble supervisor, Assistant Professor Nima Mirzaei, of Istanbul Aydin University, Turkey, for making himself available despite his tight schedule and family engagement; he was always there for me whenever I needed his assistance from the very beginning to the end. Without his guidance and encouragement, I would not have been able to complete this thesis at this high level.
I want to thank my parents for their overwhelming support through prayers, words of encouragement, love and financially commitment, without them I would not have being where I am today. I want to also thank my brothers and sisters back home and abroad for their financial and moral support, I really appreciate you all.
My special thanks also goes to the Dean of Social Sciences and all the staffs of the department for their kind gesture and understanding, you all made my stay in Istanbul Aydin University a pleasurable one.
I want to also specifically thank the following people for their love and support during my course of study here in Istanbul, Professor Akin Marsap of Istanbul Aydin University, Turkey, Dr. Cigdem Ozari of Istanbul Aydin University, Engineer Osagie O. Emmanuel , M.D of ABZ Oil &Gas Limited, Nigeria for his support and words of encouragement, Pastor Morgan Ejakhaegbe, Mr. Friday Enoma Aideyan, Late Pastor Rephael Izevbokun, Pastor Osagie Oghamomwan, Pastor Sardius , Mr. Akinfortire Olubiyi Yeba, Mr. Serkan Sapmazturk of Erasmus Office, Istanbul Aydin University, Mr & Mrs Omeiza, Mr. Charles Omoregbe, Mrs Omeadi Cordilia Shimbura, and all my friends and well wishes in Turkey and other parts of the world.
iv
TABLE OF CONTENTS
Page
TABLE OF CONTENT………..iv
LIST OF TABLES ……….vi
LIST OF FIGURES ………...vii
ÖZET ………...viii
ABSTRACT ………...ix
1.INTRODUCTION ………..………..1
2.LITERATURE REVIEW ………..……….4
2.1 Functional Fluids and Additives ………..4
2.2 Polytetrafluoroethylene ……….…...4
2.3 Oil Preparation of Suspension with Polytetrafluoroethylene …………...…....5
2.4 Purification of Lube Oil.……….…...6
2.4.1 New sampling lubricants meet new challenges ………...7
2.5 Synthetics Role ………9
2.6 Oil-Based Emulsions and Neat Oils for Coated Steels ………....9
2.7 Prevention of Puddling by Tight Nestling, And Others ………...10
2.8 Forecasting………..10
2.9 Techniques For Forecasting Demand ………11
2.10 Forecasting Methods for Supply And Demand Chain Management ……….13
2.11 Synopses’ on Decomposition……….….14
2.12 Overview of Decomposition………...15
2.13 The Decomposition Procedure………16
2.14 Extrapolating the Error Component………17
2.15 Sales Forecasting………....17
3. MARKET ANALYSIS……...………...19
3.1 World Lubricant Demand-Analysis by Product………...20
4.PRODUCTION PROCESS AND PRODUCTS ………..………...22
4.1 Products and Quality Control ………...………..22
4.2 Professionals Management of Lubrication……….22
4.3 Job Description………...23
4.4 Lubrication………...24
4.4.1 Lubrication application………...24
4.4.2 The process of manufacturing………..…..25
4.4.3 Handling and storage of lubricant………...26
4.5 Important of Formulation………...….27
4.6 Incompatibility of Lubricant....……….…..28
4.7 Different Ways to Avoid Mixtures of Lubricant………29
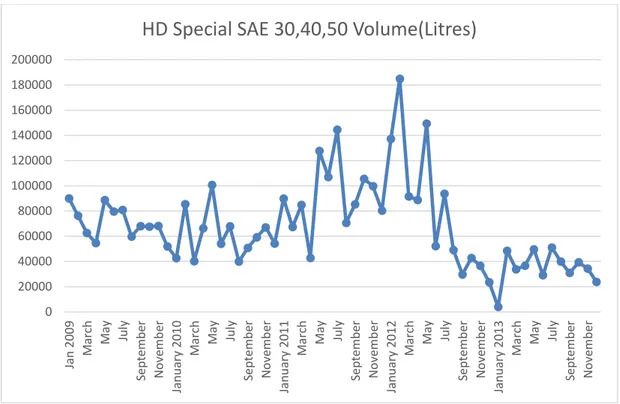
4.9 Heavy Duty (HD) Special, SAE 30, SAE 40, SAE 50
and Market Applications……….…….30
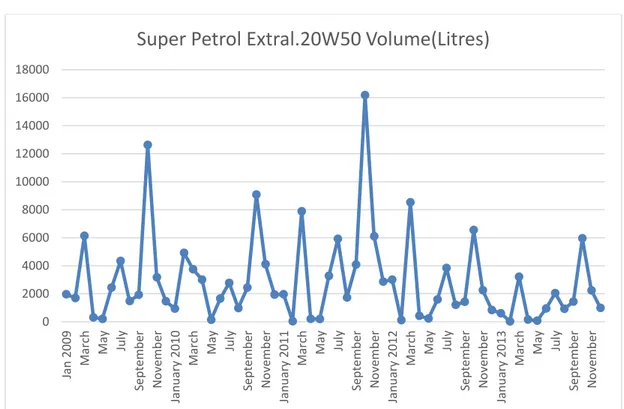
4.10 Deusol Super Extra | SAE 15W/40, API-CH4 & Market Applications……...31
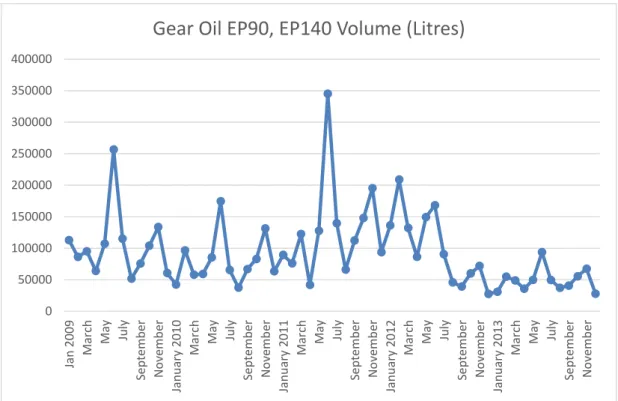
4.11 Gear Oil Extreme Pressure (EP) 90, 140 and Market Applications.………...31
4.12 Product Data: Hydrex Anti- Wear (AW), 32, 46, 68, 100 and Market Applications...31
4.13 Quality Control ……….………..31
4.13.1 How to test for lubricant ……….….32
4.13.2 Spectroscopy….……….………...32
4.13.3 Index of viscosity………..………32
4.13.4 Analysis of used lubricant….………...33
5.COMPETITIVE ADVANTAGE ………...………34
5.1 Competing Through Differentiation ………..…………..35
5.2 Competing Through Cost ………...………..36
5.3 Competing Through Response ………...……. 37
5.4 Involving Strategy in Management ………...…...37
5.4.1 Environmental scanning ………...….37
5.4.2 Strategy formulation ………...38
5.4.3 Implementation of strategy ………...38
5.4.4 Control and evaluation ………..38
6.FORECASTING ……….………39
6.1 Classification of Forecasting ………....39
6.2 Series of Time Forecasting ………...40
6.3 Methodology ………...….40
6.3.1 Exponential smoothing ………..…………...41
6.3.2 Adaptive filtering ………...…………...42
6.3.3 Box-Jenkins method of forecasting ………..………....42
6.3.4 Classical decomposition ………..………….43 6.4 Interpretation of Results ………..………43 6.4.1 Product 1 ………..………….43 6.4.2 Product 2 ………..………….44 6.4.3 Product 3 ………..………….45 6.4.4 Product 4 ………..…….46 6.4.5 Product 5 ………..……….46
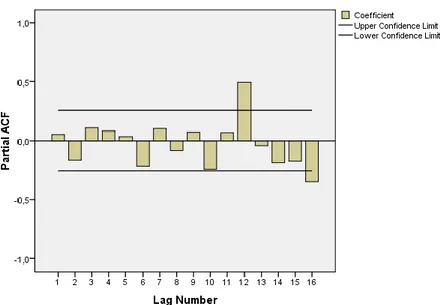
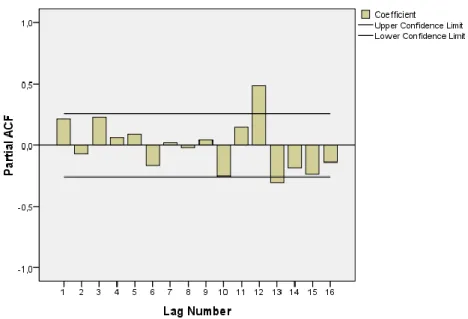
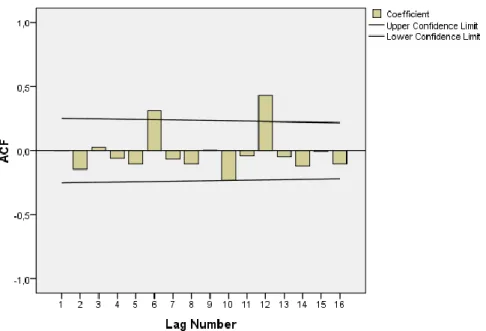
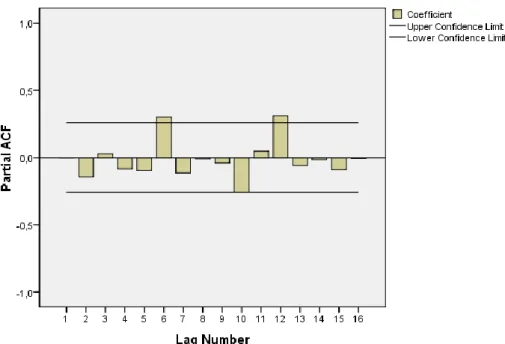
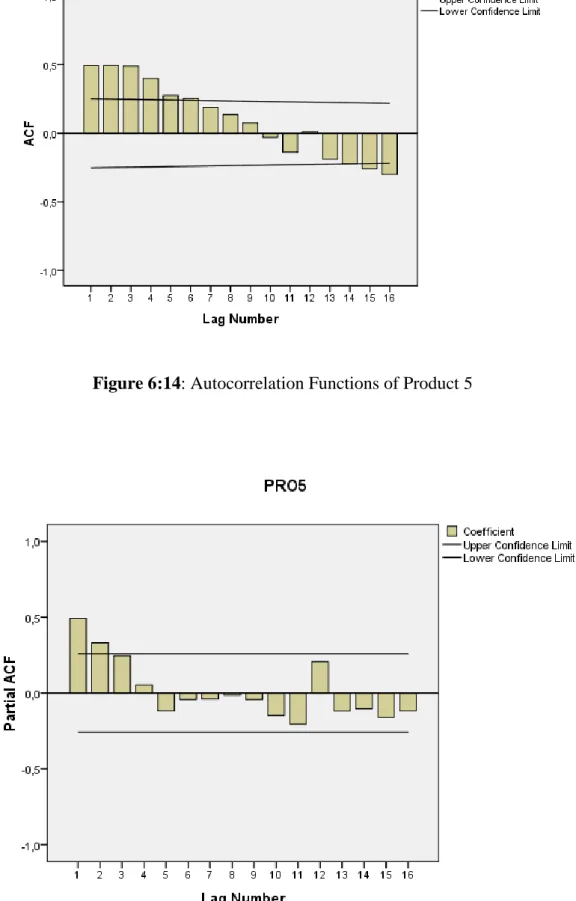
6.5 Autocorrelation Function (CAF) and Partial Autocorrelation Function (PACF) ………...…….47
6.6 Periodogram and Spectral Density ………...……....55
6.6.1 Periodogram and spectral density for all products ………55
6.7 Forecasting………...…..64
7.CONCLUSION ………..……….………67
REFERENCES ………...69
APPENDIX ……….……76
vi
LIST OF TABLES
Page
LIST OF FIGURES
Page
Figure 6.1: Graph for Product 1 Data………... 43
Figure 6.2: Graph for Product 2 Data………... 44
Figure 6.3: Graph for Product 3 Data………... 45
Figure 6.4: Graph for Product 4 Data………... 46
Figure 6.5: Graph for Product 5 Data………... 47
Figure 6.6: Autocorrelation for Product 1 by Frequency………. 48
Figure 6.7: Partial Autocorrelation for Product 1 by Frequency……….. 49
Figure 6.8: Autocorrelation for Product 2 by Frequency……….… 49
Figure 6.9: Partial Autocorrelation for Product 2 by Frequency……….…. 50
Figure 6.10: Autocorrelation for Product 3 by Frequency………..….….... 51
Figure 6.11: Partial Autocorrelation for Product 3 by Frequency………...…..……52
Figure 6.12: Autocorrelation for Product 4 by Frequency……….……….….. 52
Figure 6.13: Partial Autocorrelation for Product 4 by Frequency……….…... 53
Figure 6.14: Autocorrelation for Product 5 by Frequency…….……….…….. 54
Figure 6.15: Partial Autocorrelation for Product5 by Frequency………….……… 54
Figure 6.16: Periodogram for Product1 by Frequency……….……… 55
Figure 6.17: Spectral Density for Product1 by Frequency….………..…..……….. 56
Figure 6.18: Periodogram for Product2 by Frequency……….……… 57
Figure 6.19: Spectral Density for Product2 by Frequency….……….…….. 58
Figure 6.20: Periodogram for Product3 by Frequency……….……… 59
Figure 6.21: Spectral Density for Product3 by Frequency……...………..….. 60
Figure 6.22: Periodogram for Product 4 by Frequency…………...…………..…... 61
Figure 6.23: Spectral Density for Product4 by Frequency…………...……..…….. 62
Figure 6.24: Periodogram for Product 5 by Frequency...…………..………... 63
Figure 6.25: Spectral Density for Product5 by Frequency……...…..……….. 64
viii
NİJERYA PAZAR ANALİZİ VE PETROL VE GAZ (YAĞ) YÖNETİMİ ANALİZİ :
ZEMİN PETROL ÇALIŞMASI
ÖZET
Bu tez iki ana bölümden oluşur; İlk bölüm yağlayıcı ürünleri üretim analizi ve ikincisi gelecekte üretim hızını tahmin etmek güncel verileri kullanmaktır.
İlk bölümde, Zemin Nijerya Petrölünün farklı ürünleri tanıtıldı. Bundan başkada, üretim süreçleri, ürün özellikleri ve kalite kontrol teknikleri tartışıldı.
Tahmin bölümünde, SPSS yazılımı seçilen beş ürünlerin üretim oranını tahmin etmek için kullanılır . Mümkün sonuçlara baktığımızda üretim ve ürün talebinde bir artış var.
MARKET ANALYSIS AND FORECASTING OF OIL AND GAS (LUBRICANT) MANAGEMENT IN NIGERIA: A CASE STUDY OF GROUND PETROLEUM LIMITED
ABSTRACT
This thesis has two main parts; the first part is the production market analysis of lubricant products and the second one is to use actual data to forecast the future production rate.
In the first section, different products of Ground Petroleum Nigeria Limited are introduced. In addition, production processes, product characteristics and quality control techniques are discussed.
In the forecasting part, SPSS software is used to predict the production rate of selected five products for 2014. Based on the results it is possible to conclude that, there is an increase in production and product demand.
1. INTRODUCTION
Grand Petroleum Limited is the sole manufacturer of Hi-Speed range of lubricants. These serve automotive, industrial, marine, machinery, and specialty uses. The Hi-Speed range has being approved by the Nigeria Standards Organization as part of the Mandatory Conformity Assessment (MANCAP). The Company is aggressively engaged in the manufacturing and Sale of Lubricating Oils, sole manufacturing and marketing of the Hi-Speed range of lubricants, toll blending arrangements, engine oils, hydraulic oils, automobile fuels and lubrication, industrial fuel and lubrication and other specialty oils. The Company is involved in different energy trading and it is audaciously registering its influence on the downstream sector of the economy of Nigeria and West Africa as well. It has strong international alliances with some of the world’s recognized names in the business of petroleum and state of the art facilities like a 30,000 metric tons (MT) tank farm in the Calabar. Export Processing Zone and a 25,000 metric tons (MT) lubricant plant in Lagos Nigeria and among others.
The future market of lubricants in Nigeria look promising especially for the five products considered in this thesis. There will be increase in demand for these products as long as the standard and necessary evolving changes in technologies are kept and adhered to. There seems to be some newly introduced additives like polytetrafluoroethylene (PTFE), which has being scientifically proven to remarkably increase the load bearing of lubricant oils and also has the ability to reduce wear friction. The continuous damage in the advances of technology equipment and increase in demands are the major reasons for the advancement of different additive to meet the present and future needs and also the utilization of their efficiencies.
The production of lubricants oils begins by the formulation of products by the Chemist in order for it’s to meet the specific needs of the engines or the machines it’s made to serve. These formulations are sent to the production manager who will finally carry out the production according to the specified formulation by the
Chemist. The main consideration during products formulations are the viscosity, pour point, flash point, foam test, total base number , the relative density and the cost of the mineral oils to be use for the productions. The products samples are taken for test in the laboratory by the Chemist and quality assurance officer to make sure it complied with the specified standard of the regulatory bodies before passing the products finally for packaging and distribution to the consumers through their distributives outlet. Most lubricants Companies are managed most at times by professionals’ lubricant managers who oversee the entire production processes and also make sure that the products are of standards by reducing cost of production without reducing products qualities.
One of the main goal of this study is forecasting. Forecasting demand which is the process of obtaining correct picture of how the future demand will look like. Survey method can also be used for products that have no historical records but products with historical records, statistical method are used to project the future. Forecasting is directly proportional to mean absolute percentage error because an increase in mean absolute percentage error, will leads to the inaccuracy of any forecasting value. Forecasting methods are determined by the nature of product data, if the data to be forecasted is used to plot graph, the nature of the graph will determines the method to be used. Another determining factor of forecasting method is the used of expert modeler. When the data are computed into SPSS Statistical Software, it automatically shows the forecasting methods that will be more appropriate for it. The accuracy of the forecasted values can be evaluated by using different forecasting error evaluation. The one with the lowest values of error are more appropriate. Forecasting can also be used to evaluate the market analysis of products by using autocorrelation functions and partial autocorrelation functions which gives details of the product production rate, whether it is increasing or decreasing. Because production is directly proportional to demand, an increase in production will signify an increase in demand and decrease in production will also indicates a decrease in demand.
At the beginning of this thesis in Chapter two, we focus on the literature review of different aspects of lubricants production like functional fluids and additives, how to
improve lubricants by the use of polytetrafluoroethylene, oil preparation of suspension with polytetrafluoroethylene, purification of lube oil, new sampling lubricants meet new challenges, synthetics role, oil-based emusions and neat oils for coated steels, prevention of puddling by tight nestling and others and forecasting techniques. The third chapter is market analysis, which help us to choose the most demandable products for future forecasting. In the fourth chapter, it will focus on the detail production process of the selected products and how its functions, its market application, chemical and physical characteristics, level of performance, and quality control. Chapter five will focus on the competitive advantage through product differentiation, cost and response, involving strategy in management through environmental scanning, strategy formulation and implementation and control and evaluation. Chapter six will focus on forecasting and using forecasting to analyze the rate of production of the selected products and market demand. Finally Chapter seven is about results discussion and concluding remarks.
2. LITERATURE REVIEW
2.1 Functional Fluids and Additives
Because of the vapour pressure marginal and the immflammability nature of ionic liquids which are substances of interest in technology for the lubricant. Furthermore, many ionic liquids have very good tribological and rheological characteristics, very good heat and chemical reliability and very good surface tension. The rate of cavitations occurrence in ionic liquids is very low compare to other substances. Corrosion can be inhibited by many ionic liquids. An ionic liquid has the ability to reduce friction between two or more surface in contact and also to reduce the wearing of the surfaces (Dr. Maria T., 2012)
The performance of lubricants oils can be estimated by its viscosity and the rate of sliding. The cation and anion of ionic liquids determines it efficiency. The tribological efficiency of ionic liquids is increase by the based-phosphorium and substituent’s of alky group with long chain. But many substituents of long alkyl group reduce the heat resistant of the ionic liquids .For general comparism, hydrophobic ionic liquids have better performance of tribology than hydrophilic ionic liquids. Extreme temperature applications or high vacuum are better usage for ionic liquids. Wear and friction is reduce by lubricating an engine piston ring with a flat in comparism with diesel engine oil (15W40) (Dr. Maria T., 2012).
2.2 Polytetrafluoroethylene
This is a solid lubricant and a good working polymer of engineering. PTFE can remarkably increase the load bearing of lubricant oil and also has the ability to reduce wear and friction. Their performance is directly proportional to their size and concentration, that is, the smaller and the more concentrated it is, the better the performance. Lubricant can be improved in different ways by the addition of different additives like anti-wear, anti-friction, anti-oxidant, anti-corrosion, extreme pressure, detergent and so many others. Continuous damage in the advances of technology equipment and increase in demand are the main reasons for the advancement of different additive to meet the present need and also the utilization of their efficiencies. PTFE substance is considered as the more appropriate to provide these qualities listed above. The nature of PTFE reveals the consequence it has on properties of tribological, especially at the distance of 2-120nanometers (nm) (Elsevier B.V. 2013).
From survey of literature, it was revealed that despite the knowledge that PTFE is very useful solid lubricant, it usefulness has not being fully utilized as lubricant oil additive. It is difficult for some studies of comparative between micro-lubricants and nano-lubricant to reveal the effect of different size of same particles of additive. The important of this comparism become notable if this is done on good composites polymer performance. (Elsevier B.V. 2013)
2.3 Oil Preparation of Suspension with Polytetrafluoroethylene
Polytetrafluoroethylene is of very low energy and it sediment whenever it is mixed with base oil mineral. Stability suspension can be improve through diverse ways such as coagulation prevention by mixtures through repulsion of substance particle; constantly increasing the viscosity of the different phases of sedimentation; solidifying the substance by structure network; using the stirrer for different phase mixture; the disruptor and bath of ultrasonic and the splitting of particles by high-pressure. ( Kumar.M. Dubey et al. /Wear 306, 2013, 80-88).
2.4 Purification of Lube Oil
Improper management of waste lubricants oil posed a severe problem to the environment. Nearly all kinds of used oils have the capability to be recycle without any harm, minimizing waste of non-renewable supply and also reduce pollution of the environment. Most often, nearly all the used oil are not properly handled. Many are being emptied directly into waste water, which directly affect the plants that get their treat from waste water. Most at times, it is dumped in the open field which can easily find their way into the aquatic water body , thereby affecting aquatic life and also affect weeds growth , while some dumped theirs directly on the road. Improper disposed of lubricant waste into the eco system can cause hazards to the environment. There is serious law being promulgated worldwide for petroleum waste disposal and sincere effort should be put in place for this practice to be adhered to. Most often, this used lubricants oil can be reused without the addition of additive which can result in conservation and saving of cost. This recycle of used lubricants oil has become a very useful industrial process, using different techniques for the purification of oil (Everest .T, 2005).
The reused of lubricants products are as a result of the fact that petroleum products cannot be destroyed. Lubricants products can only be affected temporally because of contaminants accumulation during use which find their way in as a result of adulteration, and deterioration, which can be remove by reconditioning the products. This product from the waste oil can be made equivalent to the new one after treatment (Everest .T, 2005).
Waste lubricant oil can be treated by use of acid clay method which is being filtered after collection before it is being dehydrated. Polymers, degraded additives, degradation products and asphalts are removed by treating the waste oil with concentrated sulphuric acid. Elevated temperature is used to neutralize the oil formed after removing the sludge formed. Certain impurities are removed by the clay and also bleach the oils. Clay and other solids are removed by the clay slurry. Further processing may be required if the lube oil product contains more than one grade of oil lubricant product. Lubricants oils which have not deteriorated to greater extent are
often treated with adsorbent without using acid. Spent oils, which have not deteriorated to great extent, are often treated with adsorbents without the use of acid. The final products are often subjected to centrifuging, filtering and settling. Transformer and insulating oils are most treated in this way. (Everest .T, 2005).
2.4.1 New stamping lubricants meet new challenges
Galvanic corrosion occurs when zinc coated steels is stamped with water-based lubricants. Suppliers have being enhancing the anticorrosion, lubricity characteristics and residue properties of synthetics lubricants as the demand for synthetics increased. There are many standardized stampers on lubricants synthetics. Remarkable overall savings can be achieved through decreased housekeeping, improvement of quality weld, weld-life tip increased, and safety improvement which can either be achieved through direct or indirect method in the pressroom. The increased use of coated steels, aluminum alloys and use of advanced high-strength steels have being posing serious challenges to stampers in the recent years especially those in the industry of automotive. The strength of some lubricants can be altered beyond limits when these materials are stamped. The uses of water-based lubricants are frequently restricted in Europe and Asia whenever their components are being stamped (Lenick, A., & Raymond E., 1989).
Spring back properties and the hardening work of high-strength steels can make the stampers to increase ram dwell time and advance press tonnage. The consequential increase in heat in combination with friction increase can lead to lubricants stamping break down, decrease in protection boundary and make them non efficient. Additives with extreme pressure like sulfur, chlorine and phosphorus can salvage these situations. These additives react with metal to produce metallic salts with low strength shear when it is being activated by heat (Lenick, A., & Raymond E., 1989).
Large quantity of sulfur and chlorine are most often found in fats, olefin and paraffin. These carriers do not mix well in water-based synthetics as additives and are soluble in oil. Synthetic lubricants can combine with either sulfur or chlorine at low level in the form of sulfurized ester or chlorinated or fatty acids which are made soluble in water and are neutralized. Sulfur and chlorine are degraded to produce trace acid in the presence of humidity and heat, which are metal corrosive. A water insoluble
acids scavenger often added to the based-oil formulas to consume the acid and also act as inhibitors. If the sulfurized or chlorinated lubricants synthetic are not removed, the residue can becomes corrosive on parts subsequently leads to staining and corrosion. Stamping zinc-coated steels with water-based stamping can lead to galvanic corrosion. Phosphate esters water-soluble usually contains extreme pressure additive in lubricants additive. In advance high-strength steels metal forming operations, protection and galling may not be provided by phosphorous (Lenick, A., & Raymond E., 1989).
More effective or emulsifiable based-oil lubricants are being sort for by stampers faced with the challenges of carrying out severe forming operations on higher-strength steels. Significantly enhanced protection levels are provided by these products which contain high levels of phosphorus, sulfur or chlorine compare to the more often used traditional synthetics. There are new technologies that help to reduce problems associated with emulsifying agents of petroleum which are used in combination with neat and emulsifiable oils to increase cleaning properties in the wash operations after process. Quality issues related to welding operations or smoke reduction are some of the principal function of some water emulsifier’s lubricants which contains minimal quantity of petroleum. Renewable oils that are derived from seed plants and vegetables can be replaced by some lubricants. Many of the benefits of both synthetic and oil lubricants are provided by these neo-synthetic products (Lenick, A., & Raymond E., 1989).
There are other benefits provided that are useful when forming high-strength steels by oils apart from the high levels of effective extreme pressure additives that can be blended into them. Oils can provide superior strength of firm in addition to the neo-synthetic lubricants designed for this type of work. All these quality helps the lubricants to withstand the thinning effect which is due to excess heat resulting from forming or operations of ironing tight-tolerance. Consistent boundary protection that can minimized the need for extreme pressure additives forming stages are provided by the added strength of film (Lenick, A., & Raymond E., 1989).
2.5 Synthetics Role
The cleanest choice is still being represented by synthetics, which formed significant lubricant alternative for several applications. Synthetics either wet or sheet are preferred on steel oiled than emulsions. Water-based synthetic lubricants may need further application within multistation dies to compensate for their decreased strength film and carry –through when compare to oils and emulsions. Recently formulated synthetics contain phosphorous as an additive of extreme pressure and additives of polymer to increase their ability throughout the process of forming. These abilities increase their performance in the press and also to resist corrosion on the products of uncoated steel (Nadkarni, R. A., 1991).
2.6 Oil-Based Emulsions and Neat Oils for Coated Steels
Different method of lubricant stamping are needed for zinc-coated steels .Steel are protected by zinc in two different ways: as a sacrificial anode to for the iron and also to physically prevent moisture and oxygen which are the basic agent of rust and corrosion. Neat oils provide the best anti-corrosive characteristics due to its impervious to moisture and also oils create low conductivity for stamping these steels. Other water-soluble with additives and emulsifiers that are also next-best of based-oil emulsions are emulsifiers with polar which has an affinity for oil and water. In practice, droplets of oil microscopic are scattered and stabilized in water. Oily films that prevent oxidation are left behind after evaporation of water as a residue on parts. It is of great significant that the lubricant does not contain high levels of additives alkaline when it is use for multi-metal substrates (Wu, Y.Y., Tsui, W.C., & Liu, T.C., 2007).
Additives that can dissolve in water are solutions formed by synthetic lubricants. Most of its residue does not create protective substrate when in vapor phase. For protection of ferrous alloys against corrosion, these products mainly rely on amine salts. Zinc oxide or white rust formation is speed up by the conductivity that promotes galvanic reaction, which is due to the alkalinity of these salts. The oxidizing effect can be exacerbated from the presence of higher coatings film if the residue is tenacious, in the case with many synthetics formulated for high-strength
steels. Severe corrosion can occur in the presence of alkaline salts and water which can create galvanic reaction where parts are in contact. Iron is present in the zinc substrate in galvanized steel. This steel can be makes vulnerable to galvanic reaction with alloy-like substrate. Finally the soap complexes in synthetics react with zinc oxide to form zinc insoluble stearate that can bonds with the substrate. When this happens, it is hard to physically remove the corrosion with pads of Scotch Brite. Pitting or staining to the base metal remains if removed (Wu, Y.Y., Tsui, W.C., & Liu, T.C., 2007). .
2.7 Prevention of Puddling by Tight Nestling, And Others
Water-miscible lubricants are used by North America according to history. This can be remarkably minimized by using water to diluting these products. Irrespective of the source of the oil, most of these emulsions provide remarkable anti-corrosion protection. These properties can be improved by stacking parts in a way that it can avoids tight nestling, or puddings of lubricants. Most lubricants synthetic have decreased alkalinity, and may be formulated with low wetting properties so that lubricants beads off the part. Conductive films exposures are reduced by these conditions and it also improve compatibility with steel zinc-coated. The primary anti-corrosion characteristics on ferrous metal are provided by alkalinity in synthetic lubricants. Low wetting properties may need excessive reapplication or may be deficient of the presence of film needed for advance stampings. Only few lubricants synthetic can provide barriers of vapor or may provide monitored zinc passivation. These products can decrease corrosion or the risk, but none of them have better characteristics than some emulsions or neat oils. (Paul Bosler, 2013).
2.8 Forecasting
The major cause of variation in economic and business time series in terms of growth rate measure either monthly or quarterly is mainly due to seasonal changes. For us to make references on the cycles of business nature and growth in long run, the normal approach is to eliminate the component of seasonal series through differencing in seasonal. Because seasonal methods convey some information on the agents of the economic behavior, there will be need for us to study the seasonal methods on their
own. Most at times, data that are adjusted seasonally are very useful; it can be recommended at times (Fildes, R., Armstrong, S.J., 2006)
Seasonal adjusted methods can cause serious data distortion, to the extent that the cycles of business and nonlinearities are also affected. This research was done to evaluate how seasonality explicitly relate to forecasting models. Series of time seasonality is made up of two models which are root unit seasonality and periodic models. They both provide solutions to the characteristic of many data of economic, that is sequential seasonal variation and the one that change over time which is refer to as seasonality trends. When seasonality is dependent on trend, this series of time describe periodic unit roots. When the lag structures are allowed to take different seasons, this can lead to seasonal variation which is also one of the assumptions in periodic models (Fildes, R., Armstrong, S.J., 2006)
Performance of forecasting is poor when applied to seasonal unit roots model. This poor performance may be as a result of lack of capacity of some unit tests roots. There is variation in seasonal factors due to frequency of the evolving seasonal models, represented by the processes of auto regression. The coefficient that is attached to the seasonal factors can be isolated by data simple transformation according to Pagan and Hylleberg. Neglected mean of seasonality shifts can remarkably affect the performance of forecasting in the processes of univariate auto regression. When there are restrictions of parameter in a bivariate vector of seasonal auto regression, better forecasts can be achieved, more remarkable performance can emerge only for longer horizons forecasting. Important information can be lost when data that is adjusted is being used (Fildes, R., Armstrong, S.J., 2006)
2.9 Techniques for Forecasting Demand
Short term demand estimation uses survey method while statistical methods are more appropriate for forecasting in the long term. Any of the two methods can be used to forecast for an existing products; but for a new products that lack historical data, only survey methods will be appropriate. Survey methods involve proper investigation about the intentions of the consumers, experts’ opinions, managerial plans survey, and the markets. Forecast for demands are made by the data collected for analysis. Survey of consumers ‘is done by collecting information from the potentials
consumers through direct interview to know their willingness to buy a particular product at different prices rate. Consumers’ survey can either be end use method or complete enumeration sample survey. It is complete enumeration survey when the product consumers of a product are contacted to know their plans of buying the production concern for the period of forecast. The sales forecast is gotten by adding the likely demand of all the consumers. This method is free from bias because its uses direct information. This method is only applied to product that its consumers are located within certain region. It cannot be applied when the consumer of the product are scattered dispersedly. The estimation obtained through this method are not very reliable as consumers may not think out in advance what they may likely do during the survey situations. The question may not be answer correctly by the consumer as they may not be fully aware of their exact demand. The market conditions may also affect their answers and make it biased, and future unforeseen circumstances may also affect their answer to the questionnaire (Singh S.P. 2014).
Appropriate accuracy of survey cannot always forecast consumer demand even when it is properly designed. Inadequate information by the consumer can affect their decision if the product will be purchase by them. At times, respondents may give inaccurate answer because they may be short of time and may not give much time to think before providing an answer. Most at times, the answer supplied by the respondent may be affected because most of them tried to get the attention of the person administering the questions. Because of these stated reasons above, forecastings hardly depend solely on consumer’s surveys results. For this, decision making must not solely depend on these data but as supplementary sources (Singh S.P. 2014)
Method of end use forecasting demand make use of both practical values and theoretical to a great extent. A survey is carried out in firms or in every industries making use of the product sales to forecast under the condition based on survey demand of the industries by using the product as a product intermediate. The final product is produced by using the demand for the final product as the end user demand. This technique of forecast demand is made up of four estimation stages: Information of the product in question potential use is obtained. Find out appropriate technique regarding the regular consumption and use of the product under study. The
output of different industries must be known and use as reference year and most likely occurrence in other activities of the economy that uses the product and their targets output. Lastly, constituent of the product forecast is to be in respect to demand (Singh S.P. 2014).
2.10 Forecasting Methods for Supply and Demand Chain Management.
Decreasing inventory is an important component of cost control in management of supply chain. There are many ways to minimize inventory, and one of the major ones is forecasting demand which is the process of obtaining correct picture of how the future demand will look like. Forecasting demand is often carried out on each stock item stock keeping unit (SKU) during inventory control operations. Customer service remains above acceptable levels for each stock keeping unit by using key performance indicators (PKIs). A good example of KPIs is order fill and case fills. Costs of inventory can increase when there is extra safety stock, which can lead to conciliations of some inventory at the future stages of the lifecycle of the product. (Skylergreene Hubpages, 2012).
Planning demand is one of the foremost ways of reducing safety stock by supply chain managers. The primary goal in the supply chain is increasing accuracy in forecasting. Correct forecast can be obtained by using Mean Absolute Percent Error (MAPE) formula. Correct forecast is a method that is indirectly proportional to MAPE, that is, as correct forecast increases, MAPE decreases. The aim of forecasting demand is to monitor inventory, hence forecasting demand are clearly seen in daily management inventory. In inventory cycle ordering policies, business is divided into two different classes: some are concern with review that is continuous while others are concern with periodic review (Skylergreene Hubpages, 2012).
Whenever a fixed quantity of stock drops below expectation known as the point of reorder, inventory is done on daily basis by using continuous reviews. A good example is a trucker: which normally uses his semi’s fuel tank with certain amount of diesel whenever there is a drop in his fuel below certain level. Periodic review uses different method. Inventory is review at regular time interval and enough quantities of stock is being order in order to retained level that is predetermined. There is a change in order quantity in relation to the stock amount used since the
latest date review, which is also called points of review. . (Skylergreene Hubpages, 2012).
Inventory levels are lower in more frequent order by continuous review, while periodic review increases inventory in orders that is less frequent. There are variations across organizations and industries in respect to particular method to be used, the item ABC analysis is frequently of importance in deciding which approach to use. Continuous review will be more appropriate for fast moving items A, while periodic review will be more appropriate for slower moving items B and C (Skylergreene Hubpages, 2012).
The final point that needs control in forecasting demand is the economic order quantity. There of often a relationship between inventory level and order of frequency. When inventory is kept at a low levels and the frequency orders is made available, it will decreases obsolescence risk, waste as a result of spoilage when food items are involve. Frequent orders can increase costs of transportation, a good example is that, it’s is less expensive to shipped one hundred pound bag of salt than it is to have one thousand and one pound bags shipped. Inventory levels is increase with periodic review, decrease transportation costs often outweighed higher inventory holding costs. (Skylergreene Hubpages, 2012).
2.11 Synopsis on Decomposition and Combination
The accuracy of forecasting can be remarkably improved through the use of different and combination of multiple individual forecasts (Clemen 1989). This conclusion has being maintained in many survey and papers that followed after. It has been found in different competitions of forecasting that single forecasting method cannot consistently perform well across forecasting horizons and all time series (Fildes, Hibon. Makridakis, & Meade, 1998). Misspecification bias in the individual models can be reduced and accuracy prediction can be increase through forecasts combination. The strengths and limitations of the different forecasting methods are always the source of the increase in accuracy. Values are added to forecast combinations when the different forecasting methods are misspecified differently (Diebold and Lopez 1996).
The worst forecasting method should be avoided by practitioner when combining different forecasting method for that specific point in time, and therefore makes the evaluations across all forecasting horizons (Armstrong et al., 1983 & Hyndman 2006). Individual models respond differently to changes in structural data, and due to this reason, forecasts combinations from different models with different degrees of adaptability to changes in structure will perform better than forecasts from individual models (Timmermann, 2006).
2. 12 Overview of Decomposition
Trend seasonality and cyclical patterns were isolated and identified by the use of decomposition techniques which was initiated by Persons in 1919. This method has been used since then by different institutions and governments to analyzed data of economic in order to produce official statistics. The most effective methods in the literature are moving average techniques based, like X-11 ARIMA/88 (Dagum, 1988), Seasonal Adjustment at Bell Laboratories (SABL) (Cleveland, Devlin, & Terpenning, 1981), and Seasonal –Trend decomposition based on Loess smoothing (STL) (Cleveland, Cleveland, McRae, & Terpenning, 1990), multiple regressions based techniques, and methods based on time series ARIMA modeling (Bell & Hillmer, 1984). There are also different ways of extracting the component of the trend from seasonally adjusted series, which includes the parametric methods that uses the work of pivotal of Kalman, which has space of state representations in addition, and models based on the Wiener-kolmogorov theory (West & Harrison, 1989; Kitagawa & Gersch, 1996). There also exist in addition to the two stated models above, semiparametric methods based on smoothing spine and models that is mixed, nonparametric methods that uses filters of band-pass and methods of wavelet, kernel estimation methods and local polynomial modeling ( Fan & Gijbels, 1996) Decomposition methods were not initially developed to serve as tools for prediction, the brain behind their application to forecasting is very interesting. Isolating is the process of disaggregating the different components in the data and predicting each one individually, strong and persistent element are used to governed the smaller parts of the overall process, thus removing from them any noise and variability that is not consistent. Due to their more deterministic nature, these processes are easily extrapolated. There is likelihood to obtain more accurate forecasts for the individual
components than one is likely to obtain in the global series. This becomes significant in the case of time series due to it high degrees of noise forecasting (International Journal of Forecasting 27, 2011).
Classical decomposition techniques is the extrapolation of the components of the individual, obtained by the averaging techniques application (Damrongkulkamjorn &Churueang, 2005). The remaining component after the elimination of any cyclical, seasonal variations and trend is always assumed to be variable of randomness with a variance that is constant, and is thereby removed from the process of the forecasting (International Journal of Forecasting 27, 2011)
2. 13 The Decomposition Procedure
The additive decomposition of the global time series uses the trend and the seasonal decomposition. The STL additives decomposition performs of the data through applications of sequence of the Loess smoother, which make use of the locally weighted polynomial regressions at different point in the set of data, with the point being estimated closest to the values of the explanatory variables. The STL decomposition procedure has advantage over the other decomposition techniques due to its extensive applications to a larger number of the time series and also its strong resilience to outliers in the data, which leads to large component subseries. The results from neighboring time points are treated as independent; it does not impose a particular form on the seasonal pattern. It is also capable of handling seasonal time series with any value of season frequency greater than one. It is therefore applicable to a wide range of time series with several characteristics, and to a frequencies sampling of diverse set. It does not require any mathematical modeling for it implementation, it is purely based on numerical methods. This is the main reason why this method is very easy to implement for a large number of time series. This also suggest that a large number of time series can be applied without requiring time to be invested in modeling the properties of each of the time series that is involved in the analysis ( International Journal of Forecasting 27 , 2011).
An iterated cycle of trend is used to carry out the procedure and then seasonal component are updating from the resulting sub-series. The robustness weights are
formed at every iteration based on the estimated irregular component; outlying observations in subsequent calculations are down-weight by the former. Two recursive procedures are what made up the iterated cycle, the inner and the outer loops. Seasonal smoothing in the inner loop are applies which updated the seasonal component, followed by smoothing trend that updates the component trend. Larger values are identified as extreme values, and a weight is being calculated, which includes the outer loop. The weights is used to down-weight the effect of extreme values by the further iterations of the inner loop, which is identified in the previous iteration of the outer loop (Cleveland et al. 1990).
2.14 Extrapolating the Error Component
The error component obtained from the decomposition procedure application is always removed from the procedure of the forecasting. The recent application believed that predictive information in its sub-series, are contains in the error component, discarding it totally could have a negative effect on the accuracy of the estimation. According to the literature review, error component accounts for approximately 25% of the predictability in the series. The error component information may be contained in the form of either conditional dependence on the other decomposed features of the original time series or residual autocorrelation in its series. The error component is also included in the global series of the estimation, by means of a combination technique which is based on the extraction of the error component from the deseasonalised series and detrended extrapolated. We can get these values by adding together the error component, the trend, the seasonality and error respectively (International Journal of Forecasting 27, 2011).
2.15 Sales Forecasting
This is a forecasting system that uses history of sales data to create the statistical forecast for the future purposes. The sales history to run this statistical forecast will either be demand history or shipment history. For instance, if a customer placed an order for 20,000 units, in June, but you were unable to ship the product not until October. If the Company system post the history as October, then the forecasting system use 0 units in June and 20,000 units in October to get the forecast statistically. The right procedure is to post the 20,000 units as June history for sales forecasting reasons. Demand data can still be altered by non-recurring or one-time orders that can result to inaccurate sales statistical forecasts. Demand data that get into the
demand history record include promotions sales that will not be repeated in the same season in the coming year, increase in demand as a result of special order, customer one-time orders, using specific –customer demand that are too small to be significant statistically. Demand history values that are outside of a statistical confidence interval are automatically filtered by some systems. Data scrubbing when included in the process of regular demand planning can help to eliminate bad data. In order to make adjustments to the sales forecast, the sales forecast have to travels from the forecast planner to the sales team to and the product management team. Most often, planner’s base forecast adjustment on a feeling instead of exact knowledge of the activity of customer. Danger should be signified if you surpass more than 10 to 20 percent of the forecasts statistical system’s (Fred Tolbert, 2012)
Forecast adjustment can be done by using the system’s statistical forecast as the starting point. Statistical forecast can only be adjusted if you know something about the future that is not reflected in the demand history. Otherwise, any attempt to make it look attractive should be resisted. The unusual events that can make some sales not to be reflected in the past sales history include promotions, item substitution, new item introductions, and item replacements. There should be often review between actual sales performance and forecast to ensure that the availability of right levels of inventory to meet the special event needs. The best estimate of customer demand should be the sales forecast of the company’s. It should not be adjust in an attempt to manipulate inventory levels and fill rates by the executives. Services level and inventory are best managed as part of the inventory replenishment and of the supply planning. Root cause analysis should be perform on items with high forecast errors to know the actual reasons for the error forecast (Fred Tolbert, 2012)
Whenever the actual demand is greater than the forecasted, safety stock inventory helps to cover for these periods. This is often done by using the math of the traditional calculation safety stock. This traditional safety stock calculation based on error of forecast does not differentiate between periods when the forecast is too high or when it is too low. If the result of the forecast error is greater than the actual, new statistical modeling techniques can be used to eliminate the bias for that periods or an inventory planning strategy based on safety time can also be used (Fred Tolbert, 2012).
3. MARKET ANALYSIS
The market analysis for this thesis was done based on the data made available by the Company of our case study. According to their sales and demand record, demand is directly proportional to production. This will be further analyze using autocorrelation functions and partial autocorrelation functions to further analyze the market demand whether is increasing or decreasing in relation to production rate. The market analysis done revealed the rate of demand of the different products produced by the company and also the rate of production as the Company often produced according to the proportionality of customer demand. This analysis was also responsible for the choice of five products selected for analysis and discussion because they have the highest demand when compare with other products.
The following findings were discovered by the market analysis when the Company data was used. Product 1 was having 5.2% demand and production, product 2 was having 9.4% demand and production, product 3 was having 8.3% of demand and production, product 4 was having 35% of demand and production, and product 5 was having 28.2% of demand and production. The rest products result are as follows: HI-Therm 32 was 0.06%, Turbine Oil T46 was 2.08% , Extreme Pressure 2 and 3 Grease was 1.02%, Heavy Duty Grease was 0.01%, Transformer Oil was 2.04%, Transol DX 11D was 0.9%, Moto 2T was 0.162%, Gamma XP 100, 150, 220,320,460, and 680 was 3.5%, Compol S46 was 0.012%, Compol 68 was 0.034%, Compressor ISO VG150 was 0.022%, Bearing and Circulating Oil was 1.736% and other Specialty Oil was 2.324%
This analysis was what influences the choice of the five products that was considered for both market analysis and forecasting of this thesis. From the analysis made, it was quiet clear that demand is directly proportional to rate of production. Since
market is the greatest allocation of resources, these five products are expected to gain more market shares than other products in the future market and also in production.
3.1 World Lubricant Demand-Analysis by Product
Lubricant suppliers need to keep abreast of technological advances in motor vehicle design in order to meet the evolving performance requirements of end users. Technological advances in automotive engineering have led motor vehicle manufacturers to demand better performing lubricants capable of delivering the high performance and durability demanded by consumers while simultaneously reducing the environmental impact of emissions and used lubricants. Variations in motor vehicle design throughout the world require lubricant suppliers to ensure that their products are able to perform adequately in operating conditions of wide range (Chevron Oronite, Lagos, Nigeria 2008).
For rapidly advancing economies in China and India, with combination with more subdued growth in some of the region's more developed economies, will support increases in lubricant consumption. The Asia/Pacific region's rapidly growing motor vehicle fleet, large population base and strongly expanding manufacturing sector provide significant opportunities for growth in the lubricant market. In Latin America, Eastern Europe and the Africa/ Mideast region, lubricant demand will grow slightly slower than in the Asia/Pacific region. Within Eastern Europe, lubricant demand will continue to recover from the losses suffered during the early 1990s, supported by outside investment in the region's manufacturing sector and strong increases in the number of motor vehicles in use. Lubricant demand in the Africa/Mideast region will be driven by the ongoing industrialization of many of the countries in the region, although the motor vehicle aftermarket will be somewhat restrained by a lengthening of drain intervals. In Latin America, demand advances will be aided by recovering regional economies, increasing vehicle usage and an upsurge in overall manufacturing and industrial activity(Chevron Oronite, Lagos, Nigeria 2008)..
By volume, the mature lubricant markets of Western Europe and North America are fairly stagnant. Those countries on these regions generally possess highly developed
of volume growth, significant opportunities exist for specialty lubricants for niche markets. The countries in these regions have some of the most stringent environmental and health regulations in the world, and there is a growing demand for environmentally friendly products. Additionally, these technologically advanced countries have a strong demand for high-performance, long-lasting products. Despite flat volume demand, these regions will continue to offer numerous opportunities for companies marketing high-value lubricants, particularly for niche consumer applications. Engine oils will remain the most dominant lubricant product. Process oils will be the fastest growing lubricant product through the forecast period, as their consumable nature makes them less vulnerable to factors such as fluid recycling and lengthened drain intervals. Demand for hydraulic and metalworking fluids and other lubricants will continue to expand, as these products are important in a wide variety of industrial and other applications. Lubricant consumption will be restrained somewhat by the lengthening drain intervals and fluid management efforts made possible by the increasing availability of higher quality products (Chevron Oronite, Lagos, Nigeria 2008).
4. PRODUCTION PROCESS AND PRODUCT
4.1 Products and Quality Control
Lubrication is the addition of a substance into parts of surfaces in motion that are in contact to decrease friction and heat emition. Lubricators are mechanical devices to supply lubricants. The oil reservoir supply the bearing journal which is being immersed, this oil pool helps to reduce heat that is generated as a result of surfaces in contact. A device that help to split the oil is used in gears, bearings, or any parts involved in motion inserted into the pool of oil which is splinted through different route. Reservoir, pump and tubes are usually found in the centralized oiling systems by which oil is distributed, and the viscosity of the lubricants can be change by the introduction or either heaters or coolers. Grand Petroleum is aggressively engaged in the following:
Manufacturing and Sale of Lubricating Oils.
Sole Manufacturing and Marketing of the Hi-Speed range of lubricants.
Toll blending Arrangements.
Engine Oils.
Hydraulic Oils.
Automobile Fuels & Lubrication.
Industrial Fuel & Lubrication.
Other Specialty Oils.
4.2 Professionals Management of Lubrication
Most companies around the globe is in urgent need of professionals management of lubrication. The numerous production assets that are essential in different operations and stages of industrial production are owns by these companies. The dependence and costs of operation of these machines are majorly relying on the effectiveness and
of lubrication. The professionals’ management of lubrication is to make sure the equipment functions properly and also to reduce costs of production. The strength and profitability of the company lies majorly on the professionals’ management lubrication position which is also the engine house of the company. Every company sponsors the professionals’ management lubrication from the gained savings from efficiencies increased from operations maintenance and productivity asset (Machinery Lubrication, 11/2002).
4.3 Job Description
Professionals management of lubrication (PML) are charged with the duties of maintenance of lubrication functions which includes analysis of oil, selection of lubricant, practices of lubrication, storage and handling of lubricant and control of contamination. The PML give order to the engineer of plant or superintendent of maintenance and the next line reports are the technicians of lubrication and the analysts. The least experience in dependence of machinery and lubrication is five years. An analysis of lubricant with a four year engineering degree or it equivalent is more acceptable with the necessary certification. The responsibilities of the lubrication management professional is to ensured proper selection and specifications of performance of every lubricants for different machine, supported by the engineer of lubrication, managers of equipment and suppliers of lubricants, start guidelines of oil and grease, make sure lubricants are formulated to reduce costs, control wear and save energy, ensure standard quality, ensure accident is reduce to the barest minimum and also consider factors of the environment. They also make sure the lubricants can circulate well in the selected machine, work on fluids and environment, communicate standard for all products of lubricants, carry out lubricant strategy consolidation and also participates in selecting suppliers of lubricants. The lubrication management professional communicate the stages in line with set out standard for lubrication, which are as follows;
Cleaning and flushing of tank or sump,
Condition for Oil removal when due,
Procedures for top-up,
Grease and calibration of gun,
Inspections of machine,
Control of contamination,
Inspection of filter used and changes, and
Operation of grease gun (Machinery Lubrication, 11/2002).
4.4 Lubrication
Lubrication is the addition of a substance into parts of surfaces in motion that are in contact to decrease friction and heat emition. There are different types of lubricants, which can be in form of grease, oil, liquid, semisolid, brittle, or solid that allowed free motion of mechanical devices and avoid damage by rubbing seizing of other parts through inequality expansion as a result of heat .Lubricant can also performed the role of coolant in machines to prevent heat due to impaired parts Their classification is depend on their source, which can be gotten from animal, vegetable and mineral. Lubricant .Before the late 19th, lubricant was gotten from animal fats and oils, and vegetable oil. Presently, most of the lubricants are obtained from mineral oils such as petroleum and shale oil which can be obtained without decomposition. Some lubricants like silicones can be synthesized, which is very useful for high temperature.
4.4.1 Lubricants application
The output of the machine is largely determined by the way application and the type of lubricant used. Before now, hands were used to apply lubricants, but advance machinery needs precise ways that can be controlled exactly. Different machinery needs different ways of lubrication, and they different from one another and different ways must be used for different parts. Different parts of an automobile needs different way of lubrication to keep it functioning at it maximum performance. The chassis needs grease to lubricate it, and the engine crankcase is being lubricated by engine oil to reduce friction and wear and tear and heat dissipation.
When stamping zinc-coated steel, stampers can chose from a number of options of lubricants to prevent corrosion. European and Asian markets are dominated by neat-oil stamping lubricants. The need to eradicate corrosion, most especially on steel coated with zinc is the driven trend toward oil. Some of the hot melts and thixotropic preludes’ are now becoming more readily available. Coils or blanks migration are
prevented by these products which contain levels of micro wax. The coils do not suck oil and the coating is uniformly light. Lubricant applications at the press are not require by these high-lubricity coatings. Compatible oils also referred to as spot lubricants can be applied strategically for the protection of ancillary in more challenging operations.
4.4.2 The process of manufacturing
Fraction tower of good performance is built with good quality steels that have the ability to prevent corrosion that is present in the corrosive constituents of oils crude; which has different stages of trays that collect the condensate. The various fractions cool as the vapors rise up inside the tower, condensation take place and it return to it liquid form which is determined by their different boiling points respectively. The natural gas has the lowest boiling point, after which it is followed by gasoline, kerosene, oil fuel, based oil and tars finally. Tanker ship or pipeline is used for the transportation of crude oil to the refinery. Water and oil contaminants like rock and sand that may be retain in it are removed through sedimentation at the refinery. The oil crude is pumped into holding large tanks where oil and water are being separated and the contaminants are settled out of the oil in the process (Periodicals.B.K., 1993). The lube oil collected in the two fractionating towers after removing the unwanted compounds is further processed by passing it through different ultrafine filters to finally take away any impurities of any kind. Six-Carbon rings like the aromatics hydrocarbons which affect the lube oils viscosity are removed by solvent extraction process. Because aromatics hydrocarbon are more soluble in the solvent more than the lube oil fraction, this simple reason made solvent extraction possible. The aromatics dissolved when lube oil is treated with the solvent and after removing the solvent, the aromatics is also removed from it. After all these processes, the based oil is mixed with specific additives to give it the required physical characteristics. The flash point, color, fire points, viscosity, and specific gravity of the lube oil are ascertain through different quality control tests. Certified oil by the laboratory scientist in accordance with set out standard are packaged for distribution and sales.
Additive like lead that enable lubricant oil to withstand high pressure surface of mating and very low temperature and way of refining are the determent factors of the specific gravity of oil. The brand or grade is being indicated by the uniformity of it color. The temperature at which the lubricant oil produces enough flammable vapors is called the flash point. The temperature at which the lubricant oil starts to burn when exposed to fire is called the fire point. The classification of engine oil is done by it viscosity and also it strength according to the set out standard by Society of Automotive Engineers (SAE). The characteristics strength of lubricant oil includes anti-wear, ability to form sludge of oil deposit and thickening of oil (Periodicals.B.K., 1993).
Because supplies of petroleum product are both nonrenewable and finite, this will make the future of lubricant oil limited. Out of the total petroleum reserves available, one third has being used. Synthetic mineral oils will be relevant in the future as the natural reserves are drastically reducing. The dwindling reduction in petroleum will not only affect lubricant oils but also other by product from crude oil refining (Periodicals.B.K., 1993).
4.4.3 Handling and storage of lubricant
Lubricants with high ability are carefully selected during products formulation with respect to additives and also the base oil used for the formulation in order to suit the equipment requirements that it is being use for. This balance is disrupted whenever a particular lubricant product is mixed with other. If this is not notice on time, it can lead to shortage of life span and mechanical damage of equipment. Recently formulated lubricants products are well formulated to meet present need of advance equipment requirement. Your business and equipment can be exposed to great danger whenever the lubricants are adulterated. We should not mixed any lubricants product when we are not sure of the resultant outcome or when there is not proper verification of the end product by the quality control officer in charge of quality. This can lead to reduction in the viscosity of the products and also have a negative effect on it chemical characteristics. When lubricants with the same grades of API