KADIR HAS UNIVERSITY
GRADUATE SCHOOL OF SCIENCE AND ENGINEERING
USE OF MACHINE LEARNING TECHNIQUES FOR
DIAGNOSIS OF THYROID GLAND DISORDER
IZDIHAR MOFEK
IZ DI HA R MOF EK Ma ster The sis 20 1 6
USE OF MACHINE LEARNING TECHNIQUES FOR
DIAGNOSIS OF THYROID GLAND DISORDER
IZDIHAR MOFEK
Submitted to the Graduate School of Science and Engineering In partial fulfillment of the requirements for the degree of
Master of Science In
Computer Engineering
KADIR HAS UNIVERSITY May, 2016
KADIR HAS UNIVERSITY
GRADUATE SCHOOL OF SCIENCE AND ENGINEERING
USE OF MACHINE LEARNING TECHNIQUES FOR DIAGNOSIS OF THYROID GLAND DISORDER
IZDIHAR MOFEK
APPROVED BY:
Assoc. Prof. Dr. Zeki BOZKUŞ Kadir Has University _______________ (Thesis Supervisor)
Asst. Prof. Dr. Tamer Dağ Kadir Has University _______________
Assoc. Prof. Dr. Ahmet Yücekaya Kadir Has University _______________
i
USE OF MACHINE LEARNING TECHNIQUES FOR DIAGNOSIS OF THYROID GLAND DISORDER
Abstract
The advancements of computer technologies have generated an incredible amount of data and information from numerous sources. Nowadays, the way of implementing health care are being changing by utilizing the benefits of advancements in computer technologies. It is believed that engineering this amount of data can assist in developing predictive tool that can help physicians to diagnosing and predicting some debilitating life-threatening illness such as thyroid gland disease.
Our current work focuses on investigating python languages to diagnose thyroid gland disease based on machine learning, and involves developing a new tool to predict the diagnoses of thyroid gland diseases, which we have called as a MLTDD (Machine Learning App for thyroid Disease Diagnosis). MLTDD has been designed with Qt designer and programmed using PyDev, which is python IDE for Eclipse. MLTDD could diagnose with 99.81% accuracy.
Decision tree algorithm has been used to create the ML model, in addition to training dataset to learn from. ML model can be used to get predictions on new data for which you do not know the target and that is what we did to predict the diagnosis of thyroid gland disease as a hyperthyroidism or hypothyroidism or a normal condition using CRT decision tree algorithm.
MLTDD can minify the cost, the waiting time, and help physicians for more research, as well as decrease the errors and mistakes that can be made by humans on account of exhaustion and tiredness.
Keywords: Machine Learning, Thyroid diseases, decision tree algorithm, PyDev, python IDE, ML model.
ii
TİROİT BEZİ BOZUKLUĞU TANISI İÇİN MAKİNA ÖĞRENME KULLANIMI Özet
Bilgisayar teknolojilerinin gelişmeler sayesinde sayısız kaynaklardan inanılmaz büyüklükte veriler yarattı. Bu verilerin işlenmesi, ve bilgiye dönüşümü yine bilgisayar teknolojileri tarafından yapılmakta. Günümüzde, sağlık uygulamalarında bilgisayar teknolojilerindeki gelişmeler faydalanıyor. Makine öğrenmesi araçlarını kullanarak verilerin daha kullanışlı haline getirilebilir. Tiroit bezi hastalığı gibi bazı hastalıkların teşhisinde doktorlara yardımcı olmak amacıyla, makina öğrenme algoritmalarının kullanılmaya başlanmıştır. Bu teknolojiler insanlar tarafından yapılabilir hataları ve yanlışlıkları azaltabilir.
Tiroit bezi tiroit hormonları kontrol altında tutmak ve metabolizmanın çalışma hızını ayarlayan, insan vücudu üzerinde önemli organlarından biridir. Tiroit vücudumuzdaki tüm organları ve hücreleri etkiler. Tiroit bezi çok fazla hormon üretir ise, vücut olması gerekenden daha hızlı enerji kullanır ve bu durum hipertiroidi olarak bilinir. Tiroit kendi hormon yeterli miktarda üretilmez ise, vücut olması gerekenden daha yavaş davranır ve az enerji kullanır ve bu duruma hipotiroidi denir. Tiroit hastalığı kolayca diğer hastalık koşulları ile karıştırılır, tiroit hastalığı teşhis etmek zor olabilir.
Etkili makine öğrenme algoritmaları tiroit bezi bozukluğu gibi hastalıkların erken teşhis için yardımcı olabilir. Bu tezde mevcut makinası öğrenme araçları dayalı tiroit bezi hastalığı teşhis etmek için Python dilinde kullanarak MLTDD isminde bir araç geliştirdik. MLTDD tiroit hastalığını etkili bir şekilde teşhisinde yardımcı olabilir. MLTDD karar ağacı algoritması kullanarak model oluşturup, yeni gelen hastaları bu algoritma sayesinde tiroit hastası olup olmadığını sınıflandırıyor. Ara yüzü, Qt tasarımcı ile tasarlanmış ve Eclipse için Python IDE Pydev kullanılarak programlanmıştır. MLTDD% 99.81 doğruluk ile teşhis yapabilmektedir.
Anahtar Kelimeler: Makine Öğrenmesi, Tiroit hastalıkları, karar ağacı algoritması, Pydev, Python IDE, ML modeli.
iii
Acknowledgements
I would like to thank everyone has helped me to complete this thesis. Special, honest and deep thanks to my supervisor Assoc. Prof. Zeki Bozkuş for the guidance and his advice through my research. My big thanks to all faculty staff and employees, and I am pleased for being a small part of such great place for a couple of years, principally Prof. Dr. Feza Kerestecioğlu for his support provided through my journey.
My distinctive thanks to my husband; you were a total package of family and love that gave me strength, support during tough times. My daughters Weaam and Bayan, you are my words, my world, my strength, and the reason of my life. Thank you. Words can never express my thanks for my family, the source of power and strength; my parents for raising me up. My Father, thank you for everything you perfectly done to me, for the advice, encouragement and support through my life. My Mother, thanks are not enough and would not be enough, and sorry for being away from your warm and benign bosom but I will be back, hopefully soon. Thank you for my brothers and sisters. I would like to tank Elaine Woods; you have been so much more than a teacher for me. Before meeting you, I never thought that a person could be a teacher, support, mentor and sage all in one. I am grateful to have been taught by such an admirable person. Thank you for everything you have done for me.
I would like to deeply thank my friend Ebru ALP for being such a helpful friend, and I am grateful to my friend Fatma Al-Nemsy for her nice collaboration.
iv
Table of Contents
Abstract ... i Özet...………....………..…..ii Acknowledgements ... iii Table of Contents... ivList of Figures... vii
List of Tables... ix
List of Abbreviations... x
Chapter 1: Introduction ... 1
1.1 Overview... 1
1.2 Thesis Road Map... 2
Chapter 2: Motivation and Research Objectives... 4
2.1 Research Motivation...4
2.2 Research Objectives... 8
2.3 Research Contribution... 10
Chapter 3: Background Study and Literature Review... 12
3.1 Background Study... 12
3.2 Machine learning... 12
v
3.3 Machine learning in Healthcare……….………...…..….….15
3.4 Machine Learning Algorithms...16
3.4.1 Algorithms Grouped by Learning Style...16
3.4.2 Algorithms Grouped By Similarity ...18
3.5 Classification ...17
Chapter 4: Research methodology...22
4.1 Thyroid gland disorder...22
4.1.1 Thyroid gland system...22
4.1.2 Effects of Thyroid Hormones...24
4.1.3 Thyroid Diseases...25
4.2 Description of data set...27
4.2.1 General Description...27
4.2.2 Attribute Description...29
4.2.3 Data set visualization...32
4.3 Decision Tree algorithm...33
4.3.1 Decision tree representation...33
4.3.2 Decision tree types...34
4.3.3 Decision tree Metrics...35
vi
Chapter 5: Developing a ML tool for Thyroid Disease Diagnosis...39
5.1 Machine learning in Python...39
5.1.1 Python programming language...39
5.1.2 Python IDE (Integrated development environment)...40
5.2 Applying CART algorithm...41
5.2.1 Algorithm fitting...41
5.2.2 Evaluation...45
5.2.3 Tree visualization...48
5.3 Designing the Graphical user interface (GUI) ...49
5.3.1 PyQt based application and QT designer………..….….…50
5.3.2 Initial design...51
5.3.3 After pre-processing………...………..……….………..…51
5.4 Using Eclipse (PyDev) to connect GUI with python files...53
5.5 Performance Results ………...57
Chapter 6: Discussion and Related work...60
Conclusion...…..64
References...……….………65
vii
List of Figures
Figure 1: Estimated Thyroid gland incidence and mortality rate……….…6
Figure 2: Estimated Thyroid incidence and mortality rate as percentage…6 Figure 3: Prevalence rate for Thyroid disorders of different countries ...7
Figure 4: Research Method overview ………..…..…...…...9
Figure 5: Supervised Learning algorithms ………...…17
Figure 6: Unsupervised Learning algorithms ………...……...…18
Figure 7: General approach for building a classification model …………20
Figure 8: Thyroid system ………...…24
Figure 9: Python code to get the number of instances per class …………29
Figure 10: Python code to get the domain of each attribute …………..…32
Figure 11: Class visualization for the whole dataset ……….……32
Figure 12: Importing the required Python libraries………..…..41
Figure 13: Converting the dataset into a pandas frame ……….42
viii
Figure 15: Histogram for Ann_tyroid dataset………..…..…….43
Figure 16: Predicting the class label for training and testing dataset.……45
Figure 17: Classification and prediction accuracy………..………46
Figure 18: Precision and recall for class label……….……46
Figure 19: Classification report for training dataset ………..….……47
Figure 20: decision tree visualization…………..……….……….…..49
Figure 21: Snapshot of the initial design of MLTDD………..…51
Figure 22: Information Gain Ranking Filter………52
Figure 23: Snapshot MLTDD interface………...………53
Figure 24: Converting gender data to numeric data ………...….…55
Figure 25: Converting the age data ……….…………55
Figure 26: Apply and train CART algorithm ……….….……56
Figure 27: Setting button actions ………56
ix
List of Tables
Table 1: The confusion matrix for classifier ………. 21 Table 2: Thyroid Disease (ann) data set General information ……..….…28 Table 3: Thyroid Disease (ann) data set Attribute description …….…..…31 Table 4: Accuracy comparison for three algorithms...…..58 Table 5: Accuracy before and after eliminating Ten features………….…59
x
List of Abbreviations
EHR Electronic Health Record NWHIC National Women’s Health Information Center
WHO World Health Organization UK United Kingdom
US United States
GUI Graphical User Interface ML Machine Learning
UCI University of California of Iravin CRT Classification and Regression Trees WYSIWYG What-You-See-Is-What-You-Get PyDev Python Development
AI Artificial Intelligence
NLP Natural Language Processing PCA Principal Component Analysis kNN k-Nearest Neighbour
ID3 Iterative Dichotomiser 3 LDA Linear Discriminant Analysis MDA Mixture Discriminant Analysis QDA Quadratic Discriminant Analysis FDA Flexible Discriminant Analysis TRH Thyrotropin Releasing Hormone
xi
TSH Thyroid Stimulating Hormone FT4 Free T4
TDIDT Top-Down Induction of Decision Trees CHAID CHi-squared Automatic Interaction Detector IDE Integrated Development Environment NumPy Numerical Python
SciPy Scientific Python
SDK Software Development Kit CAS Computer Algebra System IP[y] Interactive Python
ANNs Artificial Neural Networks LVQ Learning Vector Quantization RBFN Networks, the Radial Basis Function
BPA Back propagation algorithm
CSFNN Conic Section Function Neural Network FBP Fast Back-Propagation
MLP Multi-Layer Perceptron
GDA-WSVM Generalized Discriminant Analysis-Wavelet Support Vector Machine
1
Chapter 1
Introduction
1.1 OverviewThe huge advancement of information technology, system integration techniques and software development have produced a new generation of complicated computer systems. Therefore, these systems have presented big challenges to computer engineering researchers. A good example of these complex systems is the healthcare system. Recently, it has been an increased interest to use the advancement of communication, data mining and machine learning technologies in healthcare systems. As a result, many countries are changing the way of organizing healthcare systems towards a global healthcare system across this country by setting healthcare standardization in communication and structuring(building) the electronic healthcare records.
The Electronic Health Record (EHR) is an organized collection of electronic health data about individual patients or some populations. It is qualified for sharing across healthcare providers in a certain country [1]. Health records normally contain a range of data including general medical records, medical history, patient examinations, laboratory results patient treatments, radiology images, allergies, immunization status, and some useful information for examination. Therefore, this valued information probably help researchers in examining and diagnosing diseases by using computer techniques. The use of EHRs may help in improving the quality of care, reducing the cost of legacy systems, and mobility of records.
Therefore, our aim in the current work is to investigate the aspects of utilizing the repository of health data for the benefit of humans by using machine learning. Our idea is to propose an automated method for diagnosing diseases based on previously stored
2
data and information. However, there are many problems related to effectively using this previously obtained patient data, which could make any electronic tool less efficient. Some of these problems are: the issue of huge features or attributes and how to select the most beneficial ones, the problem of missing values and how to process that, the problem of extracting accurate diagnostic markers that can predict the early start of the disease. This thesis will try to investigate some of these issues and propose predictive tool for thyroid gland disease diagnosis, based on the potential and the power of automated technologies and the previous patients or data. However, the scope of the thesis is exclusive to the problems outlined above, and does not include other equally important problems like privacy and security.
In this research, UCI repository will be used as our data sources for developing automatic machine learning tool, in order to produce useful predictive method for diagnosis thyroid gland disease. For Keeping track of the investigations for this project, the study used well-known datasets, which are publicly available for research purposes. It is planned, that the tool developed based on decision tree algorithm techniques, and validating on this dataset can be extended to real clinical environments.
1.2 Thesis Road Map
The thesis is organized into six chapters:
3
6: Discussion and Related Work.
After the introductory chapter (Chapter 1), which presents the problem description and the road map of thesis, Chapter 2 show the motivation and objectives of this work and the contribution to the scientific knowledge.
Chapter Three provides a review of machine learning techniques, and its application in the field of healthcare in addition to Machine Learning Algorithms. Chapter 4 describes the methodology used in this work. Chapter 5 presents the stages of designing a new app for thyroid gland diagnosis using machine learning techniques and the power of eclipse and python language. The idea is to obtain an intelligence app that combines the best performing learning algorithms and the powerful of GUI designing. Finally, Chapter 6 presents some of the conclusions generated from this work and scope for future work.
4
Chapter 2
Motivation and Research Objectives
2.1 Research motivationApproximately one-third of the world's population lives in countries in areas of iodine deficiency [2]. Some areas where the daily iodine intake is less than < 50 μg so goiter is usually endemic, and when the daily intake of iodine falls under <25 μg congenital hypothyroidism is seen. The spread of goiter in areas of significant iodine deficiency can be as high as 80%. Iodization programs are of proven importance in reducing goiter size also in preventing goiter development and finally the cretinism in children. The iodization programs can also involve thyrotoxicosis, especially in those aged under >40 years with nodular goiters. In iodine-replete areas, most people with thyroid disorders often have autoimmune disease, ranging between primary atrophic hypothyroidism, to Hashimoto's thyroiditis to thyrotoxicosis which caused by Graves' disease [3].
Regarding to Goiter and thyroid nodules the most common thyroid disease in the community is common physiological goiter. In some surveys, the prevalence of diffuse goiter turns down with age; the highest prevalence is in pre-menopausal women thus the ratio of women to men is at least 4:1 [4]. This is in contrast to the increase in spread of thyroid antibodies and thyroid nodules with age. A study shows that5234 subjects aged more than 60 years in (Massachusetts), clinically apparent thyroid nodules were existing in 1.5% of men and 6.4% of women [5]. The prevalence of solitary thyroid nodules was 3% and multinodular goiter was 1%.
In many early necropsy surveys, more than 50% of patients had thyroid nodules and between 20 and 76% of women have at least one thyroid nodule [2]. In a relative iodine deficiency area in Germany, thyroid nodules or goitre were found in 33% of 96 278
5
working adults of age between 18 and 65 years [6]. Thyroid nodules bigger than 1 cm were found in 12% of this population and this percentage increased with age. Patients with a single sensible nodule, 20–48% have additional nodules.
The clinical display of thyroid cancer is generally as a solitary thyroid nodule or increasing goiter size. Thyroid cancer is the most common malignant endocrine tumor and it has considers to cause >90% of the cancers of the endocrine glands in the United Kingdom [7]. The incidence of thyroid cancer is growing. In 2001, data from Cancer Research UK displayed 1200 new cases in England and Wales, according to a reported yearly incidence for the UK of 3.5 per 100 000 women and 1.3 per 100 000 men [8]. In 2012 according to world health organization WHO report Estimated age-standardized incidence is 298102 approx. 2.1% and mortality 39771 approx. 0.5% .After 5 years of prelevanec that would be 1206075 approx. 3.7 %. Rates due to thyroid cancer for both sexes as demonstrated in figur1 as a thousands and figure 2 as percentage [9].
Congenital hypothyroidism affects nearly one newborn in 3500–4000 births and is the most treatable reason of mental retardation [10]. There is a converse relationship between age when diagnosing congenital hypothyroidism and intelligence quotient in later life. In iodine-replete areas, about 85% of the cases are due to interrupted developmental defects of the thyroid gland (thyroid dysgenesis), or a complete absence of thyroid tissue (athyreosis). The rest of 15% have thyroid hormonogenesis failure caused by inheritance. A daily iodine intake less than <25 μg, particularly in preterm infants, founds in many cases in Europe, Africa and Asia. Clinical diagnosis occurs in <5% of newborns have hypothyroidism because signs and symptoms are often minimal. As a result, without prompt diagnosis and treatment, most affected children progressively develop growth failure, irreversible mental retardation and a variety of neuro psychological deficits.
6
Figure 1: Estimated Thyroid gland incidence and mortality rate.
Figure 2: Estimated Thyroid gland incidence and mortality rate as percentage
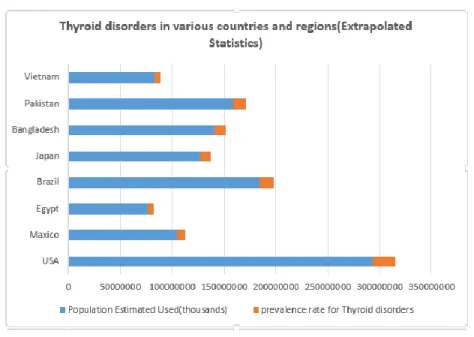
Technology availability is also a challenge that stands for countries. Figure3 attempts to extrapolate the prevalence rate for Thyroid disorders to the populations of different countries and regions. These prevalence extrapolations of Thyroid disorders are only estimates, based on applying the prevalence rates from the United States to the population of any other countries. The prevalence of Thyroid disorders is 20 million Americans (National Women’s Health Information Center (NWHIC), thus the prevalence Rate for
7
Thyroid disorders approx. 7.35% means1 in 13 or 20 million people in USA. Regarding to Undiagnosed Prevalence Rate for Thyroid disorders it is approx. 4.78% means 1 in 20 or 13 million people in USA.
As a result, lifetime risk for Thyroid disorders is 1 in 8 women during their lifetime in the United states according to (American Medical Women’s Association); 1 in 8 for women (NWHIC) [11].
Figure 3: Prevalence rate for Thyroid disorders of different countries
While thyroid gland disease is one of the most commonly reported disease, for which data were available, worldwide, thyroid gland cancer was the eighth estimated age-standardized incidence and mortality rates in women.
For all the previous reasons, these shortages in medical resources and the serious effect of the disease especially on newborns motivates us to look for more effective solutions for the benefit of society. As well as computer engineers can utilize the latest technologies
8
in machine learning science to generate models and methods that can assist physicians in the process of diagnosis and treatment.
2.2 Research objectives
The aims of this research work are:
- To find a new way to utilize patient’s histories, health information, and databases for detecting and diagnosing diseases, also provide predictive tool as medical professionals. This research is expected to establish an app that can assist physicians in diagnosing diseases and classifying patients in useful patterns based on different attributes, and how machine-learning techniques can be effective to identify such patterns. This can help in discovering early onset of the disease, treatment plans and identification of disease stages.
- To deal with large number of features and attributes in the dataset, and identify the significance of some features over others. However, large number of features can lead up to curse of dimensionality, also could render a machine learning algorithm or technique limited in terms of accuracy, specificity and precision. - To address an important issue related to making up a GUI combining with
machine learning algorithm, that can play an important role in determining the acceptability and ease of use achieved by designing technologies and machine learning algorithms.
Therefore, this thesis proposes new methods for investigate machine-learning techniques and develop machine-learning tool for providing predictive tool for thyroid gland disease diagnosis. This work envisages that the outcomes of this research in terms of an intelligent prediction app , with easy-use design of GUI , joining with decision tree algorithmic techniques, extracting significant ‘feature selection’ and using machine
9
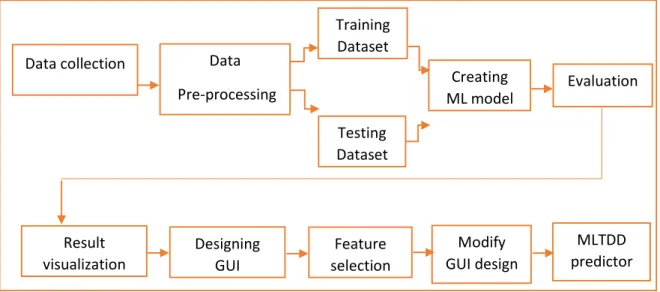
learning based classification can reinforce the accuracy with which hyperthyroidism and hypothyroidism or a normal condition of the dysfunction can be identified. Figure 4 shows our research method overview.
Figure 4: Research Method overview
To conclude, research objectives of this work is to utilize patient’s histories, health information, and databases from collection of databases at repositories for discovering signs for early of thyroid gland diagnosis with an integrated intelligent prediction app consisting of significant feature selection, and learning based classification. The research is expected to establish a tool or an app that can assist physicians in diagnosing diseases. The aim is to design an ML app that combines the human expertise with the technology intelligence to achieve diagnosis that is more accurate. This app may assist physicians in decision making, for better and effective treatment plans.
Data collection Data Pre-processing Designing GUI Creating ML model Evaluation Feature selection Result visualization MLTDD predictor 99 % acuuracy Modify GUI design Testing Dataset Training Dataset
10
2.3 Research Contribution
The aim of the current thesis is to analyze large data collected from university of California of Iravin (UCI) repository using machine-learning algorithms. The process of analyzing large amount of data includes some machine learning algorithmic techniques such as investigating better features selection techniques, and developing new machine learning based app for diagnosing the disease based on previous history information obtained from patients.
In terms of features selection techniques, the research applied features selection technique as a method to reduce the number of features in order to be able to design an acceptable GUI also to gain high quality attributes to improve the mining process. Features selection techniques effect all discipline that have need knowledge discovery from large data. The study found that features selection methods are capable of improving the interface of the proposed tool. However, features selection methods improve the performance of learning algorithms, and no single features selection method can best satisfy all datasets and learning algorithms. For this reason, machine-learning researchers should recognize the nature of datasets they studying and learning algorithm characteristics in order to obtain better outcomes.
In regards to diagnosis approaches, this work proposed an app for diagnosing thyroid gland based on machine intelligence and previous history. This app presented a method for thyroid gland diagnosis using a combination of a Classification and Regression Trees (CRT) and the feature selection method. In this approach, the purpose of CRT is to create a model that predicts the value of a target variable (class label) based on different input variables, and the purpose of information gain method is to reduce the number of input features. The experimental validation shows 99.7% accuracy, which confirms the capability of the proposed predictive tool.
11
With regard to programing the app, this work uses PyDev, which is a plugin that enables Eclipse to be utilized as a Python IDE ,supporting also Jython and IronPython [11]. It uses advanced type of inference techniques to provide features such code analysis and code completion, while still providing many others such as refactoring, a debugger, interactive console, etc. Combining with Qt Designer, which is Qt's tool for designing and building graphical user interfaces (GUIs) from Qt components. It enables compose and customize any widgets or dialogs in a what-you-see-is-what-you-get (WYSIWYG) manner, and experiment them using different styles and resolutions [12].
MLTDD is a useful tool to aid researchers in computer science and several other fields of science. Whether the target research is in medicine, business, agriculture, or industry; the requirement for analyzing large amount of data is needed. In addition to that, finding the most relevant feature selection technique that best satisfies a specific learning algorithm could benefits researchers. Therefore, the current work proposed a new app for diagnosis; the idea is to obtain an integrated app that combines the best performing learning algorithms technique and the best performing user Interface technologies with an experimental evaluation on the Ann thyroid gland Dataset. As a result using both human knowledge and machine learning ability offers the best performance.
12
Chapter 3
Background Study and Literature Review
3.1 Background studyGenerally, machine learning can be defined as a scientific scope that aims to design and develop algorithms that allow computers to learn from data and manage to solve a real time problem based on previous stored data or under a particular instructions and rules. One of various presentations of machine learning is data mining, which is the most used application of machine learning [12]. Data mining is a science to discover knowledge from databases. The database contains a collection of instances (samples or records). Each sample used by machine learning algorithms is formatted using same set of fields (inputs or variables, features or attributes). The process of machine learning with the class label (the correct output) of instances then the learning process is called the supervised learning. In contrast, when the instances does not contain the class label then the learning process is called unsupervised learning process. Clustering is a common unsupervised learning method. The purpose of clustering is simply to describe data. However, our focus in the current research is on supervised machine learning classification and regression as predictive methods [12].
3.2 Machine learning
Machine learning (ML) can be defined as a group of topics that concentrate on making and testing algorithms that can improve the process of classification, prediction, and pattern recognition, by using computer models obtained from previously stored data (existing data). Machine learning can produce classifiers and predictors to be used on the available resources (repositories). In addition, machine learning does not involve much human interaction. The objective behind finite human involvement is that the use of
13
automatic pre-programmed methods can minify human biases. The goal of the process is proposing the algorithm and its functionality to classify objects or predict new cases, which based on tough and reliable data [13].
Machine learning can be defined as the science of making computers act without being actually programmed. In the past decade, machine learning has provided for us lots of effective apps such as practical speech recognition, effective web search and autonomous or self-driving cars, and a widely improved understanding of the human genome (complete set of nucleic acid sequence for humans).
In the next section, we will present some of the various applications of Machine learning and the most effective machine learning techniques. More importantly, the gain of the practical know-how needed to speedily and powerfully apply these techniques to solve new problems [14].
3.2.1 Snapshot Applications of Machine Learning
Machine learning systems are learning programs automatically from data. This is often a very interesting alternative to manually constructing them, in the last decade; the use of machine learning has spread speedily throughout computer science. Machine learning algorithms are being applied in various fields in interesting ways. It is becoming increasingly popular with more and more applications in areas where we may not even
think of.
Below is a list of three of the most interesting applications. - Protecting Animals
An American research university in Ithaca, New York called Cornell University is working on an algorithm that can identify whales’ location in the ocean based on
14
audio recordings in order to ships can avoid hitting them. Further, Oregon State University is developing a software that can define and determine which bird species is/are based on a given audio recording collected in field conditions. - Predicting Emergency Room Wait Times
Patients who require to be seen in 1 to 14 minutes are being seen in nearly twice that timespan in about 37 minutes, according to the (The U.S. Government Accountability Office GAO) in 2009. Even worse, the patients mast of the times get fed up of waiting and may leave without getting medical treatment. However, healthcare organizations and health tech companies are using a technique called Discrete Event Simulation that can predict wait times for patients at emergency department waiting rooms. The algorithm to create a model uses factors such as patient data, emergency department charts, staffing levels, and even the system of the emergency room to predict wait times.
- Identifying Heart Failure
IBM with 1.28% researchers have found a way to read out heart failure diagnosis criteria from free-text physician notes. A machine learning algorithm is being developed in order to search through physicians free-form text notes in the (EHR) electronic health records and synthesize the text with “NLP Natural Language Processing”. By a similar to the job of a cardiologist who can read through another physician’s notes and determine whether a patient has heart failure, now computers can do the same task.
15
In the 2010s and 2020s, effectual, powerful analytics and machine learning are revolutionize industries, just as software revolutionized the world over the past 30 years [15].
3.3 Machine learning for Healthcare
Machine Learning is the most prevalent component of many creative software startups that are looking for re-define their markets. Similar to the way of healthcare, where great amounts of data are feeding medical scientists, drug makers and healthcare providers with information treasure that can be used to derive observation. In this part, we have selected four from several highly ranked healthcare companies that are innovating using machine learning.
MedAware offers innovative resolutions that save lives, significantly decrease healthcare costs and improve patient safety; the idea is based on identifying and preventing errors on prescription in real-time. MedAware’s technology uses machine learning algorithms with big data analytics to analyze large targeted data of Electronic Medical Records (EMRs), to learn automatically how doctors treat patients in real life.
Ginger.io is based on a predictive models; the focus of this company is on people with depression and anxiety. It uses a combination of data science, smartphone technology, and clinical services to create a personalized, fair way to deliver mental healthcare. With this company, patients will be able to psychoanalyze their mood over time, and receive extra mental health support as needed.
Wellframe is a startup company focused on building the following generation of infrastructure for healthcare delivery system using machine learning that offers a mobile-enabled care management platform. The company’s partners with leading health
16
providers and healthcare stakeholders to develop care management services to assist patients forward improved experience, care plan commitment and health outcomes. Lumiata provides predictive health analytics; it has developed the world’s first medical graph. This medical graph analyzes and organizes hundreds of millions of valuable data points, helping Lumiata to deliver real-time predictive analytics that assist hospital networks and insurance carriers to present higher quality care to extra patients in less time. It provides accurate predictions related to procedures, symptoms, medications, and diagnoses.
As machine learning techniques are applied to massive data that has appeared in recent years, there is the potential for massive innovations in healthcare. We will see how these four current leaders, and other startups, progress in the future [16].
3.4 Machine Learning Algorithms
In this part of research, the most popular machine learning algorithms has been presented. It is important to display the main algorithms in order to know the methods available. It can feel confused when algorithm names are available, but this part is expected to just give a brief description of what they are and where they fit.
There are two approaches to categorize the algorithms; the first approach is a grouping of algorithms by similarity in function or form. The second approach is a grouping of algorithms by the learning style. Both methods will be presented as well as variety of different algorithm types.
3.4.1 Algorithms Grouped by Learning Style
Different ways are available for an algorithm which can follow to model a problem; based on its input data which can be called as environment or interaction with the experience.
17
There are three main learning styles (learning models) and they will be presented in this section with some examples of algorithms. This way of organizing machine-learning algorithms (taxonomy) is useful because it forces us to think about two important factors which are; the roles of the input data and the model making process and then select the most suitable for the problem to get the best result. The following are three different learning styles in machine learning algorithms:
First: Supervised Learning
In supervised learning the input data or training data has a known target variable. A model is prepared through a process called (training process) then it is used to make predictions, as shown in figure 5. The training process goes on until a good accuracy can be obtained.
Figure 5: Supervised Learning algorithms
The main two problems are classification and regression. Example algorithms include Support Vector Machines , Nearest Neighbors, Logistic Regression and Naive Bayes .Supervised Learning and classification problem will be presented in details in the next section.
18
Second: Unsupervised Learning
In unsupervised learning, the Input data does not have class label or a known result, as shown in figure 6.
Figure 6: Unsupervised Learning algorithms Third: Semi-Supervised Learning
In semi-supervised learning, some of the input data has a target variable and the rest is unlabeled samples. The model has to learn the structures to organize the data in order to make predictions. It deals with classification and regression problems.
3.4.2 Algorithms Grouped By Similarity
Algorithms are grouped by similarity according to their function (how they work). This is the most useful way (approach) to group algorithms. In this section, we present several of the common machine leaning algorithms grouped by similarity in eleven different groups:
- Regression Algorithms - Instance-based Algorithms - Regularization Algorithms
19
- Decision Tree Algorithms - Bayesian Algorithms - Clustering Algorithms
- Association Rule Learning Algorithms - Artificial Neural Network Algorithms - Deep Learning Algorithms
- Dimensionality Reduction Algorithms - Ensemble Algorithms [17].
3.5 Classification
Classification and regression are the most popular models in supervised learning. This research will concentrate on classification. However, it is necessary to distinguish between them. While regression algorithms attempt to predict the target values of the instances, most probably would be continues value. Regression is used to model the relationship between a target variable and a set of predictor variable. This relationship is considered as a function that predicts the target variable using the predictor variables as inputs. On the other hands, classifiers can categories the input instances into pre-defined classes, for instance, a classifier can predict a new patient if it is healthy or malignant (suffer from a certain disease) [18].
Classification is the process of learning the goal function that maps between a set of instances (inputs) and a predefined class labels (output target). The input data for the classification is a set of samples, which called instances. Each instance is a record of data in the form of (𝒙, y) ,where 𝒙 is the features set and 𝒚 is the target variable (class label).
20
Classification model can be a tool that used to describe data (Classifier or Descriptive Model) or a tool to predict the class or target variable for new instance (Predictive Model) [19].
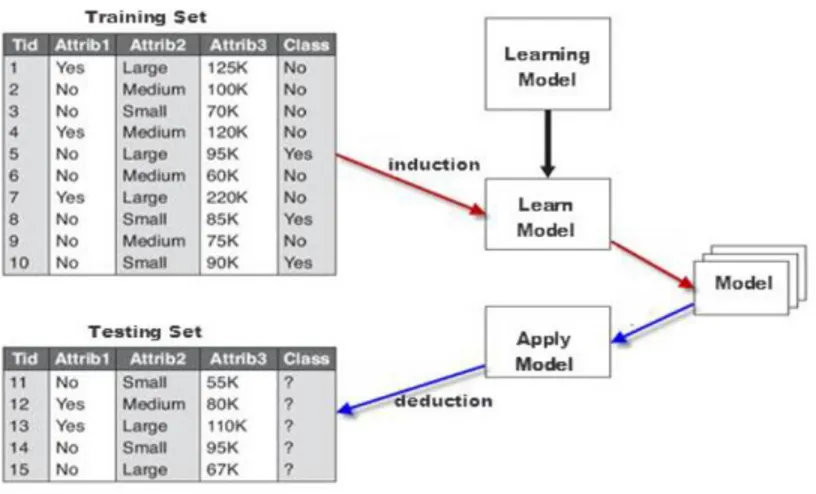
The overall approach for solving classification problem is shown in Figure 7. The training data contains instances whose output or class labels are known. The classification model can be built based on the training data. The model then can be tested and evaluated by using the testing data which consists of records with missing class labels. The evaluation of model performance is based on the number of testing instances that are correctly predicted [19]. The outcome of performing the model on the testing data produces the confusion matrix.
Figure 7: General approach for building a classification model
Assume the goal is to classify some objects 𝒊=𝟏,…., 𝒏 into 𝒌 predefined classes, where 𝒌 represent the number of classes. For example, if the aim of classification is to diagnose a patient whether or not suffering from thyroid gland disorder then the value of 𝒌 will be 2 corresponding to either thyroid disorder or normal.
21
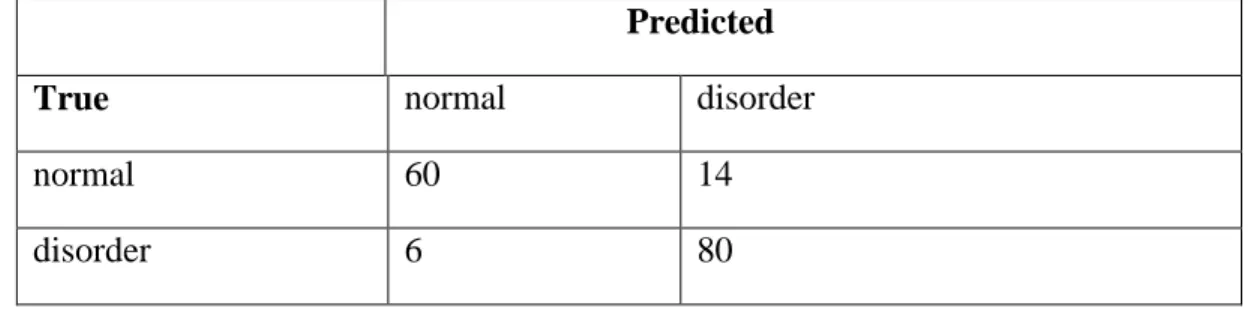
Database (available data) can be organized as 𝒏 𝒙 𝒑 matrix 𝑿, where 𝒙𝒊𝒋 represent the feature value 𝒋 in the record 𝒊. Every row in the matrix 𝑿 is represented by a vector 𝒙𝒊 with 𝒑 features and a class label 𝒚𝒊. The classifier can be denoted as (𝒙). One method to evaluate the classifier is by calculating the error estimation based on the confusion matrix. To clarify and explain the error estimation, let us consider an example. Suppose the aim of a certain classifier (𝒙) is to train and test input vectors 𝒙 into two possible classes normal and disorder. Suppose the result of classification of the classifier (𝒙) on vectors 𝒙 is as shown in the confusion matrix in Table 1.
Predicted
True normal disorder
normal 60 14
disorder 6 80
Table 1: The confusion matrix for classifier cl(x) on matrix X
Er is the error rate of algorithm, which calculated as the total number of incorrect classified samples divided by the total number of records in the matrix X. In our example, Er = (14 + 6) / 160 = 0.125. At the same time, to calculate the classification accuracy of the model
22
Chapter 4
Research methodology
4.1 Thyroid gland disorderThis part of research presents, thyroid disorders, which are conditions that affect the thyroid gland. A description of Thyroid gland and how does it work has been explained as well as the thyroid hormones effectiveness and how the thyroid has significant roles to regulate many metabolic processes throughout the body. Various types of thyroid disorders affect either its function or structure.
4.1.1 Thyroid gland system
The thyroid gland is an organ located in the base of your neck; it is a butterfly-shaped. It releases hormones that control metabolism: Metabolism—the way your body uses energy— this involves heart rate and how quickly the body uses calories from the eaten food . Metabolism can be interpreted as a collection of chemical reactions that takes place in the body's cells. The process of metabolism converts the fuel in the food into the energy needed to power our activities, from growing to moving to thinking. The chemical reactions of metabolism controlled by specific proteins in the body, and each chemical reaction is coordinated with a particular body functions. In fact, thousands of metabolic reactions happen to keep our cells working and healthy. The thyroid's hormones regulate numerous body functions, including:
Breathing
Muscle strength
23
Cholesterol levels
Body weight
Body temperature
Menstrual cycles
The thyroid gland longs about 2-inches and lies in front of your throat. The thyroid has two sides known as lobes that lie on either side of your windpipe, and is connected by a strip of thyroid tissue called an isthmus. Some people have two separate thyroid lobes instead of an isthmus [20].
The endocrine system, which is made up of glands that produce, store, and release significant hormones into the bloodstream in order to enable hormones to reach the body's cells. The thyroid is part of the endocrine system and it gets iodine from the foods we eat and uses it to make two main hormones:
- Triiodothyronine (T3) - Thyroxine (T4)
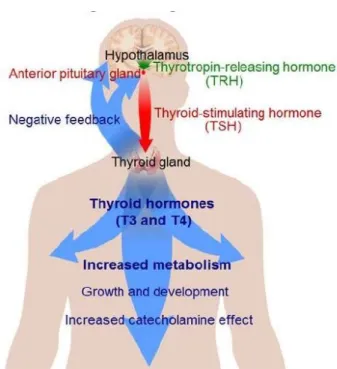
It is so important that T3 and T4 levels are in regular level (neither too high nor too low). Two glands in the brain—the hypothalamus and the anterior pituitary gland communicate to maintain T3 and T4 balance.
The hypothalamus produces TSH Releasing Hormone (TRH) that sends signals the pituitary to stimulate the thyroid gland to produce more or less amount of T3 and T4 by increasing or decreasing the release of (TSH) thyroid stimulating hormone as shown in Figure 8.
24
Figure 8: Thyroid system
- If T3 and T4 levels are low in the blood, the pituitary gland releases more TSH to stimulate the thyroid gland to produce more thyroid hormones.
- When T3 and T4 levels are high, the pituitary gland releases less TSH to stimulate the thyroid gland to slow production of these hormones.
4.1.2 Effects of Thyroid Hormones
T3 and T4 travel in bloodstream to reach almost every cell in the body. The hormones regulate the speed with which the cells or the metabolism works. For example, T3 and T4 regulate heart rate. Therefore, if T3 and T4 levels are low, the heart rate may be slower than normal; also that low level may cause constipation/weight gain. If T3 and T4 levels are high, a person may have a rapid heart rate and diarrhea/weight loss.
25
4.1.3 Thyroid Diseases
There are specific kinds of thyroid diseases that includes:
- Functional disorders
o Hypofunction - Hypothyroidism
Hypothyroidism, also well known as underactive thyroid disease, is a common disorder in which thyroid gland does not produce enough amount of thyroid hormone. It can cause a number of symptoms, such as weight gain, a feeling of tiredness, depression, and poor ability to tolerate cold. Occasionally there may be swelling in the front side of the neck because of goiter. Untreated hypothyroidism during pregnancy can cause delays in growth and intellectual development in the baby, which is known as cretinism.
Worldwide, most common cause of hypothyroidism is too little iodine in the diet. In countries where enough iodine in the diet, the most common cause of hypothyroidism is (Hashimoto's thyroiditis) the autoimmune condition. Some less common causes are: injury to the hypothalamus or the anterior pituitary gland, previous treatment with radioactive iodine, certain medications, previous thyroid surgery or a lack of a functioning thyroid at birth. The diagnosis of hypothyroidism can be approved with blood tests measuring (TSH) thyroid-stimulating hormone and thyroxine levels.
o Hyperfunction - Hyperthyroidism
Hyperthyroidism is a condition of the thyroid produces too much of one of the two primary hormones (tetraiodothyronine T4 and triiodothyronine T3) or both. This can cause elevated blood pressure, rapid heart rate and hand tremors, as well as many other symptoms. Diagnosis of the overactive thyroid and treatment of the underlying cause can minify symptoms and stop complications. Several conditions can cause hyperthyroidism. The most
26
common cause is Graves' disease, which is an autoimmune disorder where antibodies stimulate the thyroid to secrete too much hormone. It occurs more often in women than in men. Other causes of hyperthyroidism can include: excessive iodine (the main key ingredient in T4 and T3) / inflammation of the thyroid (thyroiditis) that lead to leaking of T4 and T3 of the gland / benign tumors of the thyroid or pituitary gland / large amounts of tetraiodothyronine taken from medication or dietary supplements.
- Nodular abnormalities - Goiter
A goiter is an enlarged thyroid gland. When the gland turns into enlarged because of diseases or tumors, then it is referred to as a goiter. That can be associated with over-function of the thyroid gland or with under-function of the gland. In addition, both inflammation and tumors can cause a goiter. Sometimes, the whole gland may be enlarged, while in other goiters, nodules, or enlargement may occur in one part of the gland only.
- Thyroid nodules
Nodules are lumps that generally arise within a normal thyroid gland. Commonly these abnormal growths can be felt as a lump in the throat since are located at the edge of the thyroid gland.
- Deficiencies
Hashimoto's disease: Is an autoimmune disease, a disorder in which the immune system turns against the body's tissues. In patients with Hashimoto's, the immune system attacks the thyroid gland and this can lead to several deficiencies on the gland. - Thyroid cancer
Cancer of the thyroid gland is a disease in which malignant cells are found in the tissues of the thyroid gland. Thyroid cancer is more common in women than in men. Age average of most patients is between 25 and 65 years old. Patients who have had
27
radiation treatment due to medical problems in the neck or head so they have been exposed to large amounts of radiation have a higher chance of getting cancer on thyroid gland [21].
4.2 Description of data set 4.2.1 General Description
This research relied an option of utilizing online databases. Online databases are collected from clinical environment and are available publicly, freely for research proposes. Furthermore, they have undergone proper organizational ethics approval processes. The advantage of using online databases is the ability to compare our work and the existing works by using the same databases.
UCI machine learning repository is one of the most popular machine learning repositories, which is a collection of data generators and databases that are used by machine learning researchers to train and test algorithms of machine learning. The repository was created in 1987 by David Aha and fellow graduate students at University of California, Irvine (UC Irvine). Since that time, this repository has been widely used by educators, students, and researchers all over the world as a reliable source of machine learning databases.
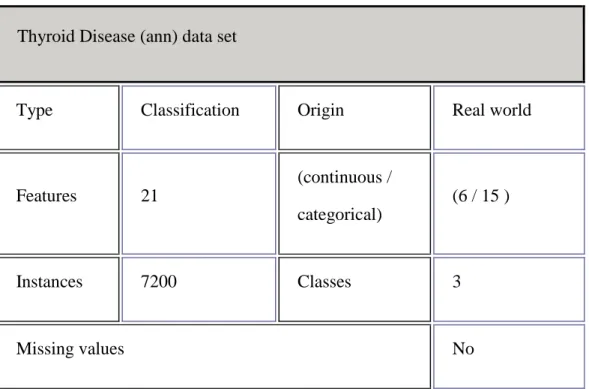
This research has used the dataset (ann-thyroid dataset) from UCI repository. It consists of 7200 instances and (3) classes, 3772 are training instances, 3428 testing are instances and 21 attributes as shown in Table 2 [23]. The task is to detect whether a given patient has a normal condition (1) or suffers from hyperthyroidism (2) or hypothyroidism (3).
28
Thyroid Disease (ann) data set
Type Classification Origin Real world
Features 21 (continuous / categorical) (6 / 15 ) Instances 7200 Classes 3 Missing values No
Table 2: Thyroid Disease (ann) data set General information
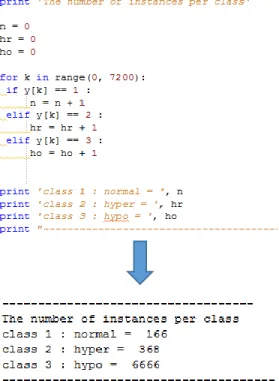
Figure 9 shows a code in python language has been used initially build in at our project to account the number of patients who have normal condition of thyroid functionality and patients with hyperthyroidism as well as patient with hypothyroidism.
29
Figure 9: Python code to get the number of instances per class 4.2.2 Attribute Description
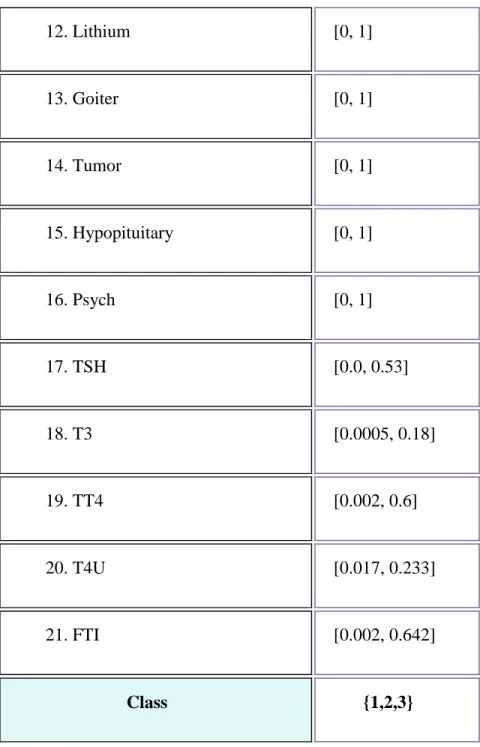
This section describes the main characteristics of the thyroid data set and its attributes: Each measurement vector consists of 21 values – 15 binary and 6 are continuous. The binary attribute values are mapped to zero and one where zero refers to False and one refers to True. Each of the measurement vectors belongs to one of three different classes, which are either hyper-thyroidism, hypo- thyroidism or normal function of the thyroid gland (Table 3).
30 Attribute Domain 1. Age [0.01, 0.97] 2. Sex [0, 1] 3. On_thyroxine [0, 1] 4. Query_on_thyroxine [0, 1] 5. On_antithyroid_medication [0, 1] 6. Sick [0, 1] 7. Pregnant [0, 1] 8. Thyroid surgery [0, 1] 9. I131_treatment [0, 1] 10. Query_hypothyroid [0, 1] 11. Query_hyperthyroid [0, 1]
31
Table 3: Thyroid Disease (ann-thyroid) data set Attribute description.
12. Lithium [0, 1] 13. Goiter [0, 1] 14. Tumor [0, 1] 15. Hypopituitary [0, 1] 16. Psych [0, 1] 17. TSH [0.0, 0.53] 18. T3 [0.0005, 0.18] 19. TT4 [0.002, 0.6] 20. T4U [0.017, 0.233] 21. FTI [0.002, 0.642] Class {1,2,3}
32
The table above illustrates the domain of each attribute, python language has been used to find out the minimum and maximum value of each attribute, figure 10 shows that.
Figure 10: Python code to get the domain of each attribute 4.2.3 Data set visualization
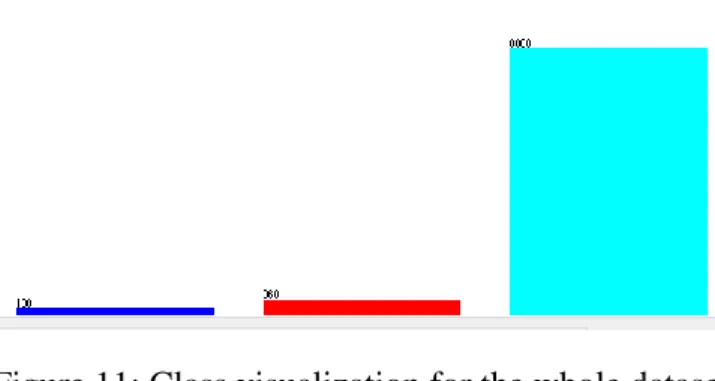
The following figure (Figure 11) shows visualization for the dataset, it has been observed that from 7200 instances there are 166 normal, 368 hyperthyroidism and 6666 hypothyroidism.
Figure 11: Class visualization for the whole dataset
As a result, in this particular dataset most patients have a hypothyroidism disease whereas a small number of them have a normal thyroid gland condition.
33
4.3 Decision Tree algorithm
Always a code is needed to tell a computer what to do but an algorithm is necessary before writing that code. An algorithm can be defined as a list of rules to follow in order to solve a problem.
4.3.1 Decision tree representation
A decision tree is a flowchart it has a tree structure, where each interior node (non-leaf node) represents a test on attribute, every branch symbolizes an outcome of the test, the nodes that holds a class label called leaf node or (terminal). The topmost node known as (the root node). The goal is to create a model that predicts the value of a target variable based on input variables.
A tree is "learned" by splitting the origin data set into subsets based on an attribute value test. Then this process is done on each obtained subset in a recursive manner know n as (recursive partitioning). The recursion ended whenever the subset at a node has the same value of the class variable. This kind of process is called (TDIDT top-down induction of decision trees) , it is the most common approach for learning decision trees from data. Decision trees can be described on data mining as the combination of mathematical and computational techniques to extract the description, categorization and generalization of a given set of data.
34
The dependent variable, Y, is the class label (target variable) that we are trying to understand, generalize and classify. The vector x is consist of the input variables, x1, x2, x3 etc.., which are used for that task [25].
4.3.2 Decision tree types
There are two main types of decision trees:
Classification tree: the goal is to predict the class to which the data belongs.
Regression tree: the predicted outcome considered as a real number.
The term Classification And Regression Tree (CART) is an overall term used to refer to both of the above procedures. Regression trees and classification trees have some similarities and some differences as well.
Some techniques, known as ensemble methods, structure and builds multiple decision trees (more than one ) such as Bagging, A Random Forest, Boosted Trees and Rotation forest .
Decision tree learning is the construction of a decision tree from class-labeled training tuples. Decision list is a special case of a decision tree, which is a one-sided decision tree where each internal node has exactly 1 leaf node and only 1 internal node as a child unless the bottommost node, where a single leaf node is its only child . Decision lists are easier to understand than general decision trees .
Here are some notable decision-tree algorithms:
ID3 (Iterative Dichotomiser 3)
35
CART (Classification And Regression Tree)
CART and ID3 were invented at nearly the same time (between 1970 and 1980), and follow a similar approach which is learning decision tree from training data [25].
4.3.3 Decision tree Metrics
For constructing decision trees, the algorithms usually work top-down, by selecting a variable at each step that best splits the set of data (items). Various algorithms use different metrics in order to measure "best". These generally focus on measuring the homogeneity of the target variable with the subsets. By applying these metrics to each candidate subset, the resulting values are combined to provide a measurement of the quality of the split.
The first metrics is Gini impurity
Generally used by the CART (classification and regression tree) algorithm, it is a measure of how often a (randomly chosen element) from the set would be incorrectly labeled. Gini impurity can be computed by summing the probability of each item being chosen times the probability of a error in categorizing that item.
We can see from Eq. (1) that to compute Gini impurity in a set of items, assume , and let be the portion of items labeled with value in the set.
The second metrics is Information gain
Commonly used by the ID3, C4.5 algorithms. It is based on entropy concept from information theory.
36
Defined as in Eq. (2):
From Eq. (3) we calculate Information Gain = Entropy (parent) - Weighted Sum of Entropy (Children)
4.3.4 Popular Decision Tree Classification & Regression Trees (CART)
In this part of research, we discuss the CART decision tree (Classification and Regression Tree), classification and regression trees are common machine-learning methods with the objective of constructing (Prediction models) that predicts the value of a dependent variable, which called target according to the values of independent variables (input data). In 1984 the CART Trees methodology was introduced, and that was by Leo Breiman, Jerome Friedman, Richard Olshen and Charles Stone as an overall term to refer to the two types of decision trees:
Classification Trees: Generally, the target variable is categorical (sometimes called a nominal variable) is one that has two or more categories, and the tree is used to identify the "class" for which a target variable belongs to.
Regression Trees: The target variable is mostly continuous which means that the variable can use any value between its minimum and its maximum, and tree is used to predict its value.
The structure of CART algorithm is like a sequence of questions, so that the answers to which determine what the next question. The outcome of these questions is a structure
(2)
37
shapes like tree where the ends called terminal nodes at any point where no more questions [27].
Here are some useful features and advantages of CART:
CART has the capability, which enable it to use the selfsame variables more than one time in different parts of the tree.
CART is nonparametric so it does not rely on data belonging to a specific type of distribution.
CART combines both testing with a test data set and cross-validation to estimate the goodness of fit more accurately.
CART can be used with other prediction methods to pick the input set of variables.
Outliers in the input variables do not significantly affect CART [28].
CART classification algorithm which is based on decision tree induction (Jiwai H. and Micheline Kamber,2009) which is a learning of decision trees from class label training tuples. The Classification and Regression (CART) tree method uses recursive partitioning to split the training records data into segments with analogous output field values. The CART tree node begins by examining the input fields to detect the best split, scaled by the reduction in an impurity index that outcomes from the split. CART uses Gini index splitting records measures in choosing the splitting attribute. Then pruning is done in CART by using a training data set. That split defines two subgroups; each of them will subsequently split into two more subgroups, until one of the stopping standard is moved. All splits are binary (only two subgroups).
38
Algorithm 1 has been used for the construction of the decision tree [29]. Input is Data partition say (D) which is (training dataset).
Attribute list is Attribute selection method. Output will be Decision tree.
Algorithm 1: Algorithm used for the construction of the decision tree Create a root node assume(N);
If tuples in (D) are all of the same class, assume (C) then Return (N) as a leaf node labeled with the class (C); If the attribute list is empty, then
Return (N) as a leaf node labeled with the majority class in (D);
Apply feature selection method to find the best splitting rule; Label node (N) with splitting criterion;
Attribute list equal to attribute list – splitting attribute; Then For each outcome assume ‘j’ of splitting criterion
Let ‘Dj’ be the set of data tuples in (D) satisfying outcome j; If ‘Dj’ is empty, then
Attach a leaf node labeled with the majority class in (D) to root node (N);
Else, attach the node returned by producing decision tree to root node (N);
End for
39
Chapter 5
Developing a ML tool for Thyroid Disease Diagnosis (MLTDD)
5.1 Machine learning in PythonMachine Learning in Python displays how to achieve a successful data analyzing using machine learning algorithms, also how to apply them using Python [30].
5.1.1 Python programming language
Python is an open source programming language; it has two important advantages, look good and easy to read. Guido van Rossum is the programmer who made it in 1991. It is named after "Monty Python's Flying Circus” which is a television show.
Python is an interpreted language. The term (Interpreted languages) refers to kind of languages which do not need to be compiled to run. An interpreter, which is a special program, will run python code on any kind of computer. Another feature; if the programmer needs to change the code they can immediately see the results. On the other hand, Python is slower than a compiled language like C or C++ because it is not running machine code directly. However, Python is a good programming language for beginners. Writing programs in Python takes less time than in another language. It is a high-level language, where a programmer can focus on what to do instead of how to do it. Python got inspiration from previous programming languages like C, C++, Java, Perl, and Lisp. Python 2.7 has been used for this project [31].
40
5.1.2 Python IDE (Integrated development environment)
Python programmer mainly looking for a robust library that can be used to bring machine learning into a production system, in this work the library that has been seriously considered is spyder.
One of the Scientific Python Development Environment for python is spyder; with advanced editing, reactive testing, debugging and examination features, it is definitely a powerful interactive development environment for the Python language. Furthermore, it is a numerical computing environment because of the support of IPython and popular Python libraries such as NumPy, SciPy or matplotlib.
There are various libraries working with spyder, here is a list of the most common libraries:
NumPy (Numerical Python): Base n-dimensional array package, NumPy is the essential package for scientific computing with Python.
SciPy (Scientific Python): Fundamental library for scientific computing. Matplotlib: Matplotlib is a Comprehensive and interactive python 2D plotting
library, which makes figures in interactive environments through platforms. Matplotlib can be used in web application servers, python scripts, the python and IPython, and six graphical user interface toolkits.
IPython IP[y] (interactive Python interpreter): Enhanced interactive console which provides a rich architecture for interactive computing with:
o A powerful interactive shell.
o Support for interactive data visualization and use of GUI toolkits. o High performance and easy to use tools for parallel computing.
Pandas: Pandas is an open source, data structures and analysis library adding easy-to-use, high-performance, data analysis and data structures tools for the Python programming language.
Scikit-learn: is a free software machine-learning library for the Python programming language. It presents various classification, regression and clustering algorithms involving support vector machines, gradient boosting and
41
k-means, in addition to its design in order to interoperate with the Python scientific and numerical libraries SciPy and NumPy.
Scikit-learn in general written in Python, with some core algorithms (algorithms that are designed to process too large amount of dada and allow it to fit into a computer's main memory at one time) written in Cython to achieve performance.
Spyder 2.3.7 has been used in this work, pandas, Scikit-learn, NumPy and matplotlib has been used in this project [32].
5.2 Applying CART algorithm
At this stage, the data are ready for applying the algorithm. The testing data will be used to evaluate the classifier. This work proposed CART algorithm.
5.2.1 Algorithm fitting
The first step is to import all the required Python libraries to the program (spyder) as shown in figure 12.
Figure 12: importing the required Python libraries
The next step is to load the thyroid data set and store the input data and target values in X and Y variables. The X value has 7200 rows and 21 columns, and Y value has 7200 rows and 1 column.
42
Figure 13 shows how to convert thyroid.data into a pandas data frame. At first print the column names are just numbers, as it can be seen replacement those numbers with the feature names has been done.
Figure 13: Converting the dataset into a pandas frame
The next step is to print out the dataset as shown in figure 14.
Figure 14: Sample of Ann-Thyroid Diagnosis dataset
Matplotlib library has been used to visualize class label and create a histogram of ann dataset as sown in figure 15.
43
Figure 15: Histogram for Ann_tyroid dataset
Usually a dataset is divided into two datasets training and testing (sometimes it is called a validation set ' instead), a training set is implemented to train the classifier (to build up a model), whereas a test (or validation) set is to validate the model built (to test the performance of your classifier). Applying heuristics such as 10% testing and 90% training can bias the classification results and the results may not be generalizable. However, the training set can be nominated by applying a random filter to the data, for instance, select 80% of the points at random to generate the model and test against the remaining 20%. An accepted method is N-Fold cross validation, in which the dataset is been randomized and create N (nearly) equal size partitions. Then select Nth partition as testing and N-1 partitions for training the classifier. The perfect method is to employ another K-fold cross validation to generate a validation set and obtain the best parameters and repeat this process N times to find out an average of the metric. To be especially careful, doing this multiple times is required, by selecting different random training sets and compare the models obtained.