40
Turkish Journal of Field Crops 2013, 18(1), 40-45
FORAGE YIELD AND QUALITY OF PERENNIAL RYEGRASS
(Lolium perenne L.) LINES IN THE BLACK SEA
COASTAL AREA OF TURKEY
Mustafa SURMEN1*, Tamer YAVUZ2, Sebahattin ALBAYRAK3, Necda CANKAYA4 1
Igdir University, Faculty of Agriculture, Department of Field Crops, Igdir, TURKEY 2
Ahi Evran University, Faculty of Agriculture, Department of Field Crops, Kırsehir, TURKEY 3
Suleyman Demirel University, Faculty of Agriculture, Department of Field Crops, Isparta, TURKEY 4
Black Sea Agricultural Research Institute, Samsun, TURKEY *
Corresponding author: [email protected] Received: 01.06.2012
ABSTRACT
In present study, perennial ryegrass (Lolium perenne L.) lines were developed by using the half sib family selection breeding method. The aim of this research was to determine the forage yield and quality of perennial ryegrass breeding lines. The experiment of design was a Randomized Complete Block Design with three replications in 2009-2011. In this research, significant differences were determined among dry matter yield (DMY) (420-629 kg/da), crude protein content (CPC) (9.43-12.09%), crude protein yield (CPY) (45.07-75.21 kg/da), acid detergent fiber (ADF) (37.24-40.36%), neutral detergent fiber (NDF) (55.31-58.52%), total digestible nutrient (TDN) (49.24-53.27%), relative feed value (RFV) (92.19-98.57%), potassium (0.44-0.71%), calcium (0.42-0.61%), magnesium (0.22-0.27%) and tetany ratio (0.85-1.38). According to results it was decided that 3, 13, 14 and 17 numbered perennial ryegrass lines were selected to test in Regional Yield Experiments.
Key words: Lolium perenne, perennial ryegrass, dry matter yield, crude protein
INTRODUCTION
Breeding of new herbage varieties should be based on livestock responses (Casler and Vogel, 1999; Wilkins and Humphreys, 2003). Grass is a very important source of nutrients for domesticated ruminants as it forms a big portion of their diet for a large part of the year (Taweel et al. 2005). Perennial ryegrass (Lolium perenne L.) is one of the most important forages for dairy cows in temperate regions because it has a high forage yield and nutritive value, and, hence, provides a cheaper feed than silage or concentrates (Smit et al. 2005). Perennial ryegrass has the highest nutritive value of the temperate grasses with a metabolizable energy concentration of dry matter under appropriate environmental and management conditions (Turner et al. 2006). Traditionally, perennial ryegrass cultivars were mainly bred for high forage production. However, there were no improved perennial ryegrass cultivars in Turkey for forage production. In present study, perennial ryegrass (Lolium perenne L.) seeds were collected from Black Sea Coastal Region in 2002. Then, 18 lines were obtained using half sib family selection breeding method. Yield experiment was established in 2009. The aim of the present research was to determine forage yield and quality of perennial ryegrass lines.
MATERIALS AND METHODS
Perennial ryegrass (Lolium perenne L.) seeds were collected in the Black Sea Coastal Region in 2002 and the collected seeds were sown and observed according to growing status. In 2003, perennial ryegrass plants were selected based on the flowering, status of stem (thick or thin), and leaf size and width. In 2004, quintet group were constituted for using half sib family selection breeding method. Total 18 groups were constituted. They were closed by cloth in flowering stage against the cross pollination. This proceeding was applied in four years. After the perennial ryegrass seeds were increased, yield trial was established in 2009. Total selected 18 lines and 2 standard cultivars (Liprinta and Lipresso) were used as experimental material.
Field studies were conducted at Black Sea Agricultural Research Institute (15 km east of Samsun, Turkey) in Çarşamba plain (elevation 4 m). The trials were carried out for two growing seasons (2009-2010 and 2010-2011) on clay-loam soil. Soil pH was 6.9; organic matter 1.98 g kg-1;available P, 21 g kg-1; available K, 94 g kg-1. The monthly total rainfall and mean temperature for November through June was 755 mm and 13.0 °C in 2009-2010 and
41
785 mm and 11.6 °C in 2010-2011. The 30-yr mean for the same months was 562 mm and 11.8°C.
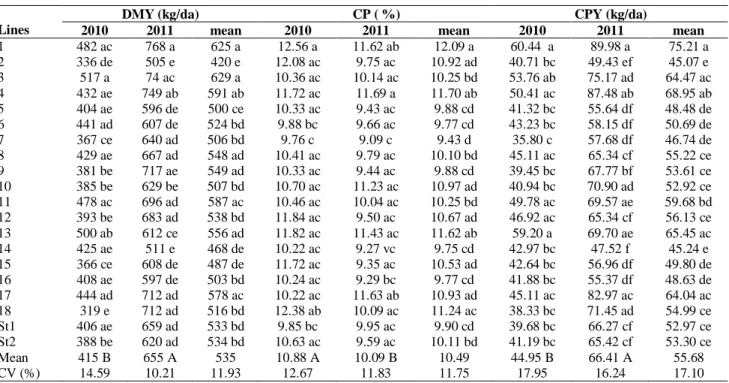
Table 1. Dry mater yield (DMY), crude protein content (CP) and crude protein yield (CPY) of perennial ryegrass lines.
Lines
DMY (kg/da) CP ( %) CPY (kg/da)
2010 2011 mean 2010 2011 mean 2010 2011 mean
1 482 ac 768 a 625 a 12.56 a 11.62 ab 12.09 a 60.44 a 89.98 a 75.21 a 2 336 de 505 e 420 e 12.08 ac 9.75 ac 10.92 ad 40.71 bc 49.43 ef 45.07 e 3 517 a 74 ac 629 a 10.36 ac 10.14 ac 10.25 bd 53.76 ab 75.17 ad 64.47 ac 4 432 ae 749 ab 591 ab 11.72 ac 11.69 a 11.70 ab 50.41 ac 87.48 ab 68.95 ab 5 404 ae 596 de 500 ce 10.33 ac 9.43 ac 9.88 cd 41.32 bc 55.64 df 48.48 de 6 441 ad 607 de 524 bd 9.88 bc 9.66 ac 9.77 cd 43.23 bc 58.15 df 50.69 de 7 367 ce 640 ad 506 bd 9.76 c 9.09 c 9.43 d 35.80 c 57.68 df 46.74 de 8 429 ae 667 ad 548 ad 10.41 ac 9.79 ac 10.10 bd 45.11 ac 65.34 cf 55.22 ce 9 381 be 717 ae 549 ad 10.33 ac 9.44 ac 9.88 cd 39.45 bc 67.77 bf 53.61 ce 10 385 be 629 be 507 bd 10.70 ac 11.23 ac 10.97 ad 40.94 bc 70.90 ad 52.92 ce 11 478 ac 696 ad 587 ac 10.46 ac 10.04 ac 10.25 bd 49.78 ac 69.57 ae 59.68 bd 12 393 be 683 ad 538 bd 11.84 ac 9.50 ac 10.67 ad 46.92 ac 65.34 cf 56.13 ce 13 500 ab 612 ce 556 ad 11.82 ac 11.43 ac 11.62 ab 59.20 a 69.70 ae 65.45 ac 14 425 ae 511 e 468 de 10.22 ac 9.27 vc 9.75 cd 42.97 bc 47.52 f 45.24 e 15 366 ce 608 de 487 de 11.72 ac 9.35 ac 10.53 ad 42.64 bc 56.96 df 49.80 de 16 408 ae 597 de 503 bd 10.24 ac 9.29 bc 9.77 cd 41.88 bc 55.37 df 48.63 de 17 444 ad 712 ad 578 ac 10.22 ac 11.63 ab 10.93 ad 45.11 ac 82.97 ac 64.04 ac 18 319 e 712 ad 516 bd 12.38 ab 10.09 ac 11.24 ac 38.33 bc 71.45 ad 54.99 ce St1 406 ae 659 ad 533 bd 9.85 bc 9.95 ac 9.90 cd 39.68 bc 66.27 cf 52.97 ce St2 388 be 620 ad 534 bd 10.63 ac 9.59 ac 10.11 bd 41.19 bc 65.42 cf 53.30 ce Mean 415 B 655 A 535 10.88 A 10.09 B 10.49 44.95 B 66.41 A 55.68 CV (%) 14.59 10.21 11.93 12.67 11.83 11.75 17.95 16.24 17.10
Means followed by the same letter and column are not significantly different at p= 0.05 level.
The field trial was conducted in a Randomized Complete Block Design, with 3 replications. Plots were established on November in 2009. Each plot consisted of 6 rows, 4 m in length. The row spacing was 20 cm. The seeding rate was 2 kg/da. The plots were harvested on 25 May and 22 June of 2010 and on 23 May and 17 June of 2011 at 50% flowering stage. Samples were collected following the harvest, dried at 70°C for 48 h and weighed. The dried samples were reassembled and ground to pass through a 1-mm screen. The crude protein content was calculated by multiplying the Kjeldahl nitrogen concentration by 6.25 (Kacar and İnal 2008). K, Ca and Mg contents of samples were determined using an atomic spectrophotometer after digesting the samples with HClO4:HNO3 (1:4) (AOAC, 1990); Tetany ratios (K / (Ca + Mg)) were calculated on a mill equivalent basis (Cherney and Marten, 1982). The ADF (acid detergent fiber) and NDF (neutral detergent fiber) concentrations were measured according to Ankom Technology. The total digestible nutrient (TDN) and the relative feed value (RFV) were estimated according to the following equations adapted from Albayrak et al. (2011):
TDN= (-1.291 x ADF) + 101.35
RFV = (120)/NDF) x ((88.9 - (0.779 x ADF)) x (0.775)). The statistical analysis of the yield and quality data was performed using the General Linear Model procedure of SAS (SAS Inst. 1998). The means were compared using the DUNCAN test at the 0.05 probability level (Steel, and Torrie, 1997).
RESULTS AND DISCUSSION Dry matter yield, crude protein content and yield Perennial ryegrass (Lolium perenne L.) differed (P<0.01) consistently in dry matter yield (DMY) (Table 1). There was a line x year interaction (p<0.01), 2011 belonged to the highest group and 2010 to lowest group. In 2010, DMY varied from 319 to 517 kg/da in 2010 and 505 to 768 kg/da in 2011. Based on the average of two years, the highest DMY was determined for line 3, 1, 4, 11, 17, 13, 9 and 8 (548-629 kg/da). Albayrak and Güler (2005) obtained 297-425 kg/da DMY from perennial ryegrass in Samsun conditions. Başbağ (2008) reported that DMY in perennial ryegrass was 952-1163 kg/da under Diyarbakır conditions. Gül (2006) found that DMY was 1060-1293 kg/da in Ankara conditions. Çakmakçı et al. (2005) found that DMY of ryegrass was 489 kg/da in Antalya conditions. Our findings did not agree with the other findings. These discrepancies should be from the ecological conditions and cultivar differences.
During the experimental period the crude protein content (CPC) varied with year, line and the line x year interaction was also significant (Table 1). CPC varied from 9.76 to 12.56% in 2010 and from 9.09 to 11.69% in
2011. CPC was higher in the first year than that of in the second year. Based on the average of two years, the highest CPC was obtained from lines 1, 4, 13, 18, 10, 17, 2, 12 and 15 (10.53-12.09%).The CPC from 5.5 to 15.9% have been reported by others (Fisher et al. 2004; Smit et al. 2005; Tawell et al. 2005; Tas et al. 2006). Albayrak
42 and Güler (2005) reported that the quality of forages may be altered due to differences in temperature and precipitation.
Year, lines and year x lines interactions of crude protein yield (CPY) were significant (Table 1). In the first year, the highest CPY were determined on lines 1, 13, 3, 4, 11, 12, 17 and 8 (45.11-60.44 kg/da), in the second year, on lines 1, 4, 17, 3, 18, 10, 13 and 11 (69.57-89.98 kg/da). Based on the average of two years, the highest CPY was obtained from line 14, 3, 13 and 17 (64.04-75.21 kg/da). Albayrak and Güler (2005) obtained 31-44 kg/da CPY from perennial ryegrass. Başbağ (2008) reported that CPY in perennial ryegrass was 112-125 kg/da. ). Crude protein yield related to CPC and DMY.
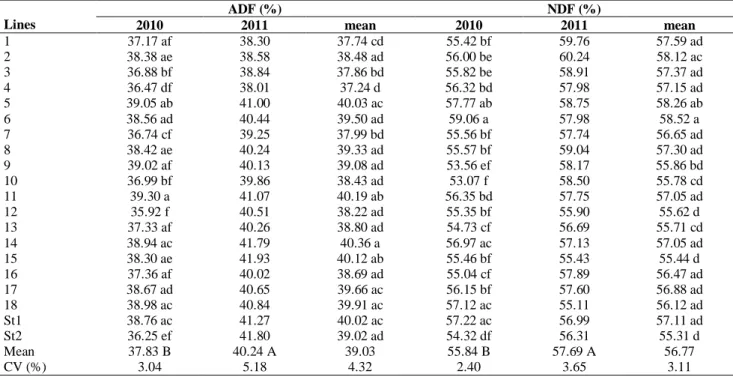
Acid detergent fiber, neutral detergent fiber contents and total digestible nutrient, relative feed value values Variation was found for several quality parameters of ryegrass lines; ADF, NDF, TDN and RFV differed among lines in two years (Table 2 and 3). The lowest ADF content was obtained from lines 12, St2 and 4 (35.92-36.47%) in the first year, although there were no statistical differences among the ryegrass lines (38.01-41.93%) in the second year. Based on the average of two years, the lowest ADF content was determined for line 7, 3, 1 and 4 (37.24-37.99%). Low NDF contents were found for lines 10, 9, St2 (53.07-54.32%) in 2010, and for lines 12, 15 and 18 (55.11-55.90%) in 2011.
Table 2. Acid detergent fiber (ADF) and neutral detergent fiber (NDF) contents of perennial ryegrass lines
Lines ADF (%) NDF (%) 2010 2011 mean 2010 2011 mean 1 37.17 af 38.30 37.74 cd 55.42 bf 59.76 57.59 ad 2 38.38 ae 38.58 38.48 ad 56.00 be 60.24 58.12 ac 3 36.88 bf 38.84 37.86 bd 55.82 be 58.91 57.37 ad 4 36.47 df 38.01 37.24 d 56.32 bd 57.98 57.15 ad 5 39.05 ab 41.00 40.03 ac 57.77 ab 58.75 58.26 ab 6 38.56 ad 40.44 39.50 ad 59.06 a 57.98 58.52 a 7 36.74 cf 39.25 37.99 bd 55.56 bf 57.74 56.65 ad 8 38.42 ae 40.24 39.33 ad 55.57 bf 59.04 57.30 ad 9 39.02 af 40.13 39.08 ad 53.56 ef 58.17 55.86 bd 10 36.99 bf 39.86 38.43 ad 53.07 f 58.50 55.78 cd 11 39.30 a 41.07 40.19 ab 56.35 bd 57.75 57.05 ad 12 35.92 f 40.51 38.22 ad 55.35 bf 55.90 55.62 d 13 37.33 af 40.26 38.80 ad 54.73 cf 56.69 55.71 cd 14 38.94 ac 41.79 40.36 a 56.97 ac 57.13 57.05 ad 15 38.30 ae 41.93 40.12 ab 55.46 bf 55.43 55.44 d 16 37.36 af 40.02 38.69 ad 55.04 cf 57.89 56.47 ad 17 38.67 ad 40.65 39.66 ac 56.15 bf 57.60 56.88 ad 18 38.98 ac 40.84 39.91 ac 57.12 ac 55.11 56.12 ad St1 38.76 ac 41.27 40.02 ac 57.22 ac 56.99 57.11 ad St2 36.25 ef 41.80 39.02 ad 54.32 df 56.31 55.31 d Mean 37.83 B 40.24 A 39.03 55.84 B 57.69 A 56.77 CV (%) 3.04 5.18 4.32 2.40 3.65 3.11
Means followed by the same letter and column are not significantly different at p= 0.05 level.
Average of two years, line 10, 13, 12, 15 and St2 had the lowest NDF content (55.31-55.78%). It was reported that ADF and NDF contents of ryegrass ranged from 26 to 33% and from 40 to 64% (Jackson et al. 1996; Fisher et al. 2004; Smit et al. 2005; Tas et al. 2005; Turner et al. 2006). The ADF and NDF contents of ryegrasses in present study were found to be similar to other researches findings.
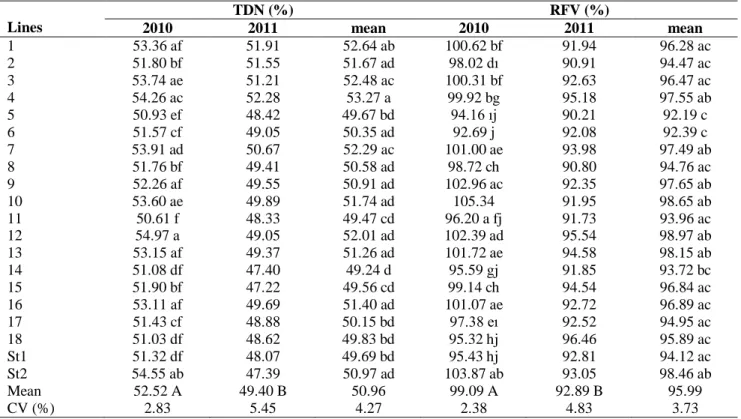
The TDN refers to the nutrients available for livestock and are related to the ADF concentration of the forage. Based on the average of two years, the TDN value varied from 49.24 to 53.27% for ryegrass lines (Table 3).
Uzun (2010) stated that forages with an the RFV value over 151, 150-125, 124-103, 102-87, 86-75, and less than 75 are categorized as prime, premium, good, fair, poor and rejected, respectively. Based on the average of the 2 years, the ryegrass lines had relative feed values ranging from
92.19 to 98.97 and, they may be categorized as fair qualities (Table 3).
Mineral contents and tetany ratio
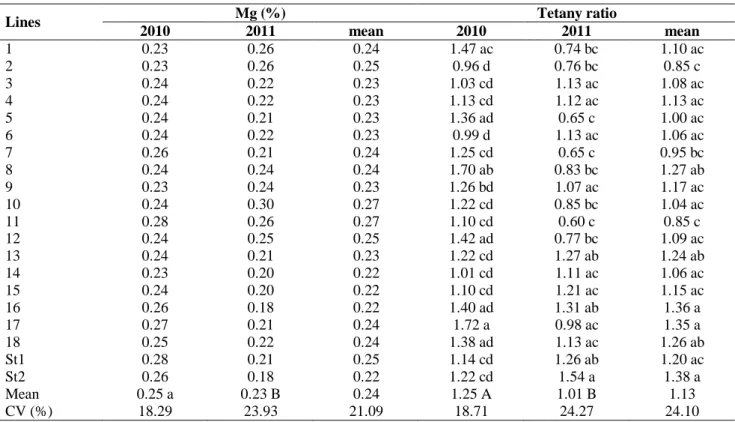
Perennial ryegrass lines K, Ca, Mg contents and tetany ratio are given Tables 4 and 5. The American National Research Council (NRC, 1996) recommended that forage crops should contain 0.31% Ca and 0.65% K concentration for beef cattle. Tajeda et al. (1985) reported that forage crops should contain at least 0.8% of K, 0.3% of Ca and 0.2% of Mg for ruminants. In present study, K content varied from 0.44 to 0.71%, Ca content was between 0.42 and 0.61%, Mg content was varied from 0.22 to 0.27%. According to the results of chemical properties of research material, nutritional quality values of ryegrass lines were similar to the all recommended standard values for ruminant.
43
Table 3. Total digestible nutrient (TDN) and relative feed value (RFV) of perennial ryegrass lines Lines TDN (%) RFV (%) 2010 2011 mean 2010 2011 mean 1 53.36 af 51.91 52.64 ab 100.62 bf 91.94 96.28 ac 2 51.80 bf 51.55 51.67 ad 98.02 dı 90.91 94.47 ac 3 53.74 ae 51.21 52.48 ac 100.31 bf 92.63 96.47 ac 4 54.26 ac 52.28 53.27 a 99.92 bg 95.18 97.55 ab 5 50.93 ef 48.42 49.67 bd 94.16 ıj 90.21 92.19 c 6 51.57 cf 49.05 50.35 ad 92.69 j 92.08 92.39 c 7 53.91 ad 50.67 52.29 ac 101.00 ae 93.98 97.49 ab 8 51.76 bf 49.41 50.58 ad 98.72 ch 90.80 94.76 ac 9 52.26 af 49.55 50.91 ad 102.96 ac 92.35 97.65 ab 10 53.60 ae 49.89 51.74 ad 105.34 91.95 98.65 ab 11 50.61 f 48.33 49.47 cd 96.20 a fj 91.73 93.96 ac 12 54.97 a 49.05 52.01 ad 102.39 ad 95.54 98.97 ab 13 53.15 af 49.37 51.26 ad 101.72 ae 94.58 98.15 ab 14 51.08 df 47.40 49.24 d 95.59 gj 91.85 93.72 bc 15 51.90 bf 47.22 49.56 cd 99.14 ch 94.54 96.84 ac 16 53.11 af 49.69 51.40 ad 101.07 ae 92.72 96.89 ac 17 51.43 cf 48.88 50.15 bd 97.38 eı 92.52 94.95 ac 18 51.03 df 48.62 49.83 bd 95.32 hj 96.46 95.89 ac St1 51.32 df 48.07 49.69 bd 95.43 hj 92.81 94.12 ac St2 54.55 ab 47.39 50.97 ad 103.87 ab 93.05 98.46 ab Mean 52.52 A 49.40 B 50.96 99.09 A 92.89 B 95.99 CV (%) 2.83 5.45 4.27 2.38 4.83 3.73
Means followed by the same letter and column are not significantly different at p= 0.05 level.
Table 4. Potassium (K) and calcium (Ca) content of perennial ryegrass lines
Lines K (%) Ca (%) 2010 2011 mean 2010 2011 mean 1 0.72 ab 0.65 ad 0.69 a 0.58 0.62 ab 0.60 a 2 0.41 d 0.70 ad 0 56 ac 0.56 0.66 a 0.61 a 3 0.43 cd 0.80 ab 0 62 ac 0.54 0.48 ce 0.51 bc 4 0.50 ad 0.81 ab 0 66 ab 0.56 0.51 ce 0.54 bc 5 0.65 ad 0.43 cd 0 54 ac 0.59 0.45 ef 0.52 bc 6 0.40 d 0.75 ac 0 58 ac 0.53 0.45 ef 0.49 cf 7 0.55 ad 0.37 d 0.46 bc 0.56 0.37 gh 0.47 cg 8 0.77 a 0.60 ad 0.69 a 0.53 0.49 ce 0.51 bc 9 0.57 ad 0.67 ad 0.62 ac 0.55 0.39 fh 0.47 cf 10 0.54 ad 0.67 ad 0.61 ac 0.55 0.47 de 0.52 bc 11 0.39 d 0.49 bd 0.44 c 0.47 0.56 bc 0.52 bc 12 0.69 ac 0.60 ad 0.65 ac 0.59 0.54 cd 0.57 ab 13 0.60 ad 0.76 ac 0.68 a 0.59 0.40 fg 0.50 cd 14 0.41 d 0.61 ad 0.51 ac 0.51 0.35 gı 0.43 dg 15 0.42 cd 0.65 ad 0.54 ac 0.51 0.35 gı 0.43 dg 16 0.57 ad 0.65 ad 0.61 ac 0.52 0.32 hj 0.42 fg 17 0.76 a 0.65 ad 0.71 a 0.53 0.46 ef 0.49 ce 18 0.53 ad 0.87 a 0.70 a 0.47 0.55 bc 0.51 bc St1 0.47 bd 0.63 ad 0.55 ac 0.54 0.30 ıj 0.42 g St2 0.56 ad 0.67 ad 0.61 ac 0.59 0.27 j 0.43 eg Mean 0.55 B 0.65 a 0.60 0.54 A 0.45 B 0.50 CV (%) 25.11 25.83 25.63 10.94 9.07 10.27
44
Table 5. Magnesium (Mg) content and tetany ratio of perennial ryegrass lines
Lines Mg (%) Tetany ratio
2010 2011 mean 2010 2011 mean 1 0.23 0.26 0.24 1.47 ac 0.74 bc 1.10 ac 2 0.23 0.26 0.25 0.96 d 0.76 bc 0.85 c 3 0.24 0.22 0.23 1.03 cd 1.13 ac 1.08 ac 4 0.24 0.22 0.23 1.13 cd 1.12 ac 1.13 ac 5 0.24 0.21 0.23 1.36 ad 0.65 c 1.00 ac 6 0.24 0.22 0.23 0.99 d 1.13 ac 1.06 ac 7 0.26 0.21 0.24 1.25 cd 0.65 c 0.95 bc 8 0.24 0.24 0.24 1.70 ab 0.83 bc 1.27 ab 9 0.23 0.24 0.23 1.26 bd 1.07 ac 1.17 ac 10 0.24 0.30 0.27 1.22 cd 0.85 bc 1.04 ac 11 0.28 0.26 0.27 1.10 cd 0.60 c 0.85 c 12 0.24 0.25 0.25 1.42 ad 0.77 bc 1.09 ac 13 0.24 0.21 0.23 1.22 cd 1.27 ab 1.24 ab 14 0.23 0.20 0.22 1.01 cd 1.11 ac 1.06 ac 15 0.24 0.20 0.22 1.10 cd 1.21 ac 1.15 ac 16 0.26 0.18 0.22 1.40 ad 1.31 ab 1.36 a 17 0.27 0.21 0.24 1.72 a 0.98 ac 1.35 a 18 0.25 0.22 0.24 1.38 ad 1.13 ac 1.26 ab St1 0.28 0.21 0.25 1.14 cd 1.26 ab 1.20 ac St2 0.26 0.18 0.22 1.22 cd 1.54 a 1.38 a Mean 0.25 a 0.23 B 0.24 1.25 A 1.01 B 1.13 CV (%) 18.29 23.93 21.09 18.71 24.27 24.10
Means followed by the same letter and column are not significantly different at p= 0.05 level.
The most important disease for livestock is grass tetany caused by mineral matter imbalance in feeds. Tetany is associated with Mg deficiency in the blood of animals. The threshold for risk of grass tetany increases at K / (Ca + Mg) ratio of 2.2 or higher (Elkins et al., 1977). In present study, tetany ratio changed from 0.85 to 1.38, in this research and was below the critical level.
CONCLUSION
Eighteen perennial ryegrass lines and two standard cultivars were evaluated in a field trial for forage yield and quality parameters in the Black Sea Coastal Area. According to the results, indicated that perennial ryegrasses had higher forage yield and quality parameters than the standard perennial ryegrasses. According to the findings, some of the perennial ryegrass lines tested in this study will have a chance in Region Yield Trials. In order to be on the registered cultivar list for the region will obtain in perennial ryegrass.
LITERATURE CITED
Albayrak, S and M. Güler. 2005. Nitrogen effects on yield and forage quality of perennial ryegrass (Lolium perenne L.). Turkish Journal of Field Crops. 10(1):16-22.
Albayrak S., M. Türk, and O. Yüksel. 2011. Effect of row spacing and seeding rate on hungarian vetch yield and quality. Turkish Journal of Field Crops. 16(1): 53-58. A.O.A.C. 1990. In Helrich K. (Ed.), Official methods of
analysis. (15th ed.). Arlington, VA, USA.
Basbag, M. 2008. An investigation on some forage type perennial ryegrass (Lolium perenne L.) cultivars under Diyarbakir conditions. Journal of the Faculty of Agriculture, Harran University. 12:27-31.
Casler M.D. and K.P. Vogel. 1999. Accomplishments and impact from breeding for increased forage nutritional value. Crop Science, 39: 12–20.
Cherney, J.H., and Marten, G.C. 1982. Small grain crop forage potential:I.Biological and chemical determinants of quality and yield. Crop Sci. 22: 227-231.
Cakmakci, S., B. Aydınoglu, M. Arslan, and M. Bilgen. 2005. Effect of Different Sowing Methods on Forage Yield of Common Vetch ( Vicia sativa L.) + Perennial Ryegrass (Lolium perenne L.) Mixtures. Journal of the Faculty of Agriculture, Akdeniz University. 18:107-112.
Elkins, C.B., R.L. Haaland, and C.S. Honeland, 1977. Tetany Potential of Forage Species as Affected By Soil Oxygen. Proceedings of the XIII. International Grass Congress, 18-21. May, 2: 1505-1507.
Fisher, M.J., D.W. Bohnert, C.J. Ackerman, C.S. Schauer, T. DelCurto, A.M. Craig, E.Z. Vanzant, D.L. Harmon and F. N. Schrick. 2004. Evaluation of perennial ryegrass straw as a forage source for ruminants. Journal of Animal Science. 82:2175–2184.
Gul, E. 2006. Yield and yield components of some grasses. Ankara University Graduate School of Natural and Applied Sciences Department of Agronomy. Master Thesis. 37p. Jackson, F.S., Mcnabb, W.C., Peters, J.S., Barry, T.N.,
Campbell, B.D., and M.J. Ulyatt. 1996. Nutritive value of subtropical grasses invading North Island pastures. Proceedings of the New Zealand Grassland Association 57: 203-206.
Kacar, B and A. İnal. 2008. Plant Analyses. Nobel Presses, No: 1241, Ankara.
National Research Council (NRC) 1996. Nutrient requirements of beef cattle, 7th rev. ed, Washington, DC, USA, National Academy Press.
SAS Institute (1998). INC SAS/STAT users’ guide release 7.0, Cary, NC, USA.
45 Smit H.J., B.M. Tas., H.Z. Taweel, S. Tamminga and A.
Elgersma. 2005. Sward characteristics important for intake in six Lolium perenne varieties. Grass and Forage Science, 60, 128–135.
Steel, R.G.D. and J.H. Torrie. 1997. Principles and procedures of statistics: A biometrical approach. 3rd ed. McGraw-Hill, New York. 631 p.
Tajeda, R., R. Mcdowell, F.G. Martin and J.H. Conrad. 1985. Mineral element analyses of various tropical forages in Guatemala and their relationship to soil concentration. Nutrient Rep. International. 32: 313-324.
Tas, B.M., H.Z. Taweel, H.J. Smit, A. Elgersma, J. Dijkstra, and S. Tamminga. 2006. Utilisation of N in perennial ryegrass cultivars by stall-fed lactating dairy cows. Livestock Science 100: 159– 168.
Taweel, H.Z., T.B.M. Tas, H.J. Smit, A. Elgersma, J. Dijkstra, and S. Tamminga. 2005. Improving the quality of perennial
ryegrass (Lolium perenne L.) for dairy cows by selecting for fast clearing and/or degradable neutral detergent fiber. Livestock Production Science 96: 239–248.
Turner, L.R., D.J. Donaghy, P.A. Lane, and R. P. Rawnsley. 2006. Effect of defoliation management, based on leaf stage, on perennial ryegrass (Lolium perenne L.), prairie grass (Bromus willdenowii Kunth.) and cocksfoot (Dactylis
glomerata L.) under dryland conditions. 2. Nutritive value.
Grass and Forage Science, 61: 175–181.
Uzun, F. 2010. Changes in hay yield and quality of bulbous barley at different phenological stages. Turk J Agric Forestry. 34: 1-9.
Wilkins P.W. and M.O. Humphreys. 2003. Progress in breeding perennial forage grasses for temperate agriculture. Journal of Agricultural Science, Cambridge, 140: 129–150.