SOIL CO2 EMISSIONS UNDER CONVENTIONAL
AND CONSERVATIONAL TILLAGE METHODS IN SOYBEAN
CULTIVATION IN CUKUROVA PLAIN OF TURKEY
Davut AKBOLAT1, Zeliha B. BARUT2, M. Murat TURGUT3, İsmail ÇELİK4 1Suleyman Demirel University, Agricultural Faculty, Department of Agricultural Machinery &Technologies Engineering, 32260 Isparta,Turkey
2Cukurova University, Agricultural Faculty, Department of Agricultural Machinery & Technologies
Engineering, 01330 Adana, Turkey
3Dicle University, Agricultural Faculty, Department of Agricultural Machinery & Technologies
Engineering, 21280 Diyarbakir, Turkey
4Cukurova University, Agricultural Faculty, Soil and Plant Nutrition Department,
01330 Adana, Turkey
Corresponding author email: [email protected]; [email protected] Abstract
In this study, the carbon dioxide (CO2) emissions for soybean cultivated in Adana province according to conventional tillage practices for chisel tillage with stubble burning (CT), and conservational tillage practices with stubble for disc tillage (DT), rotary tillage (RT) and direct seeding (DS) were determined. Soil carbon dioxide (CO2) emission measurements were started after tillage using a portable CO2 measurement system and were carried out at various intervals over a period of 55 days.
According to the obtained results, CO2 emissions in CT, DT, RT and DS treatments were determined as 0.028, 0.036, 0.029, and 0.025 g CO2 m-2 h-1, respectively. It was determined that the CO2 emission level in the DS treatment was lower in comparison with those of the other three treatments. The soil evaporation (H2O) amounts were determined for CT, DT, RT and DS treatments as 4.37, 4.38, 4.21 and 3.50 g H2O m-2 h-1, respectively. Soil temperature was measured on average for CT, DT, RT and DS treatments as 28.7, 28.8, 28.7 and 28.9oC, respectively. The average soil evaporation of DS treatment was found to be lower than the other three treatments. The difference between the soil moisture depending on treatment was not significant.
Key words: direct seeding, seedbed preparation, soil CO2 emission, soybean, tillage systems.
INTRODUCTION
Soil management practices such as tillage and fertilization affect carbon build up in soil or the amount of atmospheric CO2 (Nyakatawa et al.,
2012). Soil mixing intensity has an effect on the amount of carbon (C) that disappears from the soil in the form of CO2. In other words,
increasing aeration in the soil usually increases soil CO2 emissions due to decomposition (Dao,
1998). The amount of soil CO2 emissions also
depends on soil moisture and temperature regime, soil type, land usage and production method as well as the amount of soil organic carbon (Johnson et al., 2007; Chianese et al., 2009; Shrestha et al., 2009; Davidson et al., 2000). It has been reported that higher amounts of soil CO2 emissions are obtained from rotary
tillage without residue treatment in sugarcane production (Teixeria et al., 2011). It has been
stated that emissions of CO2 decreased by 1.2
times in burned soil compared to soil where residue was incorporated, but emissions of N2
increased by 4.1 times and the increase in inorganic N from N mineralization was 1.4 times (Montoya-González et al., 2009).
Brye et al. (2006) determined that the soil surface CO2 flux when using a conventional
tillage system including stubble burning was 37.6% higher in comparison with that of a no-till system in wheat-soybean double crop production in Mississippi. In a study to determine the effect of tillage practices with or without residue on soil CO2 emission, higher
emission rates were found in tillage with residue than in tillage without residue in
Scientific Papers. Series A. Agronomy, Vol. LIX, 2016
Soil CO2 emission rates are generally lower
with less intensive alternatives relative to moldboard plowing, with the greatest difference occurring at the time immediately following tillage practices. Al-kaisi & Yin (2005) found that cumulative soil CO2
emissions were 19% to 41% lower for less intensive tillage treatments than for moldboard plowing and that it was 24% lower for no-tillage with residue than without residue during a 480-h measurement period.
CO2 emission rate decreases as the number of
tillage equipment is reduced during tillage. In studies carried out to determine CO2 emissions
from the soil due to tillage equipment used, Akbolat et al. (2009) found that the highest CO2 emission rate was from plowing tillage,
whereas the lowest CO2 emission rate was
observed in the no-till method. Another study comparing conventional tillage (CT), reduced tillage (RT) and no-till (NT) systems in terms of CO2 emissions has yielded that the highest C
sequestration was obtained in NT treatment, followed by RT and CT treatments (Zhang et al., 2012). In a short term study examining CO2
emissions in sugar beet cultivation via conventional, reduced and no-till cultivation systems, the highest CO2 emission rate was
recorded in the conventional system, followed by reduced and no-till systems (La Scala et al., 2006). Short term studies during which CO2
emissions are determined from soil, it is stated that CO2 emission rate rapidly increases
following tillage, after which it decreases to low levels probably due to the discharge of gases accumulated in the pores and cavities prior to the process or an attack of rapidly developing microorganisms (Reicosky, 2002; Rasmussen & Rohde, 1998). These results indicate that seedbed preparation methods for different growing plants affect soil CO2
emissions. Also, seedbed preparation practices differ according to the plant grown. Winter wheat-summer soybean rotation allows farmers to produce two crops per year but the extensive application of this rotation has increased
stubble burning in the Cukurova plain. The
objective of this study is to determine the effect of chisel tillage without stubble (CT), disc tillage with stubble (DT), rotary tillage with stubble (RT) and direct seeding with stubble
(DS) practices used for second crop soybean cultivation on soil CO2 emission.
MATERIALS AND METHODS
Study areaThe study was carried out during June 3rd and
July 26th, 2010 at Cukurova University
Research Farm in Adana province located in Cukurova plain. Cukurova University Research Farm is located between 37o 03’47” N latitude
and 35o20’12”E longitude with an altitude of
23 m. The soil texture of the study area is clay (C) class consisting of 50% clay, 33 % silt and 17% sand with an organic matter content of 0.9% (Barut et al., 2012). A characteristic Mediterranean climate prevails in the study area.
Summers are hot and dry whereas winters are mild and rainy. The annual average precipitation is 625 mm. Temperatures differ between -8,1°C and +45,6°C and most of the rain falls during the winter. Rain is very scarce in summer (Anonymous, 2013). Definitions regarding the methods used in the trials are given in Table 1.
Table 1. The description of treatments used in seed bed preparation
Treatments Description
CT (Chisel tillage)
Stubble burning, Chisel tillage one pass (tillage depth 35 cm), disc harrow two pass (depth of 15 cm) followed by scraper two pass (depth of 5 cm), plus Single single-seed pneumatic planter (seeding depth of 5 cm).
DT (Disc
tillage) Stubble chopping, Heavy disc harrow, two pass (tillage depth of 18 cm, tillage width of 200 cm) followed by scrapper, two pass (tillage depth of 5 cm, tillage width of 200 cm) plus single-seed pneumatic planter (seeding dept of 5 cm). RT
(Rotary tillage)
Stubble chopping, Rototiller, one pass (tillage depth of 15 cm, tillage width of 200 cm, followed by scrapper, two pass (tillage depth of 5 cm, tillage width of 200 cm), plus single-seed pneumatic planter (seeding dept of 5 cm) .
DS (Direct seeding)
Direct seeder, (working width of 200 cm, seeding depth of 5 cm)
Plot width and length used in the trial was 12 and 40 m, respecively. A randomized complete block design with three replications was selected for the trial.
A 52 kW tractor was used during the trials. The engine speed was held constant at 2000 rpm. Wheat stubble except from CT treatment was chopped and spread on the soil surface before
seedbed preparation. Stubble was burned in CT treatment before seedbed preparation. The average stubble amount was determined as 2500 kg per hectare in DT, RT and DS treatments. The average stubble height was around 30 cm. Wheat residues except from stubble were removed from the soil surface before seedbed preparation.
Soil CO2 measurement
In-situ soil respiration was measured using a CFX-2 soil CO2 flux system (PP Systems,
Hitchin, UK) consisting of an integral CO2
analyzer and H2O sensor, soil respiration
chamber, and soil temperature probe (Akbolat et al., 2009). Measurements of soil net CO2
emissions in g m-2 h-1 are based on
concentration differences between air entering and leaving the chamber and the flow rate under normal soil atmosphere exchanges, with an accuracy better than 1% and 2% for CO2
and H2O concentrations, respectively. A soil
CO2 emission chamber was installed 1.5 cm
deep into the randomly selected locations for the plots, and thus was isolated from the outer atmosphere. The records were made more frequently during the days following tillage, whereas afterwards they were carried out at wider intervals. The measurements were taken 0, 1, 4, 5, 7, 8, 11, 13, 19, 22, 30, 37, and 55 days after tillage. First the measurements of soil CO2 emissions were taken five minutes
after tillage. Nine records were taken on the same randomly selected points from every plot for each measurement.The trial was completed when CO2 emission reached contant level. In
addition, evaporation (H2O emissions) and soil
temperature were concomitantly measured. Soil sampling and analyzing
Volumetric soil moisture content in 0-20 cm soil depth was determined using a Field Scout TDR 300 portable moisture meter (Spectrum Technologies, Inc., Plainfield, IL, USA). Soil moisture records were not determined on the first two days due to irrigation. Organic matter was determined according to the Walkley-Black, (1934) method, whereas texture was determined according to the Bouyoucos hydrometer Bouyoucos (1951) method. Statistical procedure
The data were analyzed using the General Linear Model (GLM) procedures of SAS (SAS Inst. Inc. Cary, NC) by including treatments in the model, and PDIFF statements were used to compare treatment means for dependent variables (SAS, 1999). As for the significance level, (P<0.05) was accepted to be statistically significant.
RESULTS AND DISCUSSIONS
The treatment of CT is mostly used for seedbed preparation in second crop soybean cultivation in Cukurova plain. In this treatment stubble is burned intensively after the wheat harvest. Therefore, this treatment has negative effects in terms of soil conservation and environmental protection. In this research the soil CO2
emission rates were determined in the conservation tillage treatments (DT, RT, and DS) and conventional tillage (CT) treatment. The results of the experiment based on tillage practices are given in Table 2. The maximum soil CO2 emission from all tilled treatments
excluding the the 30th day was observed
immediately after tillage pratices. Table 2. The means of soil carbon dioxide emission, evaporation, temperature and moisture content Treatments Soil CO2 emission
(g CO2 m-2h-1)
Soil Evaporation (g H2O m-2h-1)
Soil Temperature
(oC) Soil moisture content *(%)
CT (n=350) SD 0.028 ab 0.0030 4.37 a 0.15 28.7 c 0.045 20.2 0.27 DT (n=351) SD 0.036 a 0.0029 4.38 a 0.14 28.8 ab 0.044 20.0 0.27 RT (n=351) SD 0.029 ab 0.0029 4.21 a 0.14 28.7 bc 0.044 19.6 0.27 DS (n=342) SD 0.025 b 0.0030 3.50 b 0.15 28.9 a 0.046 20.3 0.27
Means followed by the same capital letter within a column are not significantly different according to Duncan’s test at the 5% level. *Sample number for soil moisture content of CT, DT, RT and DS is 99, 99, 98 and 96 respectively.
The average soil CO2 emissions from
maximum to minimum were determined from DT, RT, CT and DS respectively (Table 2). The averages of the soil CO2 emissions were
measured for CT, DT, RT and DS treatments as 0.028, 0.036, 0.029 and 0.025g CO2 m-2 h-1
respectively. The cumulative soil CO2
emissions were determined for DT, RT, CT and DS treatments as 48.5, 41.9, 40.0 and 34.1 g CO2 m-2 respectively in the experimental
period. A positive linear relationship between cumulative CO2 emission and time was
observed. This result was in accordance with Al-Kaisi & Yin (2005).
When the CO2 emissions on different days of
the experiment were examined, it was observed that the difference between the treatments were statistically significant for days 0, 1, 4, 11, and 19. There were no differences among CT, RT and DS treatments in terms of average soil CO2
emissions, but that the soil CO2 emission was
statistically (p<0.05) lower in DS treatment than DT treatment.
Although the tillage depth of CT treatment was higher than it was for DT and RT, the soil CO2
emission rate in this treatment was equal or
very close to those of the other treatments. Therefore, high CO2 emissions in the CT would
be expected in comparison to the treatment of DT and RT. Scala et al. (2001) reported that the soil CO2 emission rate for the chisel plow was
the highest of the all treatments. Therefore, stubble is removed in CT treatments, as stated
by Montoya-González et al. (2009) and
Teixeria et al. (2011).
The lowest CO2 emission rate was determined
in DS treatment on days 0, 11, 13, 19 and 37 (Figure 1a). CO2 emissions reached their
lowest value on the 22nd day after tillage and
the lowest emission was observed in the RT treatment. The highest CO2 emissions were
observed on the 30th day after the first tillage
operation. However, differences between the treatments were not significant (p>0.05) on that day since the measurement was taken soon after irrigation. As has been reported (Orchard & Cook 1983), high soil moisture content increased soil CO2 emissions by soil microbial
respiration. Negative CO2 emission values were
recorded 0 and 11days after tillage in the DS treatment.
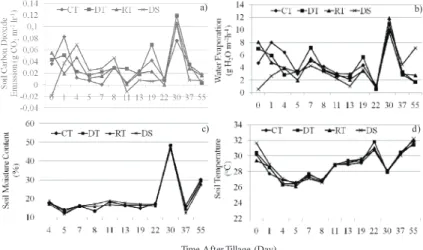
a) b)
c) d)
b)
Time After Tillage (Day)
Figure 1. Soil Carbon Dioxide (CO2) Emission, soil water evaporation, soil moisture content, and soil temperature after
the tillage CO2 emissions measured in all treatments
immediately after tillage were high and had a tendency to decrease. A sharp increase in CO2
emissions immediately following tillage is often attributed to an increase in soil aeration due to disturbance (Dong et al., 2009). Reicosky & Lindstrom (1993) have also
reported that a greater CO2 emission rate
immediately after tillage was due to greater physical CO2 emission from soil. The CO2
emission found in the study is lower than those determined by Akbolat et al. (2009) in semi-arid climatic conditions. However, in the same study, a CO emission of 0.030 g CO m-2 h-1
obtained for the no-till system was extremely close to the emission of 0.025 g CO2 m-2 h-1
obtained in our study.
Statistical differences among the treatments were significant on the recording days of 0, 1, 4, 11, and 19. No difference was determined between thetreatments regarding CO2 emission
(5, 7, 8, 13, 22, 30, 37 and 55th days) on other
days. The lowest CO2 emission value was
determined during the first record of the DS treatment. One of the reasons for the lowest CO2 emission value for the DS treatment is the
lowest evaporation value in this recording. The evaporation of DS treatment was 0.52 g H2O
m-2h-1 in the first record (Figure 2). The lowest
average water evaporation value was determined in the DS treatment. There was a linear relationship between the soil CO2
emission and water evaporation values in these records (day 0 and 1).
The averages of soil evaporation values were measured for CT, DT, RT and DS treatments as 4.37, 4.38 4.21 and 3.50 g H2Om-2h-1
respectively. Soil evaporation that was generally parallel with CO2 emission was
determined to be quite high for all treatments except for DS treatment at the time immediately following tillage but it gradually decreased in the following days. Soil evaporation values of DS treatment during the first and second records were lower in comparison with other treatments (Figure 1b). The average soil moisture values measured for CT, DT, RT and DS treatments were 20.2%, 20.0%, 19.6% and 20.3%, respectively. In terms of average soil moisture content, no statistically significant (p>0.05) differences were found between the treatments. Whereas no difference in the soil moisture values was detected on most record days, a lower soil moisture value was determined for the DS treatment on the 37th and 55th days (Figure 3).
Soil moisture content of the DS treatment was statistically higher than those of the other three treatments on only the 7th day. High soil
moisture content for the DS treatment was explored with soil thermal conductivity (Silva-Olaya et al., 2013). In addition, this pattern indicates that tillage methods involving less physical disturbance help conserve soil moisture.
The soil moisture content of treatments on the 30th day was higher than for all other record
days (Figure 1c). The reason for this was that the measurement was taken soon after irrigation. In the other words, irrigation increased the soil water content.
The averages of soil temperature values (Figure 1d) were measured for CT, DT, RT and DS treatments as 28.7 oC, 28.8 oC, 28.7 oC, and
28.9 oC respectively. While the average soil
temperature of DS treatment was higher than those of CT and RT treatments, it was not different from DT treatment (Table 2). No linear correlation between soil temperature and CO2 emissions was found. These results are in
accordance with the study by Akbolat et al. (2009). Differences between the temperatures of 0, 1, 4, 5, 7, 19, 22, 55th records were
significant. The average soil temperature of DS treatment in our study is higher than for the other treatments, as was the case in the study carried out by Akbolat et al. (2009).
However, this average difference of soil temperature did not increase soil CO2 emission.
The difference in average soil temperature among the treatments was very low. Thus, there were other parameters besides temperature and moisture that changed the soil CO2 emission in different treatments.
The lowest CO2 emission was obtained in
direct seeding treatment during this study carried out in order to determine the soil CO2
emissions for tillage practices applied in second crop soybean cultivation in the Cukurova plain of Turkey. The differences between soil temperatures do not support differences between CO2 emissions. However, the
differences between average soil water evaporation support differences between soil CO2 emissions.
As was the case in our study, the lowest soil CO2 emission rate in many tillage studies is
obtained for DS treatment in a no-till system. According to the obtained results, the cumulative CO2 emissions obtained for CT,
DT, RT and DS treatments were 40.0, 48.5, 41.9 and 34.1 g CO2 m-2, respectively. It was
observed that the cumulative CO2 emission rate
in the DS treatment was 1.4 times lower than that of DT treatment, 1.2 times lower than that of CT treatment, and 1.2 times lower than that of RT treatment.
CONCLUSIONS
As a result, chisel based tillage practice characterizes regional seedbed preparation methods. Higher soil CO2 emissions would be
expected in this treatment due to deep tillage. However, soil CO2 emission of this treatment
was lower in contrast to the references due to burned stubble.
Although the soil CO2 emission was lower, the
chisel based tillage with stubble burning method cannot be recommended because of the environmental effects and the decreases in soil organic carbon.
The importance of direct seeding method incrases due to lower inputs in comparison with other methods as well as high organic matter gain in the long run for the soil along with environmental friendliness.
ACKNOWLEDGEMENTS
We would like to thank the Research Project Administration Unit of Çukurova University for financial support.
REFERENCES
Akbolat D., Evrendilek F., Coskan A., Ekinci K., 2009. Quantifying soil respiration in response to short-term tillage practices: a case study in southern Turkey. Acta Agriculturae Scandinavica, Section B - Plant Soil Science 59: 50-56.
Al-Kaisi M.M., Yin X., 2005. Tillage and crop residue effects on soil carbon and carbon dioxide emission in corn-soybean rotations. Journal of Environmental Quality 34: 437-445.
Anonymous, 2013. Weather bulletin the year of 2012, meteorological offices of Adana.
Barut B.Z., Turgut M.M., Akbolat D., Celik I., 2012. Effects of tillage systems on CO2 emissions from
soil. International Conference of agricultural Engineering CIGR-Ageng 2012, Jully 8-12, Valencia-SPAIN.
Bouyoucos G.J., 1951. A Recalibration of the Hydrometer Method for Making Mechanical Analysis of Soils. Agron J 43: 435- 438.
Chianese D.S., Rotz C.A., Richard T.L., 2009. Simulation of carbon dioxide emissions from dairy farms to assess greenhouse gas reduction strategies. Transactions of the ASABE 52: 1301-1312. Dao T.H., 1998. Tillage and crop residue effects on
carbon dioxide evolution and carbon storage in a Paleustoll. Soil Sci Soc Am J 62: 250-256.
Montoya-González A., González-Navarro O.E., Govaerts B., Sayre K.D., Estrada I., Luna-Guido M.,
rotation and nitrogen source effect on carbon and nitrogen dynamics: A laboratory study. Plant and soil 325: 243-253.
Johnson J.M.F., Franzluebbers A.J., Weyers S.L., Reicosky D.C., 2007. Agricultural opportunities to mitigate greenhouse gas emissions. Environmental Pollution 150: 107-124.
La Scala N., Lopes A., Marques J., Pereira G.T., 2001. Carbon dioxide emissions after application of tillage systems for a dark red latosol in southern Brazil. Soil and Tillage Research 62: 163-166.
La Scala Jr N.L., Bolonhezi D., Pereira G.T., 2006. Short-term soil CO2 emission after conventional and
reduced tillage of a no-till sugar cane area in southern Brazil. Soil & Tillage Research 91: 244-248. Nyakatawa E.Z., Mays D.A., Way T.R., Watts D.B.,
Torbert H.A., Smith D.R., 2012. Soil Carbon Dioxide Fluxes in Conventional and Conservation Tillage Corn Production Systems Receiving Poultry Litter and Inorganic Fertilizer. Journal of Sustainable Agriculture 36: 873-892.
Silva-Olaya A.M., Cerri C.E.P., La Scala Jr N., Dias C.T.S., Cerri C.C., 2013. Carbon dioxide emissions under different soil tillage systems in mechanically harvested sugarcane. Environmental Research Letters 8: 015014.
Orchard V.A., Cook F.J., 1983. Relationship between soil respiration and soil moisture. Soil Biology and Biochemistry 15: 447-453.
Oorts K., Merckx R., Grehan E., Labreuche J., Nicolardot B., 2007. Determinants of annual fluxes of CO2 and N2O in long-term no-tillage and
conventional tillage systems in northern France. Soil & Tillage Research 95: 133-148.
Rasmussen P.E., Rohde C.R., 1988. Long tern tillage and nitrogen fertilization effects on organic nitrogen and carbon in A semiarid soil. Soil Sci Soc Am J 52: 1114-1117.
Reicosky D.C., 2002. Long Term Effect of Moldboard Plowing on Tillage-Induced CO2 Loss. Chapter 8
Agricultural Practices and Policies for Carbon Sequestration in Soil. (Ed) by JM Kimble, R Lal, RE Follet, Lewis Publishers.
SAS, 1999. Statistical analysis systems user’s guide. 8th ed. Raleigh (NC USA: SAS Institute Inc).
Shrestha R.K., Lal R., Penrose C., 2009. Greenhouse gas emissions and global warming potential of reclaimed forest and grassland soils. Journal of Environmental Quality 38: 426-436.
Teixeira L.G., Fukuda A., Panosso A.R., Lopes A., Scala Jr N.L., 2011. Soil CO2 emission as related to
incorporation of sugarcane crop residues and aggregate breaking after rotary tiller. Engenharia Agrícola 31: 1075-1084.
Walkley A., Black I.A., 1934. An examination of Degtjareff method for determining soil organic matter and a proposed modification of the chromic acid titration method. Soil Sci 37: 29-37.
Zhang M.Y., Wang F.J., Chen F., Malemela M.P, Zhang H.L., 2013. Comparison of three tillage systems in the wheat-maize system on carbon sequestration in the North China Plain. Journal of Cleaner Production