ENABLING THE
BUSINESS OF AGRICULTURE 2016
COMPARING REGULATORY GOOD PRACTICES
Some rights reserved 1 2 3 4 19 18 17 16
This work is a product of the staff of The World Bank with external contributions. The findings, interpretations, and conclusions expressed in this work do not necessarily reflect the views of The World Bank, its Board of Executive Directors, or the governments they represent. The World Bank does not guarantee the accuracy of the data included in this work. The boundaries, colors, denominations, and other information shown on any map in this work do not imply any judgment on the part of The World Bank concerning the legal status of any territory or the endorsement or acceptance of such boundaries. Nothing herein shall constitute or be considered to be a limitation upon or waiver of the privileges and immunities of The World Bank, all of which are specifically reserved.
Rights and Permissions
This work is available under the Creative Commons Attribution 3.0 IGO license (CC BY 3.0 IGO) http://creativecommons.org/licenses/by/3.0/igo. Under the Creative Commons Attribution license, you are free to copy, distribute, transmit, and adapt this work, including for commercial purposes, under the following conditions:
Attribution — Please cite the work as follows: World Bank Group. 2016. Enabling the Business of Agriculture 2016: Comparing Regulatory Good Practices. Washington, DC: World Bank. doi:10.1596/978-1-4648-0772-5. License: Creative Commons Attribution CC BY 3.0 IGO
Translations — If you create a translation of this work, please add the following disclaimer along with the attribution: This translation was not created by The World Bank and should not be considered an official World Bank translation. The World Bank shall not be liable for any content or error in this translation. Adaptations — If you create an adaptation of this work, please add the following disclaimer along with the attribution: This is an adaptation of an original work by The World Bank. Views and opinions expressed in the adaptation are the sole responsibility of the author or authors of the adaptation and are not endorsed by The World Bank.
Third-party content — The World Bank does not necessarily own each component of the content contained within the work. The World Bank therefore does not warrant that the use of any third-party-owned individual component or part contained in the work will not infringe on the rights of those third parties. The risk of claims resulting from such infringement rests solely with you. If you wish to re-use a component of the work, it is your responsibility to determine whether permission is needed for that re-use and to obtain permission from the copyright owner. Examples of components can include, but are not limited to, tables, figures, or images.
All queries on rights and licenses should be addressed to the Publishing and Knowledge Division, The World Bank, 1818 H Street NW, Washington, DC 20433, USA; fax: 202-522-2625; e-mail: [email protected].
ISBN (paper): 978-1-4648-0772-5
ISBN (electronic): 10.1596/978-1-4648-0781-7 DOI: 10.1596/978-1-4648-0772-5
Cover image: “Farmers Market #1” © Julie Ford Oliver, www.juliefordoliver.com. Used with the permission of Julie Ford Oliver. Further permission required
for reuse.
Foreword ... vii
Acknowledgments ... viii
About Enabling the Business of Agriculture ...xi
1. Overview... 1
2. Seed — Strengthening seed systems ...12
3. Fertilizer — Improving supply and quality ... 19
4. Machinery — Expanding mechanization while ensuring quality and safety ...27
5. Finance — Expanding access to financial services ... 34
6. Markets — Enabling access ...43
7. Transport — Making transportation more reliable and affordable ...53
8. EBA topics under development ...63
Appendix A Methodology ...76
Appendix B Topic Data Notes ...79
Appendix C Alternative ways of presenting the data ... 106
Country Tables ... 108
Local Experts ...149
Boxes 1.1 Several good regulatory practices have been identified across topic areas ... 3
2.1 Good practices for involving the private sector in developing new varieties ... 14
2.2 Good practices for evaluating and registering new varieties ... 16
2.3 Good practices for countries requiring mandatory certification ...17
3.1 Good practices for fertilizer registration...21
3.2 Good practices for fertilizer import requirements ...23
3.3 Good practices for fertilizer quality control ...24
CONTENTS
4.1 Good practices for tractor dealer requirements ... 30
4.2 Good practices for tractor import requirements ...31
4.3 Good practices for tractor standards and safety ...31
5.1 Good practices for MFI regulations ...36
5.2 Good practices for credit union regulations ...37
5.3 Good practices for agent banking regulations ...38
5.4 Good practices for e-money regulations ...39
5.5 Good practices for warehouse receipt systems ...39
6.1 Good practices for phytosanitary regulation ... 46
6.2 Good practices for regulations related to agricultural producers...47
7.1 Good practices for road transport licensing systems ...55
7.2 Transport rights definitions ...59
Figures 1 Data collection, verification and analysis ... xv
1.1 Regional performance on EBA indicators ...4
1.2 In Sub- Saharan Africa, countries show different levels of regulatory good practices ... 5
1.3 High-income countries have regulations in place that reflect a higher regulatory quality ... 5
1.4 Urbanized countries have a better EBA performance than transforming and agriculture-based countries ... 6
1.5 Countries with smarter regulations on market operations also promote quality control... 7
1.6 Better rules on market operations are associated with more efficient trade requirements ... 7
1.7 Regions with similar rules show different costs for registering a new seed variety ... 8
1.8 Regions with similar rules have different time durations in fertilizer registration ...8
1.9 Agribusiness rules in Greece are the least discriminatory, while Ethiopia, Lao PDR and Myanmar have potential to improve ... 9
1.10 Specific information on requirements for agribusiness are most accessible in Denmark and Spain and least accessible in Rwanda ... 10
2.1 Countries mostly score better on seed development and certification indicators, while seed registration proves more challenging ...13
2.2 The lower-middle-income and low-income countries show the greatest variation in official registration costs ...15
2.3 In the majority of countries studied with a variety release committee, the private sector is involved in the variety release process ...17
2.4 EBA countries with mandatory maize certification predominantly restrict its implementation to public sector actors ...17
3.2 The time to register new fertilizer products ranges from 15 to 1,125 calendar days ...22
3.3 Registration takes less time but is most costly in countries where it needs to be done only once ...23
3.4 The cost to register as an importer ranges from 0 to 57.5% of income per capita ...24
3.5 Over half of the surveyed countries do not prohibit the sale of open fertilizer bags — and those that do, do not always have a penalty for it ...25
4.1 Denmark, Greece, Spain, the Philippines and Poland have the top five scores in the aspects measured by the machinery topic ...28
4.2 The cost to register imported tractors is highest in Sudan ...29
4.3 Mozambique and Bangladesh impose high costs on importers of agricultural tractors ...32
5.1 The Kyrgyz Republic is the only country that scores above average on all five indicators ...35
5.2 Almost half the countries that allow MFIs to take deposits require a higher capital adequacy ratio for MFIs than for commercial banks ...37
5.3 Countries are at different stages of developing legal frameworks to regulate agent banking activities ...38
5.4 Three of the five top performers on regulations related to warehouse receipts are in Sub- Saharan Africa ...40
6.1 EBA markets scores overall and by indicator ...44
6.2 Time to obtain per-shipment export documents is greater in low-income and lower-middle income countries on average, and it varies greatly within income group ...45
6.3 Obtaining a phytosanitary certificate is less expensive in high-income countries, but takes less time in upper-middle-income countries ...47
6.4 Cash crops are subject to more trader licensing and membership requirements than other product groups and thus to higher costs ... 48
6.5 Similar trader licensing and membership requirements are imposed in countries where cash crops are studied ... 49
6.6 It is on average faster and less expensive to complete per-shipment documents when exporting to regional or bilateral trading partners ... 50
7.1 High-income countries tend to have more regulations that promote market access and operations and cross-border transport ... 54
7.2 Transport license systems vary across regions ...55
7.3 Truck-level licenses are issued more expeditiously than other regulated systems ...56
7.4 Company licenses are more cost-effective than other licensing systems ...56
7.5 Company-license systems record greater user satisfaction ...57
7.6 The cost of technical inspection is not a constraint in most countries, but some disparity is observed in its relative cost ...58
7.7 Only a few countries allow cabotage ...59
7.8 Regulations in OECD high-income countries demonstrate greater openness to cross-border competition, while countries in South Asia and East Asia and the Pacific tend to limit the scope of operations for foreign firms ... 60
Map
1 Geographical coverage of Enabling the Business of Agriculture 2016 ... xiv
Tables 1 Assigning scores to legal and regulatory dimensions helps governments define good practices ...xii
2 Time and motion indicators reflect the efficiency of administrative processes related to a country’s regulatory system ... xiii
3 EBA questionnaires use a standard business case with assumptions ... xvi
1.1 Colombia, Denmark, Greece, Poland and Spain score above average in all EBA topics ... 2
2.1 Variety release committees meet after each cropping season in most countries ... 16
3.1 Cost and time to register a new fertilizer ...22
4.1 Countries where post-sale services are required by law... 30
8.1 EBA topic areas focus on constraints relevant to women’s participation in agribusiness ...69
A.1 Legal indicators per topic and cross-cutting category ...77
A.2 Time and motion indicators per topic and cross-cutting category ...77
B.1 Scoring methodology for seed ... 81
B.2 Scoring methodology for fertilizer ... 84
B.3 Scoring methodology for machinery ... 88
B.4 Scoring methodology for finance ...92
B.5 Scoring methodology for markets ... 99
B.6 Scoring methodology for transport ...103
C.1 Discrimination of agribusiness regulations data by topic ... 106
The challenge of feeding a world population of 9 billion people by 2050 can be met only through vibrant, productive, profitable and sustainable food and agriculture sectors, par-ticularly in developing countries, where the bulk of food is grown and consumed. Similarly, well-functioning agricultural markets and agribusinesses that are inclusive and efficient — and that optimize the sustainable production and distribution of food — are essential for a food-secure future for all.
The numbers relating to the agriculture and food sectors are stark and the challenges multifaceted. Currently, more than 800 million people go to bed hungry every day. Food demand is projected to rise globally by at least 20% over the next 15 years, with the largest increases in Sub- Saharan Africa, South Asia and East Asia. At the same time, agriculture is both a contributor to climate change, accounting for 25% of greenhouse gas emissions, and is adversely affected by it. Agricultural value chains need to be dynamic, productive and efficient if the sector is both to thrive in the face of climate change and to be part of the solution.
The World Bank Group’s Enabling the Business of Agriculture (EBA) project measures and monitors regulations that affect the functioning of agriculture and agribusiness. The ulti-mate aim is to promote smart regulations that ensure efficient processes that support thriving agribusinesses as well as safety and quality control.
Building on the findings of a pilot phase last year, the World Bank Group is pleased to pres-ent this first full edition of Enabling the Business of Agriculture: Comparing Regulatory Good
Practices. It provides analysis and results from 40 countries, covering all world regions and
all income groups.
Eighteen indicators, covering six topics, have been developed to address various aspects relating to production inputs and market enablers that facilitate farmers, firms and pro-ducers to sell their goods and services. The indicators measured in this year’s report cover seed, fertilizer, machinery, finance, transport and markets. Four additional topics — land, water, livestock, and information and communication technology — are under development and will be included in next year’s report. Two overarching themes — environmental sus-tainability and gender — have also been explored so that the indicators being developed encourage inclusive and sustainable practices.
Given the significant public interest in the EBA project, and as part of its commitment to openness and transparency, the EBA team continues to seek input from relevant stake-holders and experts to further strengthen the research methodology and analytics as well as expand country coverage. We invite you to provide comments on the EBA website at http://eba.worldbank.org/.
As the international development community accelerates efforts to achieve the new Sustainable Development Goals, particularly SDGs 1 and 2, which call for ending extreme poverty and hunger by 2030, sustainable development of the food sectors and agriculture must be at the front and center of the global community’s response. This publication and its findings contribute to that overall effort.
Augusto Lopez-Claros
Juergen Voegele
FOREWORD
Augusto Lopez-Claros Director
Global Indicators Group World Bank Group Juergen Voegele Senior Director
Agriculture Global Practice World Bank Group
Enabling the Business of Agriculture 2016 was prepared jointly by
the World Bank’s Agriculture Global Practice, under the general direction of Juergen Voegele, Ethel Sennhauser, Preeti Ahuja and Mark Cackler and the Development Economics Vice Pres-idency’s Global Indicators Group, under the general direction of Augusto Lopez-Claros. Federica Saliola and Farbod Youssefi managed the project, with the support from Tea Trumbic, Cesar Chaparro-Yedro and Raian Divanbeigi. The team would like to acknowledge the support of Indermit Gill and Melissa Johns. Current and former team members included Dinah Bengur, Liwam Berhane, Gerawork Bizuneh, Martha Branigan-Sutton, Rong Chen, Dariga Chukmaitova, Davida Louise Connon, Côme Dechery, Robert de l’Escaille, Nuria de Oca, Nealon Devore, Sarah Diouri, Margarita Diubanova, Soha Eshraghi, Julia Isabel Navarro Espinal, Leopoldo Fabra, Felix Frewer, Taras Gagalyuk, Arnau Gallard-Agusti, Bill Garthwaite, Gabriel Simoes Gaspar, Slavena Georgieva, Jean Philippe Lodugnon Harding, Pilar Jano, Marketa Jonasova, Edna Kallon, Marina Kayumova, Milan Kondic, Maksat Korooluev, Alva Kretschmer, Valerie Marechal, Jason McMann, Thibault Meilland, Arturo Francisco Bonilla Merino, Charlotte Merten, Nina Paustian, Aditi Poddar, Anis Ragland, Kateryna Schroeder, Justin Lee Schwegel, Samjhana Thapa, Yasmine Umutoni, Marielle Lily Walter, Lechi Zhang and Yucheng Zheng. Assisting with data collection were Ayuen Ajok, Ibrahim Alturki, Omar Alzayat, Yulia Amanbaeva, Sasha Boshart, Luiza Casemiro, Esperanza Pastor Núñez de Castro, Salma Ehsan Cheema, Maria-Magdalena Chiquier, Marie-Lily Delion, Timila Dhakhwa, Laura Diniz, Iana Djekic, Xiaquan Fang, Cecile Ferro, Albina Gasanbekova, David William Green, Megan Hyndman, Tatiana Ivanicichina, Parviz Jabarov, Gulnur Kerim-kulova, Julian Koschorke, Yuhan Liu, Felipe Magofke, Charlotte Filiz Merten, Yedesdes Y Mudessir, Meirzhan Myrzaliyev, Trang Nguyen, Maria Antonia Quesada Gamez, Parvina Rakhimova, Byron Sacharidis, Valentina Saltane, Stephanie Samayoa, Atik Kiran Shah, Bungheng Taing, Herve Tchakoumi, Hulya Ulku, Jedadiah Douglas Winter, Xiao, Beibei Yan, Cem Berk Yolbulan, Diana Zeng, Geyi Zheng, Jingwen Zheng and Lilin Zheng. The team is grateful to local consultants who supported data collec-tion or helped the team during the EBA team’s country visits: Arun Saha (Bangladesh), Sidiki Soubeiga (Burkina Faso), Fitsum Aregawi (Ethiopia), Mohammad Issa Mousa (Jordan), Olay-vanh Singvilay (Lao PDR), Tidiane Diarisso (Mali), Moham-med Bajeddi (Morocco), Dalfino Hoster Guila (Mozambique), Khin Sw Swe Aye (Myanmar) and Mohamed Osman Hussein (Sudan). The team is grateful for administrative assistance to Maisha Hyman, Rose Gachina, Monique Pelloux and Ramon Yndriago.
Andrew Goodland, Chris Jackson, Aart Kraay and Patrick Verissimo reviewed the full draft report and provided feedback. The team is also grateful for valuable comments and reviews provided by external experts as well as colleagues across the World Bank Group, in particular those in the 40 World Bank
Group country offices and those working on several key areas investigated by the report. The team would especially like to acknowledge the hard work of the following individuals in the country offices who helped distribute questionnaires and validate the data: Faten Abdulfattah, Nada Abou-Rizk, Ruvejda Aliefendic, Moustafa Alver, Luis A. Aviles, Amadou Ba, Purna Bahadur Chhetri, Tran Bao Thi Nguyen, Julia Barrera, Raul Barrios, Amina Beidari Bertho, Aurelien Beko, Oliver Braedt, Olena Bychyk, Barbara Calvi, Mudita Chamroeun, Marie Gene-vieve Compaore, Luis Constantino, Tesfahiwot Dillnessa, Hadi-dia Djimba, Hosna Ferdous Sumi, Carlos Francisco Siezar, Larisa Fugol, Augusto Garcia, Patricia Gutierrez, Mistre Hailemariam Mekuria, Michael Hamaide, Amani Haque, Jairi Hernandez, Van Hoang Pham, Chris Jackson, Kutemba Kambole, Leszek Kasek, Gwladys Nadine Isabelle Kinda, Krista Kroff, Seenith-amby Manoharan, Chanhsom Manythong, Joanna Mariscal, Kunduz Masylkanova, Mohamed Medouar, Tania Meyer, Manolo Morales, Mayela Murillo, Alice Museri, Aymen Musmar Ali, Belinda Mutesi, Alex Mwanakasale, Judith Mziray, Clarisse Nhanbangue, Anne Njuguna, Francisco Obreque, Alice R. Ouedraogo, Bigyan Pradhan, Maria Theresa Quinones, Nikos Schmidt, Daniel Sellen, Tara Shrestha, Vatthana Singharaj, Bintou Sogodogo, Heinz Strubenhoff, Tamara Sulukhia, Sugata Talukder, Tam Thi Do, Miss Thiri, Shewaye Yalew Shumye and Sergiy Zorya. Comments on the report were received from: Alejandro Alvarez de la Campa, Jamie Anderson, Maria Antip, Oya Pinar Ardic Alper, Joshua Ariga, Raimonds Aronietis, Sarat Babu Gidda, Derek Baker, Thomas Bauer, Keith Belk, Todd Benson, Shawki Bhargouti, Jos Bijman, Zhao Bing, Florentin Blanc, Marcel Bruins, Balu Bumb, Victor Bundi Mosoti, Stefano Burchi, Francois Burgaud, Jacob Burke, Christina Katharina Busch, Frederic Bustelo, Yi Cai, Jo Caldihon, David Casanova, Julie Caswell, Lawrence Clarke, Rick Clayton, Mark Constan-tine, Joe Cortes, Gily Cowan, Barney Curtis, Morgane Danielou, Roger Day, Alexandra de Athayde, Philip de Leon, Claus Deblitz, Klaus Deininger, Chistopher Delgardo, Hans Dellien, Brigitte Dias Ferreira, Eugenio Diaz-Bonilla, Grahame Dixie, Carel du Marchie Sarvass, Stefano Duilgheroff, Indira Ekanayake, Jorge Escurra, Natalia Federighi de Cuello, Erick Fernandes, Vincenzo Ferraiuolo, Francis V. Fragano, Ade Freeman, Francois G. Le Gall, Pierra Jean Gerber, John Gibson, Ian John Douglas Gillson, Tanja K. Goodwin, Naoki Goto, Lars Nikolajs Grava, David Groenfeldt, Arian Groot, Vincent Guyonnet, Thomas Hammond, Craig Hanson, Adelaida Harris, Robert John Hatton, Terhi Havimo, Tazeen Hasan, Norbert Henninger, Thea Hilhorst, Martin Hilmi, Marlynne Hopper, Jens Hügel, Ankur Huria, Sarah Iqbal, Juan Carlos Izaguirre, Devra Jarvis, Peter Jeffries, Chakib Jenane, David John, Scott Justice, Jari Kauppila, John C. Keyser, Josef Kienzle, Kaoru Kimura, Olivia Kiratu, Matthew Kirk, Justin Kosoris, Musa Kpapa, Dilip N. Kulkarni, Charles Kunaka, Andrea Kutter, Andrzej Kwiecinski, Lloyd Le Page, Zvi Lerman, Steven Lonergan, Isabel Lopez Noriega, Youlia Lozanova, Dibungi Luseba, Nathaniel Makoni, John McDermot,
ACKNOWLEDGMENTS
Michael McGowan, Ruth Meizen-Dick, Frederic Meunier, Niels Morel, Nancy Morgan, Mohinder Mudahar, Jorge Munoz, Ajay Nair, Shankar Narayanan, Nick Nwakpa, Francois Onimus, David Orden, Theresa Osborne, Washington Otieno, Maria Claudia Pachon, Maria Pagura, Enrique Pantoja, Roy Parizat, Valentina Paskalova, François-Marie Patorni, Judith Payne, Andrew Peters, Patrick Philipp, Ugo Pica-Ciamarra, Caroline Plante, Natalia Pshenichnaya, Markus Reinisch, Alain Reocreux, Romano Righetti, Philippe Benjamin Rivoire, Loraine Ronchi, Max Rothschild, Judith Rudolph, Marieta Sakalian, Salman M. A. Salman, Aguiratou Savadogo-Tinto, Sara Savastano, Susanne Scheierling, Andres Seargent, Harris Selod, Carlos Sere, Bekzod Shamsiev, Walter Simon de Boef, Melvin Spreij, Victoria Stan-ley, Nancy Sundberg, Johan Swinnen, Virginia Tanase, Michael Tarazi, Felipe Targa Rodriguez, Dhanaraj Thakur, David Tipping, Muhabbat Turdieva, Joyce M. Turk, Laurian Unnevehr, Kishor Uprety, Anke van den Hurk, Kees van der Meer, Kristine Van Herck, Suzanne van der Velden, Panos Varangis, Grégoire Verdeaux, Francesco Versace, Laura Villamayor, Bert Visser, Brian Wickham, Joshua Seth Wimpey, Bruce Wise, Justin Yap, Winston Yu and Ivan Zavadsky.
The Enabling the Business of Agriculture program was developed in partnership with several donors, whose funding and support makes this report possible: the Bill & Melinda Gates Founda-tion, the Department for International Development (DFID), the Danish Ministry of Foreign Affairs, the United States Agency for International Development (USAID) and the Government of the Netherlands.
The Enabling the Business of Agriculture 2016 outreach strategy is being executed by a communications team led by Indira Chand and Sarwat Hussain, supported by Hyun Kyong Lee and Zia Morales. The development and management of the Enabling
the Business of Agriculture website and technical services were
supported by Varun V. Doiphode, Andres Baquero Franco, Fengsheng Huang, Kunal Patel, Rajesh Sargunan, Vinod Vasudevan Thottikkatu and Hashim Zia.
The report was edited and designed by Communications Development Incorporated, led by Bruce Ross-Larson and including Joe Caponio, Mike Crumplar, Lawrence Whiteley and Elaine Wilson.
The Enabling the Business of Agriculture 2016 report benefited from the generous input from a network of more than 2,500 local experts, including lawyers, business associations, private sector representatives, farmers’ organizations, academics, government officials and other professionals actively engaged in the policy, legal and regulatory requirements in the 40 coun-tries covered during the second year. Please note that the data published in the report and online represent a unified response based on the answers the team received from various respon-dents and sources and are not attributed to any particular respondent. Wherever possible, answers were corroborated by official fee schedules, laws, regulations and public notices. The names of those wishing to be acknowledged individually are listed at the end of the report and are made available on the website at: http://eba.worldbank.org.
Agriculture and the business created by it are major sources of income and employment for a large share of the world’s people. Vital for food securi-ty and poversecuri-ty reduction, the business of agriculture affects rural livelihoods everywhere.
Growing food demands call for greater attention to strategies to develop the business of agriculture. Indeed, meet-ing the rismeet-ing food demand of a global population expected to reach 9 billion people by 2050 is a major challenge — even more so in the face of increasingly adverse natural conditions.1 The
evolu-tion of urban food demand in developing regions illustrates the need for agricul-tural value chains and institutional set-tings that are both more efficient and more effective.
An enabling environment for the busi-ness of agriculture is critical to respond to evolving market trends. It includes macroeconomic and sector-specific laws, policies, regulations, support ser-vices, information structures and labor force preparedness. It sets the stage for all business activities that have to do with producing goods on farms and transport-ing them to processors and consumers. Understanding this environment can help create policies that facilitate doing business in agriculture and increase the investment attractiveness and competi-tiveness of countries.2
Enabling the Business of Agriculture 2016
measures regulations that impact firms in the agribusiness value chain, provid-ing data and analysis that allow policy makers to compare their country’s laws and regulations with those of others.
Clear and accessible laws foster a busi-ness environment that benefits all mar-ket players — from farmers, including the more vulnerable such as female farmers and smallholders, to consumers and large investors. But when regulations are too complex, unpredictable or discrim-inatory, they raise costs and cut incen-tives to enter formal and competitive markets. A World Bank study in Ethiopia in 2012 showed that a weak regulatory system that fails to guarantee seed qual-ity results in farmers paying higher pric-es for seed of suboptimal quality, with yields up to 50% lower than expected.3
In Mali agricultural cereal traders ranked regulatory uncertainty among the tough-est barriers to market entry.4
What does Enabling the Business of Agriculture 2016 measure?
Enabling the Business of Agriculture 2016
enables policymakers to identify and analyze legal barriers for the business of agriculture and to quantify transaction costs of dealing with government regu-lations. Ten topics have been developed to cover different aspects of production inputs and market enablers: seed, fertil-izer, machinery, finance, markets, trans-port, information and communication technology (ICT), land, water and live-stock. Two overarching themes — gender and environmental sustainability — have been investigated to ensure that the indi-cators being developed encourage inclu-sive and sustainable practices. Although women are 43% of the global agricultur-al workforce, they face many constraints that limit their participation in agricul-tural value chains. This report includes a review of issues that are restrictive for
women in the topics covered. Because of agriculture’s dependence on natural resources, the environmental sustain-ability topic investigates plant genetic resources and water resources man-agement. Both will be developed further next year.
The choice of indicators was guided by a review of academic literature and case studies and by consultations with key stakeholders, including civil society organizations, partner institutions, prac-titioners, public and private sector rep-resentatives, researchers and technical experts.
Regulations are the bedrock of a coun-try’s enabling environment. Well-de-signed laws and regulations — supported by strong institutions and efficient administrative procedures — are neces-sary for agriculture to prosper.
The Enabling the Business of Agriculture methodology targets smart regula-tion in each of the measured areas for inputs and enablers. Smart regulation — striking the right balance in ensuring proper enforcement of essential safe-ty and qualisafe-ty control while avoiding excessive regulatory burdens for value chain players — is good for the business of agriculture. It can improve services and products and lower costs. EBA con-siders more than the sheer number of regulations and does not necessarily promote deregulation. In fact, several indicators, such as fertilizer quality con-trol and domestic plant protection, pro-mote more regulation since the laws and regulations need to set appropriate stan-dards in these areas to ensure health and food safety.
ABOUT ENABLING THE
BUSINESS OF
Enabling the Business of Agriculture 2016
presents two types of indicators. De
jure or “legal” indicators stem
direct-ly from reading the laws and regula-tions to measure their quality. De facto or “time and motion” indicators reflect the efficiency of a country’s regulatory environment — such as the number of procedures and the time and cost to register fertilizer products, register seed for sale and export agricultural goods. All indicators were designed using specific rules that are applied equally across countries to ensure that the data are comparable.
A key development presented in this year’s report is the scoring methodol-ogy for legal indicators on six topics: seed, fertilizer, machinery, finance, markets and transport. This methodol-ogy assigns scores to certain legal and regulatory dimensions and serves one of the main objectives of the Enabling
the Business of Agriculture project: to
provide governments with defined good practices that can inform policy-making and trigger reforms based on the examples of other countries. The scoring groups various data points for all six topics around three cross-cutting categories:
• Operations indicators measure the requirements for local companies to enter the market and conduct agri-business activities.
• Quality control indicators measure the regulations governing plant protection, the safety standards for users of agricultural machinery and the quality control associated with seeds and fertilizer products. • Trade indicators measure trade
restrictions on exporting agricul-tural products, importing fertilizer and tractors and transporting goods across borders.
Comparative results on countries’ laws and regulations help identify weakness-es and highlight ways to overcome them. The scores were developed at the indi-cator, topic and cross-cutting category levels (table 1). The rules for scoring each question are described by topic in the
Topic Data Notes (appendix B).
Time and motion indicators, although presented and analyzed in the report, are not assigned a particular score (table 2). The reason is that some processes are clearly necessary, as with the tests for evaluating and registering new seed eties and the technical review by a vari-ety release committee, while others may be redundant, as with additional ministe-rial approval after the technical review. Since the times for taking the tests depend both on regulations and country cropping seasons, it would be unfair to penalize countries for their geographical conditions. The individual good practices have been singled out and scored under TABLE 1 Assigning scores to legal and regulatory dimensions helps governments define good practices
OPERATIONS QUALITY CONTROL TRADE
SEED
Seed registration (0–100) Seed development and
certification (0–100)
SEED SCORE (0–100)
FERTILIZER Fertilizer registration (0–100) Fertilizer quality control (0–100)
Fertilizer import requirements (0–100)
FERTILIZER SCORE (0–100) MACHINERY Tractor dealer requirements
(0–100)
Tractor standards and safety (0–100)
Tractor import requirements (0–100) MACHINERY SCORE (0–100) FINANCE Microfinance institutions (0–100) Credit unions (0–100) Agent banking (0–100) E-money (0–100) Warehouse receipts (0–100) FINANCE SCORE (0–100)
MARKETS Production and sales (0–100) Plant protection (0–100) MARKETS SCORE
(0–100)
TRANSPORT Truck licenses (0–100) Cross-border transportation
(0–100)
TRANSPORT SCORE (0–100) OPERATIONS SCORE
(0–100)
QUALITY CONTROL SCORE (0–100)
TRADE SCORE (0–100)
the legal indicators. They were grouped in the categories on operations and trade requirements. The methodology on time and motion indicators will be further developed next year.
Building on findings presented in the 2015 progress report covering 10 coun-tries, Enabling the Business of
Agricul-ture 2016 covers 40 countries in seven
regions (map 1).5 Different criteria have
been used to select the countries, includ-ing ensurinclud-ing adequate representation of all regions and different levels of agricul-tural development. Data collection will be further scaled up to 60 countries in 2016.
How are the data collected?
Enabling the Business of Agriculture
indica-tors are based on primary data collection through standardized questionnaires completed by expert respondents in each target country. Once the data are collected and analyzed, several follow-up rounds address and clear up any discrep-ancies in the answers the respondents provide, including conference calls and written correspondence. The preliminary answers are then finalized and shared with governments for further validation.
The data in this report are current as of March 31, 2015, and do not reflect any changes to the laws or administra-tive procedures after that date. Figure 1 shows the steps in the process from data collection to public release.
Chosen from the private sector, the pub-lic sector and civil society, respondents include firms, academia, financial insti-tutions, professional associations, farm-er organizations and govfarm-ernment min-istries and agencies. These individuals and organizations know their countries’ laws and regulations and how they affect people involved in agriculture. Involving various experts increases the accuracy of the data by balancing the possible bias-es of different stakeholders. So reaching out to both the private and public sectors helps compare the perspectives of all parties.
Enabling the Business of Agriculture data
are collected in a standardized way to ensure comparability across countries and over time. Following the method-ological foundations of Doing Business,6
questionnaires use a standard business case with assumptions about the legal form of the business, its size, its loca-tion and the nature of its operaloca-tions for each topic applied for all countries (table
3). Assumptions guiding respondents through their completion of the survey questionnaires vary by topic (see Topic
Data Notes in appendix B). In addition, in
the interest of comparability, the values in the assumptions are not fixed values but proportional to the country’s gross national income (GNI) per capita. What does Enabling the Business of Agriculture not measure?
Many elements that shape a country’s enabling environment are not captured by Enabling the Business of Agriculture indicators. Broader macro-level aspects pertaining to the political, social and eco-nomic spheres of a country, for example, shape the climate of its economy, but are not now an area that EBA covers.
Policies, institutions, infrastructure and support services — many shaping a country’s capacity to implement and enforce its regulations — are also key determinants of the enabling environ-ment that Enabling the Business of
Agri-culture 2016 has not targeted. Other
vari-ables characterizing the market — such as prices, stock market trends, govern-ment expenditures and investgovern-ments — are not directly comparable and require TABLE 2 Time and motion indicators reflect the efficiency of administrative processes related to a country’s regulatory system
OPERATIONS QUALITY
CONTROL TRADE
SEED Seed registration:Procedures, time and cost
FERTILIZER
Fertilizer registration: Procedures, time and cost
Fertilizer imports:
Cost of import permit and importer registration for importers of fertilizer
MACHINERY
Tractor imports:
Cost of import permit and importer registration for importers of tractors
FINANCE
MARKETS Agricultural exports:
Documents, time and cost (per shipment)
TRANSPORT
Truck licenses:
Time, cost and validity of company licenses, truck permits and vehicle inspections
a methodology outside the scope of
EBA’s current capacity. While EBA is
interested in expanding into these areas, they are not covered by this report’s indicators.
Much activity in rural areas, from employment to the production and sale of goods, happens through informal channels. The complexity of regulations and the time and cost they impose, could be reasons for this, as could the quality of institutions, extension services and physical infrastructure. The current focus of indicators presented in this report is on measuring official laws and regula-tions and not these other areas.
Benchmarking has its benefits and limita-tions. Quantitative data and benchmarks can be effective in stimulating debate about policy, enhancing the ability of policymakers to assess progress over time and making meaningful international comparisons. But using assumptions to ensure global coverage and comparabil-ity across countries can generalize and exclude some context-specific informa-tion. To address some of these limitations, understand what regulatory reforms are most effective and see how these issues are shaped by the context, data must be consistently collected over a number of years to combine global benchmarks with context-specific information.
What is in this year’s report?
This year’s report presents the main results of the team’s effort over the last 12 months to collect and analyze new data and to develop indicators that can help governments make informed decisions about the enabling environ-ment for agribusiness activity in their countries.
Feedback is welcome on the data, methodology and overall project design to make future Enabling the Business of
Agriculture reports even more useful.
Feedback can be provided on the project website: http://eba.worldbank.org. MAP 1 Geographical coverage of Enabling the Business of Agriculture 2016
Burkina Faso Nicaragua Guatemala Colombia Bolivia Chile Denmark Poland Ukraine Greece Spain Morocco Mali Côte d’IvoireGhana Niger Ethiopia Kenya Uganda Rwanda Burundi Tanzania Zambia Mozambique Jordan Turkey Georgia Tajikistan Kyrgyz Rep. Nepal Bangladesh Myanmar Sri Lanka Lao P.D.R. Vietnam Cambodia Philippines Russian Federation Sudan Bosnia & Herz. This map was produced by the Map Design Unit of The World Bank.
The boundaries, colors, denominations and any other information shown on this map do not imply, on the part of The World Bank Group, any judgment on the legal status of any territory, or any endorsement or acceptance of such boundaries.
GSDPM
Map Design Unit
IBRD 42022 | NOVEMBER 2015
Pilot countries
Data collected by email, telephone, or personal interviews Questionnaires emailed to local respondents in the
measured countries
Selected data verified through desk reviews of available resources, including country laws reviewed by legal experts
Data consolidated and analyzed
Data aggregated using various scoring methodologies to construct indicators
Multiple rounds of follow-up conducted with questionnaire respondents to validate data
Enabling the Busines of Agriculture 2016 report and indicators
peer reviewed
Data shared for validation and review with governments and World Bank Group country offices
Public launch of Enabling the Busines of Agriculture 2016 report and online database
Enabling the Busines of Agriculture 2016 report and indicators
cleared by World Bank Group management
Step 10 Step 9 Step 8 Step 7 Step 6 Step 5 Step 4 Step 3 Step 2 Step 1
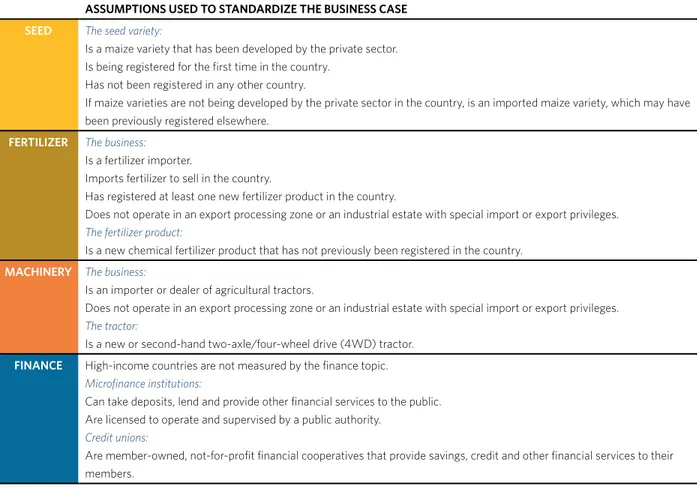
TABLE 3 EBA questionnaires use a standard business case with assumptions ASSUMPTIONS USED TO STANDARDIZE THE BUSINESS CASE
SEED The seed variety:
Is a maize variety that has been developed by the private sector. Is being registered for the first time in the country.
Has not been registered in any other country.
If maize varieties are not being developed by the private sector in the country, is an imported maize variety, which may have been previously registered elsewhere.
FERTILIZER The business:
Is a fertilizer importer.
Imports fertilizer to sell in the country.
Has registered at least one new fertilizer product in the country.
Does not operate in an export processing zone or an industrial estate with special import or export privileges.
The fertilizer product:
Is a new chemical fertilizer product that has not previously been registered in the country.
MACHINERY The business:
Is an importer or dealer of agricultural tractors.
Does not operate in an export processing zone or an industrial estate with special import or export privileges.
The tractor:
Is a new or second-hand two-axle/four-wheel drive (4WD) tractor.
FINANCE High-income countries are not measured by the finance topic.
Microfinance institutions:
Can take deposits, lend and provide other financial services to the public. Are licensed to operate and supervised by a public authority.
Credit unions:
Are member-owned, not-for-profit financial cooperatives that provide savings, credit and other financial services to their members.
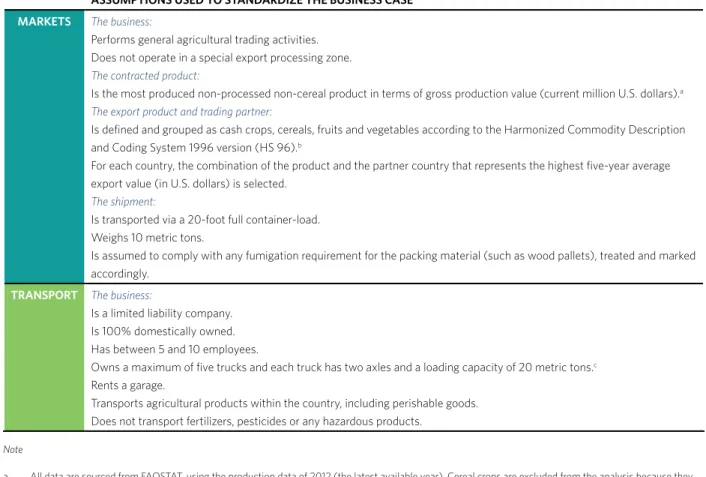
ASSUMPTIONS USED TO STANDARDIZE THE BUSINESS CASE MARKETS The business:
Performs general agricultural trading activities. Does not operate in a special export processing zone.
The contracted product:
Is the most produced non-processed non-cereal product in terms of gross production value (current million U.S. dollars).a The export product and trading partner:
Is defined and grouped as cash crops, cereals, fruits and vegetables according to the Harmonized Commodity Description and Coding System 1996 version (HS 96).b
For each country, the combination of the product and the partner country that represents the highest five-year average export value (in U.S. dollars) is selected.
The shipment:
Is transported via a 20-foot full container-load. Weighs 10 metric tons.
Is assumed to comply with any fumigation requirement for the packing material (such as wood pallets), treated and marked accordingly.
TRANSPORT The business:
Is a limited liability company. Is 100% domestically owned. Has between 5 and 10 employees.
Owns a maximum of five trucks and each truck has two axles and a loading capacity of 20 metric tons.c
Rents a garage.
Transports agricultural products within the country, including perishable goods. Does not transport fertilizers, pesticides or any hazardous products.
Note
a. All data are sourced from FAOSTAT, using the production data of 2012 (the latest available year). Cereal crops are excluded from the analysis because they are less suitable for agricultural production contracts due to certain characteristics, including the high risks of side-selling due to well-developed local or export markets, the reduced need for technical assistance in order to meet market specifications and the smaller price differentials at each point in the supply chain.
b. All data are sourced from the UN Comtrade Database, using the export data from 2009–13. c. A truck is defined as one tractor unit, excluding the trailer.
Notes
1. FAO 2009. 2. FAO 2013. 3. World Bank 2012.
4. Diallo and others 2010; Staatz and others 1989.
5. Pilot countries were Ethiopia, Gua-temala, Morocco, Mozambique, Nepal, the Philippines, Rwanda, Spain, Uganda and Ukraine. For more information on the EBA 2015 progress report, please visit http:// eba.worldbank.org.
6. http://www.doingbusiness.org.
References
Diallo, B., N. Dembélé and J. Staatz. 2010. “Analyse des prix de pari-té en Afrique de l’Ouest: Le cas du riz depuis la crise de 2007–2008. Rapport de synthèse proviso ire.” Food Security Collaborative Working Paper 57243, Michigan State Uni-versity, Department of Agricultural, Food and Resource Economics. FAO (Food and Agriculture
Organiza-tion). 2009. How to Feed the World
by 2050. Rome: FAO.
———. 2013. Enabling Environments for
Agribusiness and Agro-industries Development: Regional and Country Perspectives. Rome: FAO.
Staatz, J.M., J. Dioné and N. Dembélé. 1989. “Cereals Market Liberalization in Mali.” World Development 17 (5): 703–18.
World Bank. 2005. Doing Business 2006:
Creating Jobs. Washington, DC:
World Bank.
———. 2012. Agribusiness Indicators:
The Enabling the Business of
Agricul-ture 2016 report covers 40 countries
in seven regions. Ten topics have been developed to measure regulations that can impact firms in the agribusiness value chain, providing data and analy-sis that allow policy makers to compare their country’s laws and regulations with those of others. A scoring method-ology that is based on good practices in relevant regulatory dimensions has been developed for 6 of the 10 topics measured: seed, fertilizer, machinery, finance, markets and transport; the remaining topics (land, water, livestock and ICT) will be further developed and scored next year.
Enabling the Business of Agriculture
pro-motes smart regulations that ensure safety and quality control while at the same time promote efficient regulatory processes that support agribusiness-es. Regulation in agriculture is justified to address market failures and protect safety, health and the environment. But some governments do not tackle these issues through appropriate regulation. Regulations may introduce burdensome procedures that shift economic activi-ty to greater informaliactivi-ty and corruption without even attaining the original objec-tives.1 So it is important to assess the
effi-ciency and quality of specific regulations. The EBA methodology highlights smart regulation in each of the measured areas. This methodology has been informed by an extensive literature review and con-sultations with experts.
For chemical fertilizers, for example, controls are necessary to prevent dam-age to the soil and adulterated fertiliz-er use but excessive tests that prolong fertilizer registration for years and cost thousands of dollars are difficult to defend.2 Similarly burdensome import
procedures, which require fertilizer importers to make purchases months in advance, can hinder market access.
EBA assigns higher scores to countries
with laws requiring the labeling of fertil-izer and prohibiting the sale of open or
mislabeled fertilizer bags. At the same time, countries that allow the private sector (including foreigners) to import fertilizers or do not require re-registra-tion if the product has been already reg-istered in another country are also seen as following good practices and given high scores.
Smart regulations can improve products and services and lower costs for agri-businesses. Specific country examples in the agricultural sector show the impact of good regulatory reform on improving the supply and lowering the prices in the seed and mechanization markets in Ban-gladesh and Turkey,3 in the fertilizer
sec-tor in Bangladesh,4 Kenya5 and Ethiopia6
and in the maize industry in Eastern and Southern Africa,7 among others.
But apart from these country-specif-ic examples, there are few data that can help to better understand the link between regulations and agricultural productivity on a global scale. Extensive literature on the matter focuses on the existence or quantity of regulations, but few studies look at the quality of those regulations.8 EBA attempts to fill this gap
by assessing regulatory quality across a wide range of countries, thus providing a basis to understand how regulations affect economic outcomes.
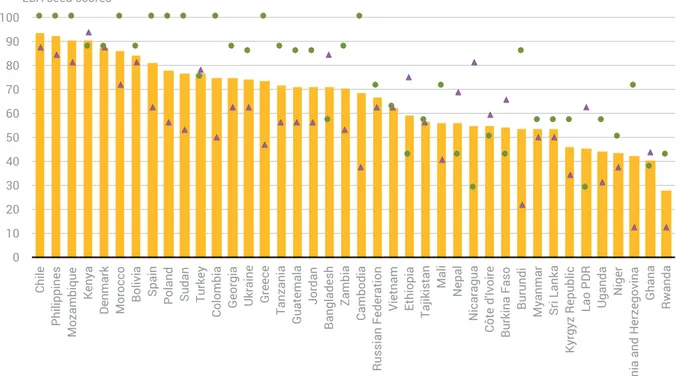
Where are agribusiness regulations smarter?
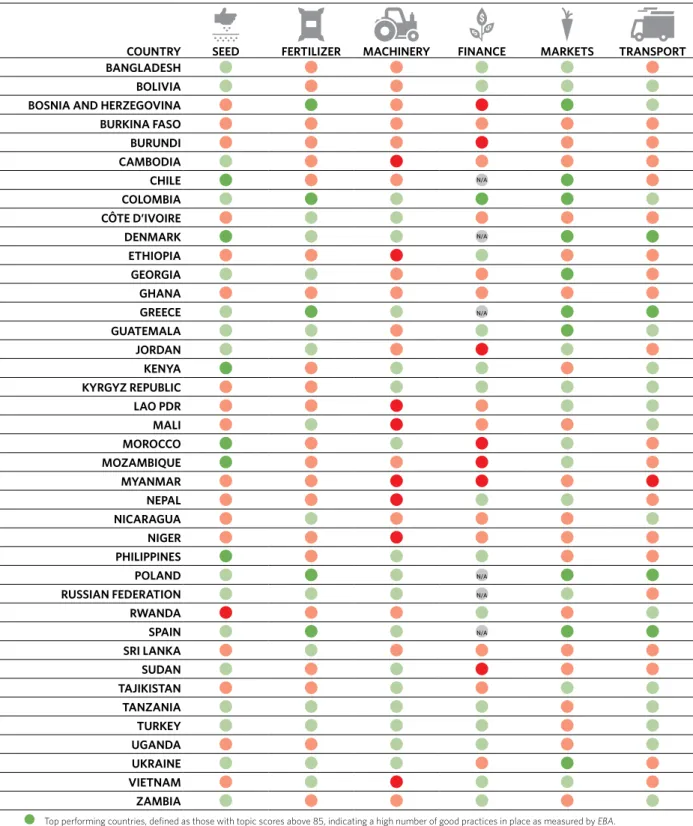
A color coding system displays a syn-thetic measure of a country’s EBA score in a particular topic to signal a country’s adoption of good practices and areas where improvement is needed (table 1.1). Colombia, Denmark, Greece, Poland and Spain score above average in all topics measured (dark green or green in table 1.1).9 In general, these countries have a
higher number of smart regulations in the topics covered. Although they share a substantial number of good practices, they also have room for improvement.
Colombia displays strong and efficient fertilizer registration norms, laws that support financial inclusion and ade-quate market regulation, but still has low safety standards for machinery. Poland has the top score for regulations related to cross-border transport, seed devel-opment and certification and fertilizer quality control, but lacks certain regu-lations for warehouse receipts, which would complement the existing collater-al regime to obtain a loan for agriculture production.
Burkina Faso, Burundi, Ghana, Myanmar and Niger score below average on all topics (red or dark red in table 1.1), which suggests there is room for improvement in adopting the identified good practic-es across several topics (box 1.1). But in most countries the performance is more mixed — there are a number of good reg-ulatory practices and at the same time areas for improvement. Bosnia and Her-zegovina has solid regulations for plant protection and fertilizer but lacks regu-lations for credit unions and e-money. Morocco and Mozambique have weak regulations in agricultural finance but strong regulations for the registration, certification and development of new seed varieties. Vietnam has strong reg-ulations for fertilizer quality control and plant protection, but lags in requirements for tractor dealers and safety standards for machinery.
How do regions perform?
The regulatory quality and efficiency of OECD high-income countries stand out in all topics as measured by EBA, fol-lowed by Latin America and the Carib-bean and Europe and Central Asia (fig-ure 1.1). South Asia and Sub- Saharan Africa show levels of regulatory strength that are lower or equal to the EBA glob-al average across glob-all measured areas. The two countries in the EBA sample from the Middle East and North Africa region — Jordan and Morocco — combine fairly strong regulations on seed and
1. OVERVIEW
TABLE 1.1 Colombia, Denmark, Greece, Poland and Spain score above average in all EBA topics
COUNTRY SEED FERTILIZER MACHINERY FINANCE MARKETS TRANSPORT
BANGLADESH BOLIVIA BOSNIA AND HERZEGOVINA BURKINA FASO BURUNDI CAMBODIA CHILE N/A COLOMBIA CÔTE D’IVOIRE DENMARK N/A ETHIOPIA GEORGIA GHANA GREECE N/A GUATEMALA JORDAN KENYA KYRGYZ REPUBLIC LAO PDR MALI MOROCCO MOZAMBIQUE MYANMAR NEPAL NICARAGUA NIGER PHILIPPINES POLAND N/A
RUSSIAN FEDERATION N/A
RWANDA SPAIN N/A SRI LANKA SUDAN TAJIKISTAN TANZANIA TURKEY UGANDA UKRAINE VIETNAM ZAMBIA
Top performing countries, defined as those with topic scores above 85, indicating a high number of good practices in place as measured by EBA. Countries with a score above the sample average in a particular topic.
Countries with a score below the sample average in a particular topic. Countries with topic scores below 30, indicating a low number of good practices.
High-income countries—Chile, Denmark, Greece, Poland, Russian Federation and Spain— are not measured under EBA finance indicators (see Topic Data Notes in appendix B).
Seed
✓ Variety release committee with representation of the private sector, which meets shortly after each cropping season.
✓ The availability online of an official variety catalog updated after each cropping season and specifying agro-ecological zones.
✓ Availability of initial seed classes to the private sector, which is granted access to breeder and foundation seed, and to material stored in the national gene bank.
✓ In countries where the certification is compulsory, official fee schedules for certification activities are publicly available, and nongovernmental inspectors and/or laboratories can be accredited to carry out part or all of seed certification activities.
Fertilizer
✓ Efficient and affordable fertilizer registration for companies, without the need for re-registration.
✓ Timely availability of fertilizer by the private sector through streamlined import procedures.
✓ Good quality fertilizer by requiring appropriate labeling and prohibiting open fertilizer bags.
Machinery
✓ Streamlined import procedures to facilitate timely availability and delivery of agricultural tractors.
✓ Appropriate testing of agricultural machinery to ensure imported tractors suit country conditions.
✓ Tractor registration and appropriate after-sales service to improve tractor durability.
✓ Compliance with national and international performance standards to ensure high-quality tractors.
✓ Enforcement of safety standards such as roll-over protective structures and seatbelts.
Finance
✓ Effective microfinance institutions by balancing supervision and the ability to take deposits.
✓ Reliable credit unions complying with disclosure and liquidity standards. ✓ Payments and other financial services
accessible digitally and through retail agents.
✓ Electronic receipts issued by warehouse operators that farmers can pledge to secure a loan.
Markets
✓ Robust phytosanitary protection framework, including national surveillance activities, pest lists, pest risk analysis and domestic and import quarantine procedures.
✓ Efficient and affordable requirements to export major agricultural products, including membership, licensing and per-shipment documentation. ✓ Laws that do not obstruct the
production or sale of agricultural goods domestically and a legal environment that facilitates the establishment and commercial operations of farmers’ organizations.
Transport
✓ Promotion of fair competition and professionalism by establishing quality criteria for access to the transport sector through efficient licensing and mandatory technical inspections. ✓ Increased competition in the domestic
market by reducing additional discriminatory requirements and granting transport rights to foreign trucking companies.
✓ Reduced market distortions by discouraging queueing systems and price interventions and promoting freight exchange platforms for road transport services.
✓ Facilitation of cross-border transport by harmonizing or mutually recognizing road transport standards among regional trading partners.
markets, with insufficient legal coverage in finance.
Variation is also observed among coun-tries within a region. In Sub- Saharan Africa, Kenya and Tanzania perform above average, driven mainly by their good regulations in place for machinery and finance, while Niger and Burundi are among the countries with fewer good practices in agribusiness regulation over-all (figure 1.2).
How do agribusiness regulations vary across levels of income and agricultural development?
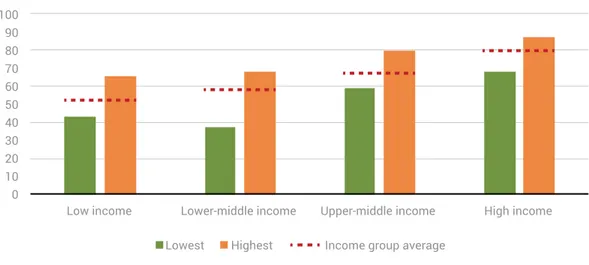
A country’s regulations are linked to its growth10 and development.11 High- income
countries have better agribusiness regu-lations across the areas measured by EBA
topics than lower-income countries (fig-ure 1.3). The correlation found between country income levels and average scores is quite strong across topics.12
The relevance of agriculture in an econo-my varies significantly across countries.
EBA uses a classification of
agricultur-al transformation that combines agri-culture’s contribution to GDP and the share of population dedicated to agricul-ture. The countries are divided in three groups: agriculture-based, transforming and urbanized.13 Urbanized countries
have on average smarter regulations for agribusiness than transforming and agriculture-based countries (figure 1.4). As more data are collected over time, measuring agribusiness regulations and reforms may shed light on the relation-ships among regulations, economic growth and agricultural transformation.
What is the relationship between efficiency and the quality of regulations?
EBA captures three key aspects of the
agribusiness sector: operations, quality control and trade (see Methodology in appendix A). Better regulation for mar-ket access contributes to firm creation, market efficiency and competition,14
with concrete evidence in the agricul-tural sector.15 Well-designed regulations
improve outcomes while enhancing agricultural productivity.16 Efficient rules
on exports and imports can improve the quantity, quality and variety of food at lower prices.17 While the importance
of these three areas has been demon-strated, it is not clear whether they come at the expense of each other — whether rules that promote easy and non discriminatory entry into the market FIGURE 1.1 Regional performance on EBA indicators
0 10 20 30 40 50 60 70 80 90 100
Fertilizer Machinery Transport
Average score on EBA topics (0—100)
East Asia & Pacific Europe & Central Asia OECD high income Latin America & Caribbean Middle East & North Africa South Asia Sub-Saharan Africa Global average
Markets Finance
Seed
N/A
Source: EBA database.
Note: The EBA sample covers countries in East Asia and the Pacific (5), Europe and Central Asia (7), Latin America and the Caribbean (4), Middle East and North
are compatible with rules that enhance safety and quality control.
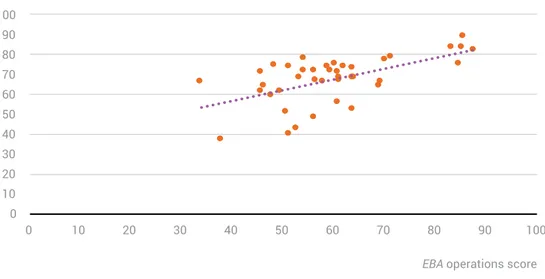
EBA data clearly show that countries
performing well on operations across topics also have strong laws for qual-ity control (figure 1.5). Good regula-tions promote quality while helping the market work efficiently; they are
complements rather than substitutes. And countries with higher scores on operations also tend to have effective and more streamlined trade require-ments (figure 1.6).
EBA also measures the efficiency of
administrative procedures, such as fer-tilizer and seed registration, with their
corresponding time and cost compo-nents. Countries with stronger regula-tions for market operaregula-tions in a particular area display different levels of efficiency in those processes. While some regions pay an efficiency cost (in actual cost or time) to put the regulations in place, others combine regulatory strength with procedural efficiency.
FIGURE 1.2 In Sub-Saharan Africa, countries show different levels of regulatory good practices
0 10 20 30 40 50 60 70 80 90 100
Kenya Tanzania Global
average Burundi Niger
Average score on EBA topics (0—100)
Source: EBA database.
FIGURE 1.3 High-income countries have regulations in place that reflect a higher regulatory quality
0 10 20 30 40 50 60 70 80 90 100
Average score on EBA topics (0—100)
Lowest Highest Income group average
Low income Lower-middle income Upper-middle income High income
Source: EBA database.
In registering new seed varieties, for example, firms in Latin America and the Caribbean pay a much higher cost than firms in the Middle East and North Africa to adhere to similar rules that guarantee an effective and safe registration process (figure 1.7). Companies in South Asia spend more time than those in East Asia and the Pacific to comply with similar requirements (in regulatory quality) to register fertilizer products (figure 1.8). Are agribusiness regulations discriminating against the private sector, foreign or small companies? Participation and investment in agricul-ture by private sector enterprises — big or small, domestic or foreign — can gener-ate such benefits as higher productivity and access to capital and markets.18 But
these benefits depend on a wide range of factors including regulatory measures to improve both the business climate and the effective competition; for low-in-come and middle-inlow-in-come countries it is essential to avoid discriminating against different types of investors.19
To measure regulatory discrimination against the private sector, EBA data cover the eligibility of private companies to import machinery, register fertilizer, pro-duce breeder or foundation seeds and be accredited in seed certification. The data also cover the possibility for foreign com-panies to import fertilizers or perform transport activities in the country. And they cover a minimum capital require-ment to start a farmers’ cooperative or a minimum number of trucks to estab-lish a trucking company, which could impede small players in the market (see
Alternative ways of presenting the data in
appendix C).
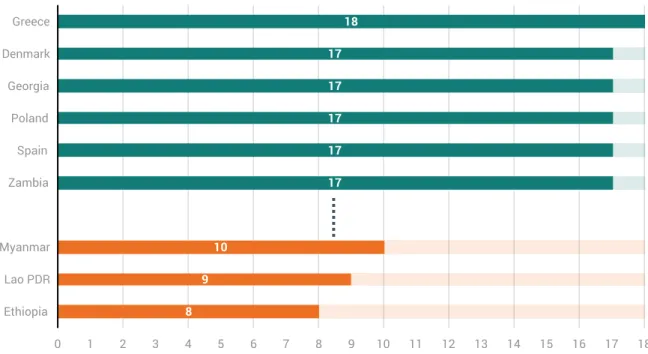
In general, countries perform well in terms of nondiscrimination, with an aver-age of 14 of 18 good practices embed-ded in the countries’ relevant laws and regulations. Greece, Denmark, Georgia, Poland, Spain and Zambia have the high-est number of nondiscriminatory regula-tions in place while Ethiopia, the Lao Peo-ple’s Democratic Republic and Myanmar have the fewest (figure 1.9). More than 95% of countries allow the private sec-tor to import tracsec-tors and fertilizers, but only a third allow them to carry out the seed certification process. While 38 countries allow foreign companies to transport goods into their country from outside, only 4 allow them to transport goods between two locations within the country.
FIGURE 1.4 Urbanized countries have a better EBA performance than transforming and agriculture-based countries
0 10 20 30 40 50 60 70 80 90 100
Urbanized Transforming Agriculture -based Average score on EBA topics (0—100)
Lowest Highest Group average
Source: EBA database.
Note: EBA countries are divided into three groups. Urbanized countries have a contribution of agriculture to GDP below 25% and a share of active population in
agriculture below 25%: Bosnia and Herzegovina, Chile, Colombia, Denmark, Georgia, Greece, Jordan, Kyrgyz Republic, Morocco, Nicaragua, Poland, Russian Fed-eration, Spain and Ukraine. Transforming countries have a contribution of agriculture to GDP below 25% and a share of active population in agriculture over 25%: Bangladesh, Bolivia, Côte d’Ivoire, Ghana, Guatemala, Lao PDR, Sri Lanka, the Philippines, Tajikistan, Turkey, Vietnam and Zambia. Agriculture-based countries have a contribution of agriculture to GDP over 25% and a share of active population in agriculture over 50%: Burkina Faso, Burundi, Cambodia, Ethiopia, Kenya, Mali, Mozambique, Myanmar, Nepal, Niger, Rwanda, Sudan, Tanzania and Uganda.
FIGURE 1.5 Countries with smarter regulations on market operations also promote quality control 0 10 20 30 40 50 60 70 80 90 100 0 10 20 30 40 50 60 70 80 90 100
EBA operations score EBA quality control score
Source: EBA database.
Note: The figure compares the operations score with the quality control score. The correlation between the two scores is 0.70. The correlation is significant at 1%
after controlling for income per capita. The operations score is an average of the scores of indicators classified in the operations category. The quality control score is an average of the scores of indicators classified under the quality control category.
FIGURE 1.6 Better rules on market operations are associated with more efficient trade requirements
0 10 20 30 40 50 60 70 80 90 100 0 10 20 30 40 50 60 70 80 90 100
EBA operations score EBA trade score
Source: EBA database.
Note: The figure compares the operations score with the trade score. The correlation between the two scores is 0.59. The correlation is significant at 1% after
FIGURE 1.7 Regions with similar rules show different costs for registering a new seed variety
East Asia & Pacific Europe & Central Asia
OECD high income Latin America &
Caribbean
Middle East & North Africa
South Asia Sub-Saharan Africa 0 0.5 1.0 1.5 2.0 2.5 3.0 30 40 50 60 70 80
Seed registration score Cost to register a new
seed variety (% income per capita)
Source: EBA database.
FIGURE 1.8 Regions with similar rules have different time durations in fertilizer registration
Time to register a new fertilizer product
(calendar days)
Fertilizer registration score Europe & Central Asia
OECD high income Latin America & Caribbean
South Asia Sub-Saharan Africa 0 100 200 300 400 500 600 700 800 900 0 10 20 30 40 50 60 70 80 90 100
East Asia & Pacific Middle East & North Africa
Is regulatory information accessible for agribusiness?
Access to information about agribusi-ness regulations and requirements is also important. Across topics, EBA data mea-sure whether governments make regula-tory information available to the public, such as the specific licensing require-ments, the official fee schedule of various
regulatory processes and the catalogs of registered seed varieties or fertilizer products. Also taken into consideration is whether the information and services are accessible online or electronically (see Alternative ways of presenting the
data in appendix C).
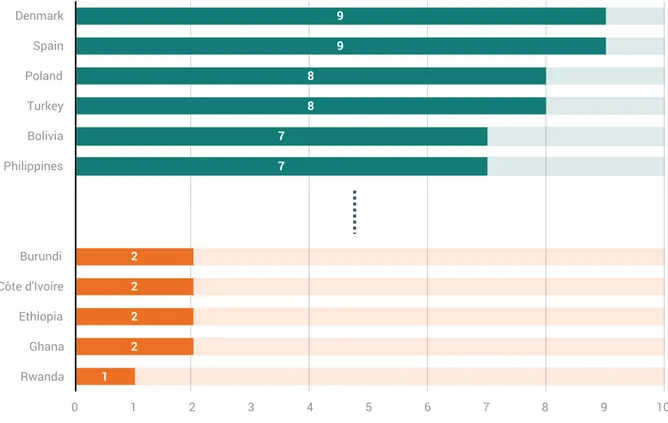
Denmark and Spain comply with 9 of the possible 10 good practices.
Rwanda (with only one) and Burundi, Côte d’Ivoire, Ethiopia and Ghana (with two) can still improve to make regula-tory information more accessible for participants in the agribusiness value chain (figure 1.10). While 75% of the countries have official catalogs listing new seed varieties or fertilizer prod-ucts, fewer than half make them avail-able online.
FIGURE 1.9 Agribusiness rules in Greece are the least discriminatory, while Ethiopia, Lao PDR and Myanmar have potential to improve 8 9 10 17 17 17 17 17 18 0 1 2 3 4 5 6 7 8 9 10 11 12 13 14 15 16 17 18 Ethiopia Lao PDR Myanmar Zambia Spain Poland Georgia Denmark Greece
Number of good practices related to nondiscrimination
Notes
1. Clark 2014; Van Stel and others 2007.
2. Gisselquist and Van Der Meer 2001.
3. Gisselquist and Grether 2000. 4. Lio and Liu 2008.
5. Freeman and Kaguongo 2003. 6. Spielman and others 2011. 7. Langyintuo and others 2010. 8. Literature on the association
between quality of regulation and the productivity of considered
agricultural inputs includes Lio and Liu (2008) and Kraay and others (2010), using governance indicators produced by Kaufmann and others (2006) in 199 countries.
9. High-income countries — Chile, Denmark, Greece, Poland, Rus-sian Federation and Spain — are not measured under the EBA finance indicators.
10. Divanbeigi and Ramalho 2015; Eif-fert 2009.
11. Acemoglu and others 2005; Aghion and Burlauf 2009.
12. The correlation between income per capita and the average of EBA scores in the 6 topics is 0.59.
13. See note in figure 1.4.
14. Ciccone and Papaioannou 2007; Klapper and others 2006; Sarria- Allende and Fisma 2004.
15. See papers cited in endnote 2–6 for examples.
16. See endnote 8. 17. Moïsé and others 2013. 18. FAO 2014.
19. Global Harvest Initiative 2011; FAO 2012.
FIGURE 1.10 Specific information on requirements for agribusiness are most accessible in Denmark and Spain and least accessible in Rwanda
1 2 2 2 2 7 7 8 8 9 9 0 1 2 3 4 5 6 7 8 9 10 Rwanda Ghana Ethiopia Côte d'Ivoire Burundi Philippines Bolivia Turkey Poland Spain Denmark
Number of good practices related to access to information