Geliş: 09.05.2020 / Kabul: 01.10.2020 DOI: 10.29029/busbed.731986
Elma SATROVIC
1Adnan MUSLIJA
2MODELLING CAUSAL RELATIONSHIPS
AMONG TOURISM, ENERGY, CO2 EMISSIONS
AND ECONOMIC GROWTH
MODELLING CAUSAL RELATIONSHIPS AMONG
TOURISM, ENERGY, CO2 EMISSIONS AND
ECONOMIC GROWTH
Elma SATROVIC
1Adnan MUSLIJA
2---
Geliş: 09.05.2020 / Kabul: 01.10.2020
DOI: 10.29029/busbed.731986
Abstract
This study investigates causal relationships among tourism, energy consumption, economic growth, and CO2 emissions for the 10 highest ranked countries in terms of tourist arrivals in the world for the period 1995-2014 using the panel VAR model. Our findings suggest a bidirectional causal link between tourism and pollutant emission as well as between energy and pollutant emission while the results show a unidirectional causality flowing from economic growth to carbon dioxide emission. The impulse response analysis also shows that the responses of carbon dioxide emissions to shocks in economic growth and energy consumption appear positive within ten years period while the response to shocks in tourism appear negative within the first four years but revert to the equilibirium in the fifth year providing some important insights for policy makers supporting sustainable tourism.
Keywords: CO2 emission, Energy consumption, Panel VAR, Tourism. TURİZM, ENERJİ TÜKETİMİ, CO2 EMİSYONLARI VE EKONOMİK
BÜYÜME ARASINDAKİ NEDENSELLİK İLİŞKİLERİNİN MODELLENMESİ
Özet
Bu çalışma, panel VAR modelini kullanarak, 1995-2014 döneminde turist girişleri açısından dünyanın en yüksek sıralamasına sahip 10 ülke için turizm, enerji tüketimi, ekonomik büyüme ve CO2 emisyonları arasındaki nedensel 1 Associate professor, University of Novi Pazar, Serbia, [email protected], ORCID:
https://orcid.org/0000-0002-8000-5543.
2 PhD, Independent Researcher, Bosnia and Herzegovina, [email protected], ORCID:
ilişkileri araştırmaktadır. Bulgular, turizm ile kirletici yayım arasında olduğu kadar enerji ile kirletici yayım arasında çift yönlü bir nedensel bağlantı olduğunu öne sürerken, sonuçlar ekonomik büyümeden karbondioksit emisyonuna doğru tek yönlü bir nedensellik olduğunu göstermektedir. Aynı zamanda etki-tepki analizi, karbondioksit emisyonlarının ekonomik büyüme ve enerji tüketimindeki sarsıntılara verdiği tepkilerinin on yıllık dönemde pozitif göründüğünü, turizmdeki sarsıntılara tepkinin ise ilk dört yıl içinde olumsuz göründüğünü, ancak beşinci yılda dengeye döndüğünü göstermektedir. Bu sonuç sürdürülebilir turizmi destekleyen politika yapıcılar için büyük önem taşıyabilir.
Anahtar Kelimeler: CO2, Enerji tüketimi, Panel VAR, Turizm.
Introduction
Tourism industry is considered to be one of the largest and the fastest growing industries in the world. Tiwari et al. (2013) address the fact that tourism attracts the accumulation of the capital and opens the new investment opportunities. In addition, this industry creates many positive externalities such as decreasing unemployment, increasing income and enhancing the balance of payment (Romero and Molina, 2013). Data on tourism industry show that 2017 was a record year in terms of number of arrivals (UNWTO, 2017). This report also suggests an increase of 7% in the number of arrivals compared to the year 2016. This industry is also recognized as an important generator of employment opportunities around the globe (Akkinapalli, 2018; Satrovic and Muslija, 2017). Due its rapid growth, tourism has become one of the essential sources of income for many nations since it accumulates GDP and has outstanding role in economic, educational, social, cultural and international relations. By creating jobs and reducing poverty, tourism sector has a key role in boosting economic growth; boosting foreign investment and improving infrastructure. In that means, tourism is an important sector in boosting standard of living and improving economic conditions of destinations.
Despite the fact that tourism industry creates many positive externalities, this industry contributes the degradation of environment by increasing pollutant emission (Isik et al, 2018). This is since tourism industry is dependent on the energy produced from the traditional sources such as fossil fuels (Scott et al., 2010). To be more specific, Lenzen et al. (2018) suggest that the tourism industry accounts for about 8% of the total greenhouse gas (GHG) emission in the world. These authors also show that the carbon footprint on the global level
has increased four times more than estimated. Pollutant emissions from tourism industry in general rise due to transport, food consumption or even shopping. Very concerning is the fact that more developed countries are the leaders in GHG emission (Ahmad et al., 2019). In addition pollutant emission from tourism industry is expected to show a positive trend in the future since this industry increases exponentially and is known as high carbon-intensive. Thus, the tourism industry influences destination countries in economic way since it boosts economic growth but from the environmental point of view it drives environmental pollution. The causal relationship between GHG emission and tourism is also accepted by Djerba Declaration on Tourism and Climate Change 2003 recognizing pollutant emission as an important determinant of tourism demand. In this regard, sustainable tourism has a particular aim to establish a balance between economic and environmental points of view that will improve living standards and protect the environment for the destination countries. Similarly, there are pioneers in literature declaring the sustainable relationship between environmental protection and tourism (Pigram, 1980; Lukashina et al., 1996 among others). Taking a look around the international scene, we have to mention the idea of soft tourism first introduced in 1984 in the Chur Declaration of the Commission Internationale pour la Protection des Regions Alpines. According to this idea, tourism needs to balance between the local population and their guests, protect cultural identity and the environment as best as possible. Soft tourism brings forward the necessity to introduce energy efficiency in tourism with a higher priority to involve tourism enterprises in the principles of sustainable tourism development.
On the other hand, exponential increase in tourism sector is not only the important generator of the economic growth but also increases the consumption of energy. Tourism industry is highly reliant on energy within various services such as transport, food, shopping, accommodation etc. Energy consumption is recognized as the main association between tourism industry and environmental quality since energy use is an important producer of GHG. Thus, the development of tourism industry is likely to lead to the climate changes and environmental degradation due to the strong dependence on fossil fuels energy sources (Katircioglu, 2014). This aspect of tourism sector is considered one of the major energy gluttons of the economy by the World Summit on Sustainable Development 2002. Therefore, the tourism industry has attracted interest as the main contributor to deterioration of the environment. In this respect, policy makers as well as practitioners can have immense benefits from the empirical study on the relationship between tourism, energy consumption, economic
growth and CO2 emissions. This is even more since the tourism is recognized as one of the top energy gluttons (Nepal, 2008).
Many studies to date explore the link between economic growth, CO2 emissions and energy consumption. Yet, this evidence is in general mixed and is hardly comparable since some of the studies explore the relationship, if any, between the consumption of energy and the growth of real income (Tang and Abosedra, 2014; Apergis and Tang, 2013; Satrovic, 2019) while the others aim to test the validity of environmental Kuznets curve hypothesis (Gamage et al. 2017). However, only a few studies focus on the relationship between tourism, economic growth and energy consumption while analyzing its impact on environmental degradation what motivated us towards this empirical research.
Table 1. The Top 10 Most Visited Countries
France (1) Spain (3) Italy (5) Germany (7) Russia (9) United States (2) China (4) Turkey (6) United Kingdom (8) Mexico (10)
Source: World Bank, World Development Indicators
Addressing the fact that high-income countries are the main touristic destinations and the leaders in GHG emission, this research particularly focuses on the top 10 most visited countries. An additional reason to choose these countries is the fact that environmental degradation due to tourism industry as a result of energy consumption is smaller in less developed compared to developed countries (Isik et al. 2017). Especially, the tourism industry has grown exponentially in the countries listed in the Table 1. According to the tourist arrivals, these are the top 10 most visited countries in the last observed year in this paper (2014).
The top 10 most visited countries are selected using the number of tourist arrivals. Hence, the most visited country in the year 2014 was France. Last ranked country is Mexico. These countries host the 43% of the total tourists in the world. In terms of tourism receipts, the share of these countries in the total world’s tourism receipts is amounted to 45% in the year 2014. These countries are also one of the biggest energy consumers in the world taking into account the electric power consumption (kWh per capita). Moreover, these countries are significant producers of CO2 approximated using CO2 emissions (metric tons per capita). In short the sample countries in our study are important touristic destinations but also the main contributors to the environmental degradation.
With this background, the purpose of present study is to explore the relationship between tourism, energy consumption, economic growth and CO2 emissions in the 10 highest ranked countries in terms of tourist arrivals in the world. The contribution of this can be summarized as following. First, to the extent of our knowledge this is the first work to analyze the dynamic of energy and tourism consumption in 10 highest ranked countries in terms of tourist arrivals by employing the panel VAR. Apart from the most of the studies to date, this study explores the relationship of interest in macroeconomic environment. Lastly, it takes into account the latest available data. Thus, it can offer important insights to policy makers supporting sustainable tourism as well as to other researchers in the field. In the rest of the paper we summarize the literature on the matter, present data, variables and methodology. Furthermore, we present results of the research; discuss and close the paper by giving concluding remarks.
1. Literature Review
The relationship between tourism and economic growth has received a great attention among research community to date. Hence, the first part of this section will summarize the empirical evidence on this relationship. For instance, Kum et al. (2015) have investigated the relationship, if any, between economic growth and international tourism for the sample of eleven countries. The empirical evidence suggests a positive long-term impact of tourism sector on GDP. Moreover, the authors provide the evidence on tourism growth hypothesis. This idea is also supported by Antonakakis et al. (2013) reporting a unidirectional causal relationship running form the growth of economy to development of tourism sector and indicating that growth tends to support tourism through political stability and the better allocation of the resources.
Romero and Molina (2013) have given a detailed literature review on the link between growth of economy and the development of tourism sector. The authors suggest that this relationship is heavily determined by many factors. The specialization in tourism is found to be one of the most important factors. In addition, the selection of econometric techniques as well as the specification of the models is found to be an important factor while interpreting and comparing the empirical results. These papers have focused on tourism-led growth hypothesis. For instance, Dritsakis (2012) have explored this hypothesis using panel data for the sample of Mediterranean countries. The empirical evidence suggests that the development of tourism significantly impacts the growth of the economy in Mediterranean countries of interest. However, these results differ
from the Khalil et al. (2007) who use time-series data for Pakistan economy. These authors suggest a bidirecational causal relationship between tourism sector and economic growth.
Nissan et al. (2011) aimed to determine whether or not the tourism sector contributes to the economic growth. The results of this paper suggest that the revenue from tourism sector is of great importance to finance the real sector activities. In addition, this sector increases the employment, productivity and consequently leads to the economic growth. Savas et al. (2010) aimed to explore whether tourism sector contributes to the economic growth in the case of Turkey. The results show a long-term causal relationship between tourism sector and economic growth but only unidirectional. Hence, tourism-led growth hypothesis is supported in the case of Turkey. The empirical evidence supporting tourism-led growth hypothesis is also given by Gunduz and Hatemi-J (2005) while analyzing the situation in Turkey.
However, Ongan and Demiroz (2005) indicate a positive impact of tourism on the growth of economy but also support the idea that economic growth strongly influences tourism in Turkey. However, Du et al. (2014) have explored tourism-led growth hypothesis for the sample of 109 countries. The empirical evidence suggests that tourism is not found to be sufficient for economic growth. It is considered to be just as a part of a development strategy that is much broader. The overall conclusion states that even though most of the papers suggest a positive impact of tourism on economic growth in the long-run, there is a need to enlarge the literature on tourism-led growth hypothesis by exploring the underlying economic instruments.
Other important factors in the tourism–growth nexus are pollutant emissions and energy consumption. This is due to the fact that tourism sector consumes a vast amount of energy that is in general produced from fossil fuels. Tiwari et al. (2013) therefore suggest the necessity to explore the link between tourism, energy consumption and growth of the economy since our lifestyles are strongly affected by the climate change and environmental issues. Tiwari et al. (2013) have explored the aforementioned relationship using the case of OECD countries in the period 1995-2005. They have employed the panel VAR model. The authors have estimated bivariate and trivariate model. The results suggest the sensitivity of the results to the change in proxy variable of tourism sector. Trivariate model reports that the response of tourism to the shock in climate change is marginally positive as well as to the change in energy consumption. Tourism sector is also recognized as one of the largest energy consumers.
Katircioglu et al. (2014) have investigated the link in long-run, if any, between tourism, climate change approximated using CO2 emissions and energy in the case of Cyprus. The findings of this paper suggest a long-term link between the variables of interest. The authors also suggest that tourism sector is a catalyst for the consumption of energy as well as for CO2 emissions. The authors also suggest that the relationship between tourism sector, climate change and energy consumption has not received much attention among research community to date.
Pu and Mi (2016) suggest that transportation is one of the greatest consumers of energy in terms of tourism industry. In addition, it is considered to be a leader in terms of GHG emission. The authors suggest that tourism is misunderstood as an industry that does not cause environmental degradation. In the city of interest in this paper, Haikou, tourism is recognized as a major energy consumer. Hence, the authors suggest the foundation of environmental recovery fund. Xiao et al. (2012) records an exponential growth of tourism industry in China in the last 30 years. As a negative externality, CO2 emissions have also increased significantly which brought up a concern among the supporters of sustainable tourism. Tang et al. (2015) also give supportive evidence to these concerns. The authors highlight the fact that transport in tourism is found to be a major source of GHG emissions. Hence, they have investigated the change in GHG emission in Heilongjiang Province in the period between 1978 and 2012. The results suggest that CO2 emissions have risen in the period of interest at a rate of 9.47% annually on average. The biggest contributor is the highway transport while the second one is airways. An exponential increase in CO2 emissions in tourism industry in China is also suggested by Wei et al. (2012).
Tsai et al. (2018) show a positive example of Taiwan. The government aims to promote the sustainable tourism by reducing the GHG emission. The transport in tourism industry is one of the major sources of CO2 emissions. Hence, there is a need to introduce a more environmental friendly public transportation. Surprisingly, accommodation is found to be the leader in CO2 emissions. For this purpose, the authors suggest to improve the energy efficiency especially in hotels. Hence, the overall conclusion of this paper is that tourism becomes less sustainable at the global level which brought up a concern among policy makers. This is also suggested by Buckley (2012).
Dogan and Aslan (2017) have explored the relationship, if any, between climate changes, income, tourism sector and the consumption of energy. They have collected the data for EU member states and candidate countries. The
period of interest ranges between 1995 and 2011. The findings of this paper suggest the link in the long-run between analyzed variables. Tourism is found to mitigate GHG emissions. Moreover, the authors suggest that tourism causes GHG emissions (unidirectional link). Lee and Brahmasrene (2013) have explored the relationship if any between tourism sector, GHG emissions and economic growth. They have collected the data for EU member states in the period 1988-2009. The outcomes suggest a long-run relationship between analyzed variables. The analysis of tourism-energy-growth-CO2 emissions nexus has been conducted for seven tourism-dependent countries by Adedoyin and Bekun (2020). Granger causality tests suggest a unidirectional causality flowing from tourism to pollutant emission, economic growth and energy consumption. This paper clearly indicates that tourism development can be predicted by economic growth, energy consumption and GHG emission but it is not the other way around in tourism dependent countries.
Another study by Liu et al. (2019) investigated the dynamics in tourism-energy consumption-growth-carbon dioxide emissions nexus. This study has been conducted for the case of Pakistan for the period 1980-2016. The outcome of this paper shows no significant impact of tourism on carbon dioxide emissions while economic growth and energy consumption are among the most important determinants of pollutant emission. Moreover, a unidirectional causality flowing from economic growth and energy consumption towards pollutant emission is shown whereas there is no evidence on tourism-pollutant emission nexus. For related studies in other countries, Zhang and Zhang (2020) investigated the causal linkages among tourism, growth, pollutant emissions and energy consumption in the case of China. Results from causality tests confirm a bidirectional causal linkage between economic growth and tourism in the short-run. Bidirectional causality is also reported between economic growth and pollutant emission, tourism and pollutant emission as well as between economic growth and tourism. Also, Shakouri et al. (2017) investigated the nexus of interest for the selected Asia-Pacific countries. Performing the long-run relationships, the findings of this study suggest a significant positive impact of tourism on pollutant emission in the long-run while the Granger causality test shows unidirectional causality flowing from energy consumption to tourism as well as from pollutant emission to tourism in the sample countries.
Concurring to the above, Aslan et al. (2020) found bidirectional causality between economic growth and tourism, economic growth and energy consumption as well as between economic growth and pollutant emission. Using data of selected Mediterranean countries, the study supports the tourism-led
growth hypothesis in low growth levels. Moreover, sustainable growth is reported at low growth levels. The overall conclusion of this part is that tourism industry plays an important role in contributing to economic growth. However, tourism sector is one of the greatest energy consumers and contributes to environmental depletion. Hence, the question of environmental issues brings up many concerns nowadays (Tovar and Lockwood, 2008). Thus, the current study is an attempt to unveil the linkage amid the observed variables in the case of top 10 touristic destinations.
2. Data, Variables and Methodology
Our study explores the impact of tourism industry, energy consumption and economic growth on pollutant emission. The model used in current study is based on modified Cobb-Douglas production function and derived from Ali et al. (2017). Panel data formalization can be shown as (Equation 1):
𝑌𝑌#$ = 𝐹𝐹(𝐾𝐾#$, 𝐴𝐴𝐴𝐴#$) (1) where 𝑌𝑌#$ represents economic growth, 𝐾𝐾#$ denotes capital while 𝐴𝐴𝐴𝐴#$ represents labor. Many everyday activities produce significant amounts of GHG; therefore this study introduces additional variables such as tourism industry, energy consumption and economic growth. The current theoretical setting of the model is based on the previous work of Adedoyin and Bekun (2020) and Shakouri et al. (2017). Our study differs from Isik and Radulescu (2017) which focused on investigating causal linkage amid tourist arrivals, renewable energy and other variables. This study also differs from Aslan et al. (2020), by focusing on the links between pollutant emission and tourism industry for the top ten destinations instead of Mediterranean countries.
This study uses annual panel data for the period 1995-2014 and the sample variables are CO2 emissions (metric tons per capita) standing for pollutant emission and denoted by CO2, TR – international tourism receipts, ENU - energy use (kg of oil equivalent per capita) standing for energy consumption and GDP - GDP per capita (constant 2010 US$). The data for the top 10 destinations were obtained from the World Bank (World Development Indicators).
After pre-estimation diagnostics (inspection for stationarity properties and correlation analysis), this study opted for panel VAR (PVAR) and fully modified ordinary least square (FMOLS). Vector autoregression (VAR) models are proposed as an alternative to multivariate SEM (Sims, 1980). One of the most important features of the VAR model is that all of the variables are
period of interest ranges between 1995 and 2011. The findings of this paper suggest the link in the long-run between analyzed variables. Tourism is found to mitigate GHG emissions. Moreover, the authors suggest that tourism causes GHG emissions (unidirectional link). Lee and Brahmasrene (2013) have explored the relationship if any between tourism sector, GHG emissions and economic growth. They have collected the data for EU member states in the period 1988-2009. The outcomes suggest a long-run relationship between analyzed variables. The analysis of tourism-energy-growth-CO2 emissions nexus has been conducted for seven tourism-dependent countries by Adedoyin and Bekun (2020). Granger causality tests suggest a unidirectional causality flowing from tourism to pollutant emission, economic growth and energy consumption. This paper clearly indicates that tourism development can be predicted by economic growth, energy consumption and GHG emission but it is not the other way around in tourism dependent countries.
Another study by Liu et al. (2019) investigated the dynamics in tourism-energy consumption-growth-carbon dioxide emissions nexus. This study has been conducted for the case of Pakistan for the period 1980-2016. The outcome of this paper shows no significant impact of tourism on carbon dioxide emissions while economic growth and energy consumption are among the most important determinants of pollutant emission. Moreover, a unidirectional causality flowing from economic growth and energy consumption towards pollutant emission is shown whereas there is no evidence on tourism-pollutant emission nexus. For related studies in other countries, Zhang and Zhang (2020) investigated the causal linkages among tourism, growth, pollutant emissions and energy consumption in the case of China. Results from causality tests confirm a bidirectional causal linkage between economic growth and tourism in the short-run. Bidirectional causality is also reported between economic growth and pollutant emission, tourism and pollutant emission as well as between economic growth and tourism. Also, Shakouri et al. (2017) investigated the nexus of interest for the selected Asia-Pacific countries. Performing the long-run relationships, the findings of this study suggest a significant positive impact of tourism on pollutant emission in the long-run while the Granger causality test shows unidirectional causality flowing from energy consumption to tourism as well as from pollutant emission to tourism in the sample countries.
Concurring to the above, Aslan et al. (2020) found bidirectional causality between economic growth and tourism, economic growth and energy consumption as well as between economic growth and pollutant emission. Using data of selected Mediterranean countries, the study supports the tourism-led
growth hypothesis in low growth levels. Moreover, sustainable growth is reported at low growth levels. The overall conclusion of this part is that tourism industry plays an important role in contributing to economic growth. However, tourism sector is one of the greatest energy consumers and contributes to environmental depletion. Hence, the question of environmental issues brings up many concerns nowadays (Tovar and Lockwood, 2008). Thus, the current study is an attempt to unveil the linkage amid the observed variables in the case of top 10 touristic destinations.
2. Data, Variables and Methodology
Our study explores the impact of tourism industry, energy consumption and economic growth on pollutant emission. The model used in current study is based on modified Cobb-Douglas production function and derived from Ali et al. (2017). Panel data formalization can be shown as (Equation 1):
𝑌𝑌#$= 𝐹𝐹(𝐾𝐾#$, 𝐴𝐴𝐴𝐴#$) (1) where 𝑌𝑌#$ represents economic growth, 𝐾𝐾#$ denotes capital while 𝐴𝐴𝐴𝐴#$ represents labor. Many everyday activities produce significant amounts of GHG; therefore this study introduces additional variables such as tourism industry, energy consumption and economic growth. The current theoretical setting of the model is based on the previous work of Adedoyin and Bekun (2020) and Shakouri et al. (2017). Our study differs from Isik and Radulescu (2017) which focused on investigating causal linkage amid tourist arrivals, renewable energy and other variables. This study also differs from Aslan et al. (2020), by focusing on the links between pollutant emission and tourism industry for the top ten destinations instead of Mediterranean countries.
This study uses annual panel data for the period 1995-2014 and the sample variables are CO2 emissions (metric tons per capita) standing for pollutant emission and denoted by CO2, TR – international tourism receipts, ENU - energy use (kg of oil equivalent per capita) standing for energy consumption and GDP - GDP per capita (constant 2010 US$). The data for the top 10 destinations were obtained from the World Bank (World Development Indicators).
After pre-estimation diagnostics (inspection for stationarity properties and correlation analysis), this study opted for panel VAR (PVAR) and fully modified ordinary least square (FMOLS). Vector autoregression (VAR) models are proposed as an alternative to multivariate SEM (Sims, 1980). One of the most important features of the VAR model is that all of the variables are
considered to be endogenous. However, the exogenous shocks may be disentangled by the common statistical procedures. One of the pioneers of PVAR application is previous work of Love and Zicchino (2006). Hence, the methodological part of the present research follows Love and Zicchino (2006) and Tiwari et al. (2013). The panel VAR is actually the combination of time-series VAR with the panel settings. The detailed explanation of PVAR model as well as the estimation procedure is given in follows Love and Zicchino (2006). The variables of the current study are interrelated in the following way:
𝑌𝑌#$= 𝜔𝜔#+ 𝐴𝐴(𝐿𝐿)𝑌𝑌#$+ 𝜎𝜎#+ 𝜋𝜋$+ 𝜖𝜖#$ (2) where 𝑖𝑖 and 𝑡𝑡 stand for individual (destination) and time respectively; 𝑌𝑌#$ subscript represents the vector of pollutant emission, tourism, energy consumption and real GDP per capita; 𝜔𝜔# denotes fixed-effect matrix; 𝜎𝜎# and 𝜋𝜋$ are individual and time effects respectively; 𝜖𝜖#$ are residuals. PVAR model that shows the interrelation of the factors in current study can be formalized as: ∆𝐿𝐿(𝐶𝐶𝐶𝐶2#$) = 𝜔𝜔9#+ : 𝑓𝑓9<∆𝐿𝐿 = <>9 ?𝐶𝐶𝐶𝐶2#$@<A + : 𝑔𝑔9< = <>9 ∆𝐿𝐿?𝐸𝐸𝐸𝐸𝐸𝐸#$@<A + : ℎ9< = <>9 ∆𝐿𝐿?𝑇𝑇𝑇𝑇#$@<A + : 𝑘𝑘9< = <>9 ∆𝐿𝐿?𝐺𝐺𝐺𝐺𝐺𝐺#$@<A + 𝜎𝜎9#+ 𝜋𝜋9$+ 𝜖𝜖9#$ (3) ∆𝐿𝐿(𝐸𝐸𝐸𝐸𝐸𝐸#$) =𝜔𝜔N#+ : 𝑓𝑓N<∆𝐿𝐿 = <>9 ?𝐶𝐶𝐶𝐶2#$@<A + : 𝑔𝑔N< = <>9 ∆𝐿𝐿?𝐸𝐸𝐸𝐸𝐸𝐸#$@<A + : ℎN< = <>9 ∆𝐿𝐿?𝑇𝑇𝑇𝑇#$@<A + : 𝑘𝑘N< = <>9 ∆𝐿𝐿?𝐺𝐺𝐺𝐺𝐺𝐺#$@<A +𝜎𝜎N#+𝜋𝜋N$+𝜖𝜖N#$ (4) ∆𝐿𝐿(𝑇𝑇𝑇𝑇#$) =𝜔𝜔P#+ : 𝑓𝑓P<∆𝐿𝐿 = <>9 ?𝐶𝐶𝐶𝐶2#$@<A + : 𝑔𝑔P< = <>9 ∆𝐿𝐿?𝐸𝐸𝐸𝐸𝐸𝐸#$@<A + :ℎP< = <>9 ∆𝐿𝐿?𝑇𝑇𝑇𝑇#$@<A + : 𝑘𝑘P< = <>9 ∆𝐿𝐿?𝐺𝐺𝐺𝐺𝐺𝐺#$@<A +𝜎𝜎P#+𝜋𝜋P$+𝜖𝜖P#$ (5) ∆𝐿𝐿(𝐺𝐺𝐺𝐺𝐺𝐺#$) =𝜔𝜔R#+ : 𝑓𝑓R<∆𝐿𝐿 = <>9 ?𝐶𝐶𝐶𝐶2#$@<A + : 𝑔𝑔R< = <>9 ∆𝐿𝐿?𝐸𝐸𝐸𝐸𝐸𝐸#$@<A + : ℎR< = <>9 ∆𝐿𝐿?𝑇𝑇𝑇𝑇#$@<A + : 𝑘𝑘R< = <>9 ∆𝐿𝐿?𝐺𝐺𝐺𝐺𝐺𝐺#$@<A +𝜎𝜎R#+𝜋𝜋R$+𝜖𝜖R#$. (6)
We use the natural logarithm form of the interrelated factors to corroborate more stable behavior. ∆ denotes the first difference. Since the other
three variables are denoted per capita, we have divided international tourism, receipts by the population in given year in order to make the variables comparable. After estimating the PVAR model, we have utilized the impulse response analysis to assess the effect of the shock of one variable to another. Another chief benefit of PVAR model is the ability to show the rate change in a factor disclosed by the innovation to another factor by presenting variance decomposition analysis.
3. Results and Discussions
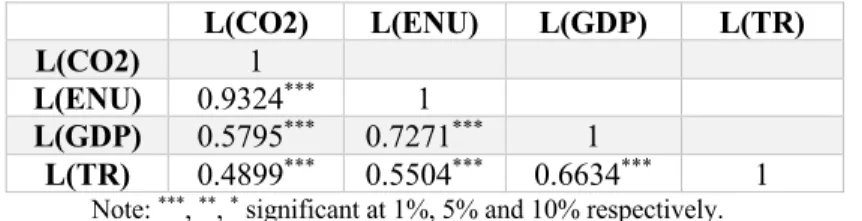
The correlation matrix (Table 2) reveals a significant positive association between pollutant emission and energy consumption as well as between pollutant emission and economic growth. The positive association is also shown for the other observed variables. Also, the study focused on Pesaran's test of cross sectional independence. As we can see, the CD test does not reject the null hypothesis of no cross-sectional dependence (0.483, Pr = 0.629). Furthermore, we carry out unit root tests to find the order of integration.
Table 2. Correlation Matrix
L(CO2) L(ENU) L(GDP) L(TR) L(CO2) 1
L(ENU) 0.9324*** 1
L(GDP) 0.5795*** 0.7271*** 1
L(TR) 0.4899*** 0.5504*** 0.6634*** 1
Note: ***, **, * significant at 1%, 5% and 10% respectively.
Source: Computed by the Authors
In terms of the level variables, Levin–Lin–Chu (LLC) t* test suggests that L(TR) panels are stationary while Im–Pesaran–Shin test (IPS) and ADF – Fisher inverse chi-square suggest that all panels contain unit roots. Hence, it can be concluded that L(TR) panels are non-stationary. All of the three tests agree that the level values of L(ENU) and L(CO2) are reported to be non-stationary. Assuming that PVAR requires series to be I(1) we test for the stationarity properties for the first difference. Table 3 shows that all variables are stationary at the first difference. This is confirmed for a 1% level of significance. We have further applied Kao cointegration tests to examine long run relationships between the variables. The findings suggest a cointegration relationship between all study variables (t-statistics= -2.42, Pr=0.008).
considered to be endogenous. However, the exogenous shocks may be disentangled by the common statistical procedures. One of the pioneers of PVAR application is previous work of Love and Zicchino (2006). Hence, the methodological part of the present research follows Love and Zicchino (2006) and Tiwari et al. (2013). The panel VAR is actually the combination of time-series VAR with the panel settings. The detailed explanation of PVAR model as well as the estimation procedure is given in follows Love and Zicchino (2006). The variables of the current study are interrelated in the following way:
𝑌𝑌#$ = 𝜔𝜔#+ 𝐴𝐴(𝐿𝐿)𝑌𝑌#$+ 𝜎𝜎#+ 𝜋𝜋$+ 𝜖𝜖#$ (2) where 𝑖𝑖 and 𝑡𝑡 stand for individual (destination) and time respectively; 𝑌𝑌#$ subscript represents the vector of pollutant emission, tourism, energy consumption and real GDP per capita; 𝜔𝜔# denotes fixed-effect matrix; 𝜎𝜎# and 𝜋𝜋$ are individual and time effects respectively; 𝜖𝜖#$ are residuals. PVAR model that shows the interrelation of the factors in current study can be formalized as: ∆𝐿𝐿(𝐶𝐶𝐶𝐶2#$) = 𝜔𝜔9#+ : 𝑓𝑓9<∆𝐿𝐿 = <>9 ?𝐶𝐶𝐶𝐶2#$@<A + : 𝑔𝑔9< = <>9 ∆𝐿𝐿?𝐸𝐸𝐸𝐸𝐸𝐸#$@<A + : ℎ9< = <>9 ∆𝐿𝐿?𝑇𝑇𝑇𝑇#$@<A + : 𝑘𝑘9< = <>9 ∆𝐿𝐿?𝐺𝐺𝐺𝐺𝐺𝐺#$@<A + 𝜎𝜎9#+ 𝜋𝜋9$+ 𝜖𝜖9#$ (3) ∆𝐿𝐿(𝐸𝐸𝐸𝐸𝐸𝐸#$) =𝜔𝜔N#+ : 𝑓𝑓N<∆𝐿𝐿 = <>9 ?𝐶𝐶𝐶𝐶2#$@<A + : 𝑔𝑔N< = <>9 ∆𝐿𝐿?𝐸𝐸𝐸𝐸𝐸𝐸#$@<A + : ℎN< = <>9 ∆𝐿𝐿?𝑇𝑇𝑇𝑇#$@<A + : 𝑘𝑘N< = <>9 ∆𝐿𝐿?𝐺𝐺𝐺𝐺𝐺𝐺#$@<A +𝜎𝜎N#+𝜋𝜋N$+𝜖𝜖N#$ (4) ∆𝐿𝐿(𝑇𝑇𝑇𝑇#$) =𝜔𝜔P#+ : 𝑓𝑓P<∆𝐿𝐿 = <>9 ?𝐶𝐶𝐶𝐶2#$@<A + : 𝑔𝑔P< = <>9 ∆𝐿𝐿?𝐸𝐸𝐸𝐸𝐸𝐸#$@<A + :ℎP< = <>9 ∆𝐿𝐿?𝑇𝑇𝑇𝑇#$@<A + : 𝑘𝑘P< = <>9 ∆𝐿𝐿?𝐺𝐺𝐺𝐺𝐺𝐺#$@<A +𝜎𝜎P#+𝜋𝜋P$+𝜖𝜖P#$ (5) ∆𝐿𝐿(𝐺𝐺𝐺𝐺𝐺𝐺#$) =𝜔𝜔R#+ : 𝑓𝑓R<∆𝐿𝐿 = <>9 ?𝐶𝐶𝐶𝐶2#$@<A + : 𝑔𝑔R< = <>9 ∆𝐿𝐿?𝐸𝐸𝐸𝐸𝐸𝐸#$@<A + : ℎR< = <>9 ∆𝐿𝐿?𝑇𝑇𝑇𝑇#$@<A + : 𝑘𝑘R< = <>9 ∆𝐿𝐿?𝐺𝐺𝐺𝐺𝐺𝐺#$@<A +𝜎𝜎R#+𝜋𝜋R$+𝜖𝜖R#$. (6)
We use the natural logarithm form of the interrelated factors to corroborate more stable behavior. ∆ denotes the first difference. Since the other
three variables are denoted per capita, we have divided international tourism, receipts by the population in given year in order to make the variables comparable. After estimating the PVAR model, we have utilized the impulse response analysis to assess the effect of the shock of one variable to another. Another chief benefit of PVAR model is the ability to show the rate change in a factor disclosed by the innovation to another factor by presenting variance decomposition analysis.
3. Results and Discussions
The correlation matrix (Table 2) reveals a significant positive association between pollutant emission and energy consumption as well as between pollutant emission and economic growth. The positive association is also shown for the other observed variables. Also, the study focused on Pesaran's test of cross sectional independence. As we can see, the CD test does not reject the null hypothesis of no cross-sectional dependence (0.483, Pr = 0.629). Furthermore, we carry out unit root tests to find the order of integration.
Table 2. Correlation Matrix
L(CO2) L(ENU) L(GDP) L(TR) L(CO2) 1
L(ENU) 0.9324*** 1
L(GDP) 0.5795*** 0.7271*** 1
L(TR) 0.4899*** 0.5504*** 0.6634*** 1
Note: ***, **, * significant at 1%, 5% and 10% respectively.
Source: Computed by the Authors
In terms of the level variables, Levin–Lin–Chu (LLC) t* test suggests that L(TR) panels are stationary while Im–Pesaran–Shin test (IPS) and ADF – Fisher inverse chi-square suggest that all panels contain unit roots. Hence, it can be concluded that L(TR) panels are non-stationary. All of the three tests agree that the level values of L(ENU) and L(CO2) are reported to be non-stationary. Assuming that PVAR requires series to be I(1) we test for the stationarity properties for the first difference. Table 3 shows that all variables are stationary at the first difference. This is confirmed for a 1% level of significance. We have further applied Kao cointegration tests to examine long run relationships between the variables. The findings suggest a cointegration relationship between all study variables (t-statistics= -2.42, Pr=0.008).
Table 3. Unit Root Analysis Included:
Constant
and Trend ΔL(TR) ΔL(ENU) ΔL(CO2) ΔL(GDP)
Test Stat. p-value Stat. p-value Stat. p-value Stat. p-value
LLC -8.87*** 0.00 11.16*** 0.00 -8.55*** 0.00 -4.46*** 0.00 IPS -7.36*** 0.00 46.19*** 0.00 -9.06*** 0.00 -3.10*** 0.00 ADF 90.52*** 0.00 119.65*** 0.00 77.54*** 0.00 44.34*** 0.00
Note: ***, **, * significant at 1%, 5% and 10% respectively.
Source: Computed by the Authors
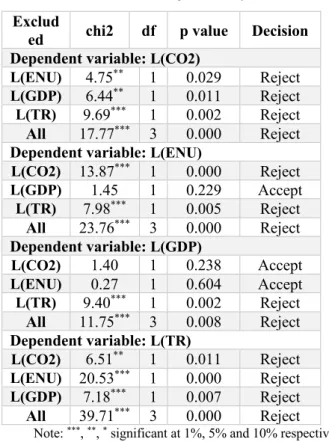
Table 4. Panel VAR-Granger Causality Wald Test
Exclud
ed chi2 df p value Decision Dependent variable: L(CO2)
L(ENU) 4.75** 1 0.029 Reject L(GDP) 6.44** 1 0.011 Reject L(TR) 9.69*** 1 0.002 Reject All 17.77*** 3 0.000 Reject Dependent variable: L(ENU)
L(CO2) 13.87*** 1 0.000 Reject L(GDP) 1.45 1 0.229 Accept L(TR) 7.98*** 1 0.005 Reject All 23.76*** 3 0.000 Reject Dependent variable: L(GDP) L(CO2) 1.40 1 0.238 Accept L(ENU) 0.27 1 0.604 Accept L(TR) 9.40*** 1 0.002 Reject All 11.75*** 3 0.008 Reject Dependent variable: L(TR) L(CO2) 6.51** 1 0.011 Reject L(ENU) 20.53*** 1 0.000 Reject L(GDP) 7.18*** 1 0.007 Reject All 39.71*** 3 0.000 Reject
Note: ***, **, * significant at 1%, 5% and 10% respectively.
Source: Computed by the Authors
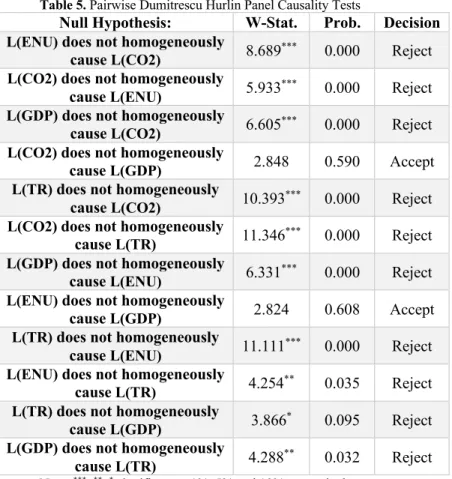
Accordingly, we proceed to the traditional panel VAR-Granger causality Wald test. To check the behavior and the sensitivity of the variables we have further conducted the pairwise Dumitrescu Hurlin panel causality tests. As shown in Table 4 and 5, there exists bidirectional causality between energy consumption and carbon dioxide emission. Both tests also report bidirectional
causality between tourism and carbon dioxide emission. A unidirectional causality is found in both test and it flows from economic growth to pollutant emission. The findings also suggest bidirectional causality between ENU and TR; TR and GDP. As opposed to Table 4 that reports no causality between GDP and ENU, Table 5 suggests a unidirectional causality flowing from GDP to ENU.
Table 5. Pairwise Dumitrescu Hurlin Panel Causality Tests
Null Hypothesis: W-Stat. Prob. Decision L(ENU) does not homogeneously
cause L(CO2) 8.689*** 0.000 Reject L(CO2) does not homogeneously
cause L(ENU) 5.933*** 0.000 Reject L(GDP) does not homogeneously
cause L(CO2) 6.605*** 0.000 Reject L(CO2) does not homogeneously
cause L(GDP) 2.848 0.590 Accept L(TR) does not homogeneously
cause L(CO2) 10.393*** 0.000 Reject L(CO2) does not homogeneously
cause L(TR) 11.346*** 0.000 Reject L(GDP) does not homogeneously
cause L(ENU) 6.331*** 0.000 Reject L(ENU) does not homogeneously
cause L(GDP) 2.824 0.608 Accept L(TR) does not homogeneously
cause L(ENU) 11.111*** 0.000 Reject L(ENU) does not homogeneously
cause L(TR) 4.254** 0.035 Reject L(TR) does not homogeneously
cause L(GDP) 3.866* 0.095 Reject L(GDP) does not homogeneously
cause L(TR) 4.288** 0.032 Reject Note: ***, **, * significant at 1%, 5% and 10% respectively.
Source: Computed by the Authors
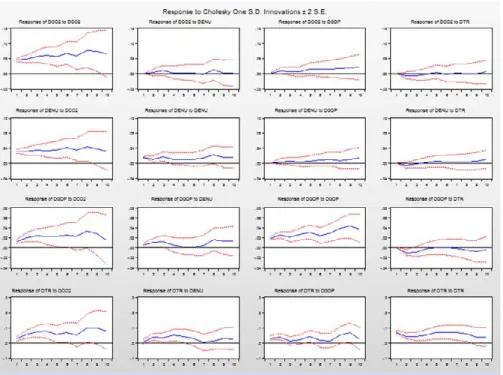
The impulse responses of one variable in light of changes in another variable are presented in Figure 1. It reveals that when the energy consumption has a positive shock, carbon dioxide emission become positive. If one standard deviation shock is given to economic growth, the reaction of pollutant emission is positive. In terms of the reaction of pollutant emission on tourism, it is first negative, reaches equilibrium after four years and is also positive later. For
Table 3. Unit Root Analysis Included:
Constant
and Trend ΔL(TR) ΔL(ENU) ΔL(CO2) ΔL(GDP)
Test Stat. p-value Stat. p-value Stat. p-value Stat. p-value
LLC -8.87*** 0.00 11.16*** 0.00 -8.55*** 0.00 -4.46*** 0.00 IPS -7.36*** 0.00 46.19*** 0.00 -9.06*** 0.00 -3.10*** 0.00 ADF 90.52*** 0.00 119.65*** 0.00 77.54*** 0.00 44.34*** 0.00
Note: ***, **, * significant at 1%, 5% and 10% respectively.
Source: Computed by the Authors
Table 4. Panel VAR-Granger Causality Wald Test
Exclud
ed chi2 df p value Decision Dependent variable: L(CO2)
L(ENU) 4.75** 1 0.029 Reject L(GDP) 6.44** 1 0.011 Reject L(TR) 9.69*** 1 0.002 Reject All 17.77*** 3 0.000 Reject Dependent variable: L(ENU)
L(CO2) 13.87*** 1 0.000 Reject L(GDP) 1.45 1 0.229 Accept L(TR) 7.98*** 1 0.005 Reject All 23.76*** 3 0.000 Reject Dependent variable: L(GDP) L(CO2) 1.40 1 0.238 Accept L(ENU) 0.27 1 0.604 Accept L(TR) 9.40*** 1 0.002 Reject All 11.75*** 3 0.008 Reject Dependent variable: L(TR) L(CO2) 6.51** 1 0.011 Reject L(ENU) 20.53*** 1 0.000 Reject L(GDP) 7.18*** 1 0.007 Reject All 39.71*** 3 0.000 Reject
Note: ***, **, * significant at 1%, 5% and 10% respectively.
Source: Computed by the Authors
Accordingly, we proceed to the traditional panel VAR-Granger causality Wald test. To check the behavior and the sensitivity of the variables we have further conducted the pairwise Dumitrescu Hurlin panel causality tests. As shown in Table 4 and 5, there exists bidirectional causality between energy consumption and carbon dioxide emission. Both tests also report bidirectional
causality between tourism and carbon dioxide emission. A unidirectional causality is found in both test and it flows from economic growth to pollutant emission. The findings also suggest bidirectional causality between ENU and TR; TR and GDP. As opposed to Table 4 that reports no causality between GDP and ENU, Table 5 suggests a unidirectional causality flowing from GDP to ENU.
Table 5. Pairwise Dumitrescu Hurlin Panel Causality Tests
Null Hypothesis: W-Stat. Prob. Decision L(ENU) does not homogeneously
cause L(CO2) 8.689*** 0.000 Reject L(CO2) does not homogeneously
cause L(ENU) 5.933*** 0.000 Reject L(GDP) does not homogeneously
cause L(CO2) 6.605*** 0.000 Reject L(CO2) does not homogeneously
cause L(GDP) 2.848 0.590 Accept L(TR) does not homogeneously
cause L(CO2) 10.393*** 0.000 Reject L(CO2) does not homogeneously
cause L(TR) 11.346*** 0.000 Reject L(GDP) does not homogeneously
cause L(ENU) 6.331*** 0.000 Reject L(ENU) does not homogeneously
cause L(GDP) 2.824 0.608 Accept L(TR) does not homogeneously
cause L(ENU) 11.111*** 0.000 Reject L(ENU) does not homogeneously
cause L(TR) 4.254** 0.035 Reject L(TR) does not homogeneously
cause L(GDP) 3.866* 0.095 Reject L(GDP) does not homogeneously
cause L(TR) 4.288** 0.032 Reject Note: ***, **, * significant at 1%, 5% and 10% respectively.
Source: Computed by the Authors
The impulse responses of one variable in light of changes in another variable are presented in Figure 1. It reveals that when the energy consumption has a positive shock, carbon dioxide emission become positive. If one standard deviation shock is given to economic growth, the reaction of pollutant emission is positive. In terms of the reaction of pollutant emission on tourism, it is first negative, reaches equilibrium after four years and is also positive later. For
energy consumption, economic growth, tourism and CO2 emissions respond positively to its positive shock within the ten years period.
Figure 1. Impulse Response
Source: Computed by the Authors
As of economic growth, all of the variables respond positive to its positive shock. The responses of all variables to a standard deviation shock in carbon dioxide emission are similar to that of economic growth. All variables respond negative to a standard deviation shock in tourism for the first three years bur revert back to equilibrium between the fourth and fifth year in the case of pollutant emission and energy consumption and responds positively later on. However, the reaction of economic growth to a standard deviation shock in tourism is negative except for the fourth and fifth year when it reverts back to equilibrium.
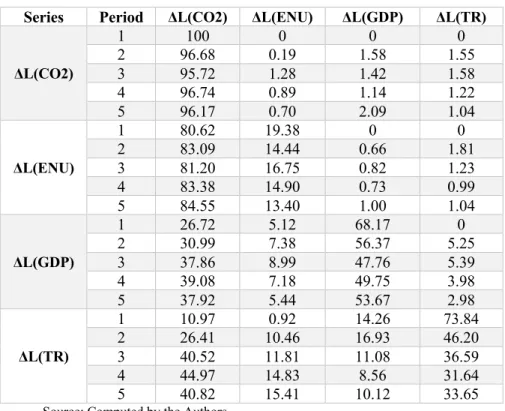
Table 6. Forecast-error variance decomposition
Series Period ΔL(CO2) ΔL(ENU) ΔL(GDP) ΔL(TR) ΔL(CO2) 1 100 0 0 0 2 96.68 0.19 1.58 1.55 3 95.72 1.28 1.42 1.58 4 96.74 0.89 1.14 1.22 5 96.17 0.70 2.09 1.04 ΔL(ENU) 1 80.62 19.38 0 0 2 83.09 14.44 0.66 1.81 3 81.20 16.75 0.82 1.23 4 83.38 14.90 0.73 0.99 5 84.55 13.40 1.00 1.04 ΔL(GDP) 1 26.72 5.12 68.17 0 2 30.99 7.38 56.37 5.25 3 37.86 8.99 47.76 5.39 4 39.08 7.18 49.75 3.98 5 37.92 5.44 53.67 2.98 ΔL(TR) 1 10.97 0.92 14.26 73.84 2 26.41 10.46 16.93 46.20 3 40.52 11.81 11.08 36.59 4 44.97 14.83 8.56 31.64 5 40.82 15.41 10.12 33.65 Source: Computed by the Authors
The variance decomposition shows that own shocks account for total variation in pollutant emission in the first year, but this effect decreases throughout the periods. All three variables account for less than 5% variation in pollutant emission. Table 6 also indicates that CO2 accounts for more than 80% variation in energy consumption throughout the periods while GDP and TR account for 1% respectively. Own shocks account for more than 50% of the variation in economic growth while CO2 accounts for more than 20% in the observed period. All of the variables are found to have a strong influence on tourism.
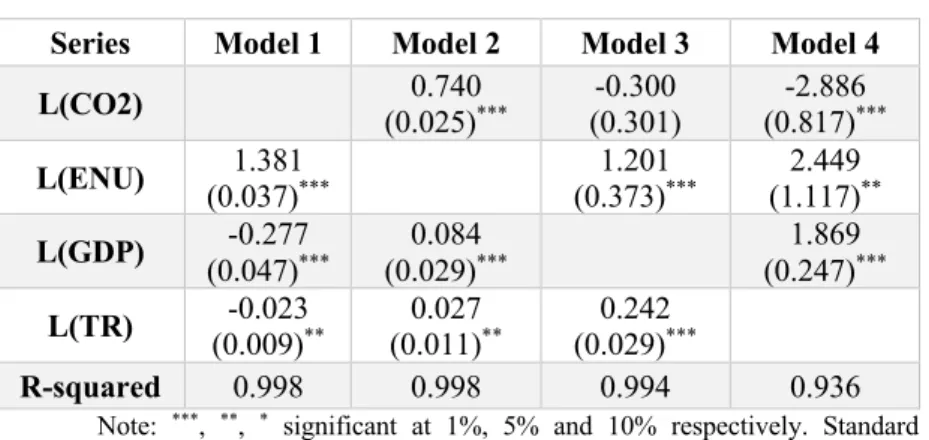
We further proceed to FMOLS estimates. Table 7 presents the results for FMOLS estimates for the equations 3-6. Beginning with model 1, the findings reveal a significant positive impact of energy consumption. Based on these findings, an increase in energy consumption tends to contribute to pollutant emission. However, negative coefficients with economic growth and tourism suggest that an increase in economic growth and tourism reduces pollutant
energy consumption, economic growth, tourism and CO2 emissions respond positively to its positive shock within the ten years period.
Figure 1. Impulse Response
Source: Computed by the Authors
As of economic growth, all of the variables respond positive to its positive shock. The responses of all variables to a standard deviation shock in carbon dioxide emission are similar to that of economic growth. All variables respond negative to a standard deviation shock in tourism for the first three years bur revert back to equilibrium between the fourth and fifth year in the case of pollutant emission and energy consumption and responds positively later on. However, the reaction of economic growth to a standard deviation shock in tourism is negative except for the fourth and fifth year when it reverts back to equilibrium.
Table 6. Forecast-error variance decomposition
Series Period ΔL(CO2) ΔL(ENU) ΔL(GDP) ΔL(TR) ΔL(CO2) 1 100 0 0 0 2 96.68 0.19 1.58 1.55 3 95.72 1.28 1.42 1.58 4 96.74 0.89 1.14 1.22 5 96.17 0.70 2.09 1.04 ΔL(ENU) 1 80.62 19.38 0 0 2 83.09 14.44 0.66 1.81 3 81.20 16.75 0.82 1.23 4 83.38 14.90 0.73 0.99 5 84.55 13.40 1.00 1.04 ΔL(GDP) 1 26.72 5.12 68.17 0 2 30.99 7.38 56.37 5.25 3 37.86 8.99 47.76 5.39 4 39.08 7.18 49.75 3.98 5 37.92 5.44 53.67 2.98 ΔL(TR) 1 10.97 0.92 14.26 73.84 2 26.41 10.46 16.93 46.20 3 40.52 11.81 11.08 36.59 4 44.97 14.83 8.56 31.64 5 40.82 15.41 10.12 33.65 Source: Computed by the Authors
The variance decomposition shows that own shocks account for total variation in pollutant emission in the first year, but this effect decreases throughout the periods. All three variables account for less than 5% variation in pollutant emission. Table 6 also indicates that CO2 accounts for more than 80% variation in energy consumption throughout the periods while GDP and TR account for 1% respectively. Own shocks account for more than 50% of the variation in economic growth while CO2 accounts for more than 20% in the observed period. All of the variables are found to have a strong influence on tourism.
We further proceed to FMOLS estimates. Table 7 presents the results for FMOLS estimates for the equations 3-6. Beginning with model 1, the findings reveal a significant positive impact of energy consumption. Based on these findings, an increase in energy consumption tends to contribute to pollutant emission. However, negative coefficients with economic growth and tourism suggest that an increase in economic growth and tourism reduces pollutant