Volume 27, Number 2, Pages 132-140 (2018) DOI: 10.1501/commuc_0000000208 ISSN 1303-6025 E-ISSN 2651-3749
http://communications.science.ankara.edu.tr/index.php?series=C
Received by the editors: November 28, 2018; Accepted: December 05, 2018. Key word and phrases: Pollen, Aerobiological stations, Zonguldak, Turkey
Submitted via II. Aerobiology and Palynology Symposium 07-10 October 2018 (APAS 2018)
© 2018 Ankara University Communications Faculty of Sciences University of Ankara Series C: Biology COMPARISON OF TWO AEROBIOLOGICAL STATIONS DATA IN
ZONGULDAK
SENOL ALAN, AYSE KAPLAN
Abstract. In this study, data from two Durham sampler placed at different altitude in Zonguldak city (Incivez station, 60m) center and near Kozlu district, (Kozlu station, 190m) was compared by using different statistical approaches. Spearman's rank correlation test and the Kolmogorov-Smirnov test were used for comparing data and its distribution. Mann-Whitney U test was used for comparison of groups. It was seen that pollen of arboreal taxa were dominant in Incivez station than Kozlu station. With it was observed differences in pollen of non-arboreal taxa especially in Solanum pollen between station in the result of correlation test and the comparing of distribution. Besides that some differences were also found in pollen of members of some Fagales order between stations in the result of comparison of groups. Although the differences determined between station in this study was higher than other studies in the literature, degree of this was not higher enough considering hilly topography of Zonguldak city.
1. Introduction
The relationship between pollen and allergy is a well-defined phenomenon. Similarly there is a close relationship between pollen concentration in the atmosphere and vegetation of study area. Pollen dispersion is affected by many factors such as meteorological and geographical factor. Therefore it was reported that a significant differences between pollen concentrations over years in many aerobiological stations [1]. While in many cases, pollen concentration tended to be higher due to global climate changes [2], sometimes pollen concentration getting lower because of urbanization [3]. In any case, aerobiological studies is very valuable for monitoring allergenic pollen and spore types. Therefore in many part of world pollen and spore monitoring studies have been done for long time. Early studies focused on determining of pollen and spore concentrations of city centers. Whereas recent studies have focused on placed where tourism activities is high. On the other hand, it was shown that pollen concentration obtained has been highly affected by the place of sampler. Xiao et. al showed that the number of pollen trapped and its concentration were decreasing with increasing height [4]. Actually
investigation of relationship between pollen concentration and height of places which sampler placed is not newly topic. Raynor et al. emphasized that concentration of Ambrosia pollen showed great variation from day to day in slides from samplers which placed at 5 levels (1.5 to 108m) [5]. The differences in pollen profile associated with height of site on which sampler were even obtained in the lower heights. Data from six different rotorod samplers that were placed one meter spaced revealed that pollen of herb/shrub were dominant at lower heights [6].
The geographical properties of place in which aerobiological station is placed is also important for collecting airborne especially transported pollen. It was shown that Zonguldak city center is protected from pollen and allergen transported from the south of Zonguldak by hills that lay behind Zonguldak [7]. Therefore, data of two aerobiological stations in Zonguldak were compared using different statistical approach in this study, in order to demonstrate of effect of elevation changes.
2. Materials And Methods
2.1. Study area
Zonguldak which places in Western Black Sea region of Turkey is mainly characterized by vegetation mainly composed of deciduous forests. It was reported that broad-leafed trees such as Fagus orientalis (Oriental Beech), Quercus (Oak), Carpinus betulus (Hornbeam), C. orientalis (Oriental Beam), Castanea sativa (Chestnut), Platanus orientalis (Oriental Plane), Tilia tomentosa (Silver Lime), Alnus glutinosa (Common Alder), Corylus colurna (Turkish Hazel) and Ostrya carpinifolia (Hop Hornbeam) are dominant in Zonguldak [8]. So vegetation of Zonguldak are considered a Mediterranean, Euxin vegetation. Climate of Zonguldak is oceanic and average annual rainfall is 1040.5 mm and annual average temperature is 13.6 °C from data obtained from the Turkish State Meteorological Service.
2.2. Pollen Sampling
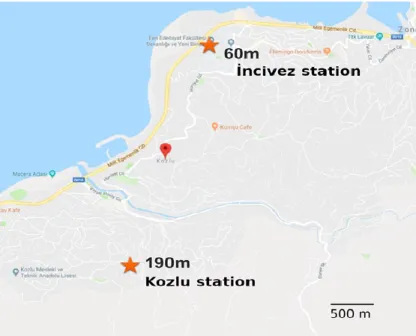
In this study, data from two aerobiological stations which is equipped with a gravimetric Durham sampler were used. One of them was placed on the roof of an office in Zonguldak Bulent Ecevit University
campus (Incivez station). The other was placed on the roof of civilian building in Kozlu district (Kozlu station). Both sampler were placed approximately at height of
10m. Air distance between samplers was about 2.5km. Elevation of Incivez and Kozlu stations was about 90 and 160m respectively (Figure 1). The slides were changed weekly during 2003 and then were covered with glycerine-gelatine mixed with safranin, before microscopic analysis. Pollen concentrations were obtained by full area counting of slides and converting pollen/cm2.
2.3. Statistical Analysis
In order to compare pollen concentration from two aerobiological stations, it was followed the approach defined by Del Mar Trigo et al. [9]. Spearman rank- correlation test was used to determine correlation between stations. the Kolmogorov-Smirnov test was used for determine whether pollen concentration distributed normally or not, besides comparing distribution of weekly pollen concentration. The pollen distributions were also compared by using non-parametric Mann-Whitney U test. All tests was carried out using custom web interface prepared by a python Microframework Flask and SciPy python package [10].
3. Results And Discussion
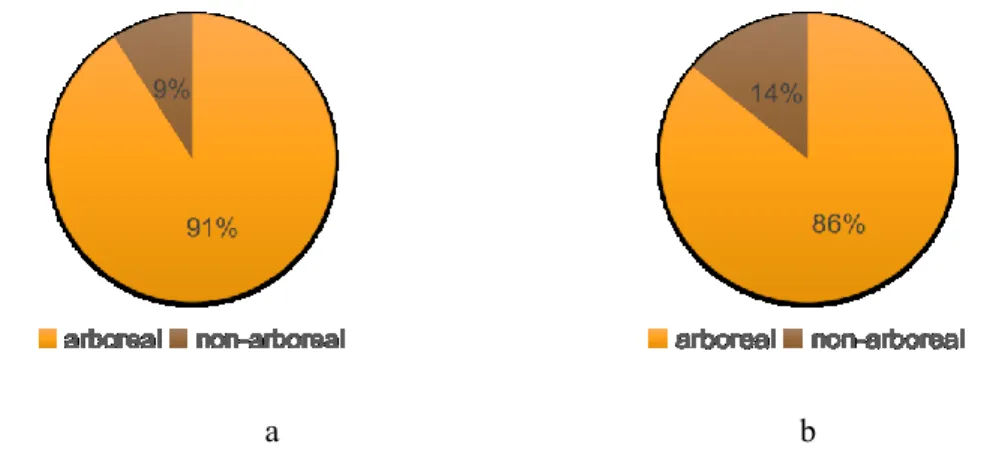
Total 45 taxa of which 25 of this are arboreal were identified. Annual pollen index was 3246.2 and 2941.6 for Incivez and Kozlu stations respectively from 45 taxa. While 52% of total pollen concentration in this study was obtained from the Incivez station, the rest was obtained from the Kozlu station. There was slight difference in percentages of pollen of arboreal plants between stations. 91% of total pollen concentration consisted of tree and shrub pollen in Incivez, whereas the rate was 86% in the Kozlu station (Figure 2).
a b
FIGURE 2. Distribution of arboreal and non-arboreal pollen according to stations. a. Incivez station, b. Kozlu station.
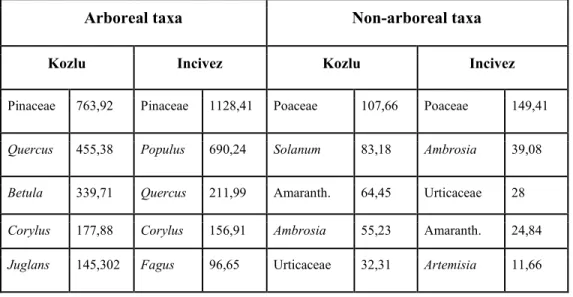
Top five arboreal taxa whose contribution of their pollen was highest to total pollen load in the atmosphere were Pinaceae, Populus, Quercus, Corylus and Fagus for in Incivez station and Pinaceae Quercus, Betula, Corylus and Juglans in Kozlu station. On the other hand, more similar pattern was determined for non-arboreal pollen (Table 1).
The month in which highest total and arboreal pollen concentration recorded was May in both stations. However while highest pollen concentration belonging to non-arboreal taxa was recorded in June in Incivez station, it was recorded in August in Kozlu station (Figure 3).
TABLE 1. Annual pollen indexes of top five arboreal and non-arboreal taxa in two stations.
Arboreal taxa Non-arboreal taxa
Kozlu Incivez Kozlu Incivez
Pinaceae 763,92 Pinaceae 1128,41 Poaceae 107,66 Poaceae 149,41
Quercus 455,38 Populus 690,24 Solanum 83,18 Ambrosia 39,08
Betula 339,71 Quercus 211,99 Amaranth. 64,45 Urticaceae 28
Corylus 177,88 Corylus 156,91 Ambrosia 55,23 Amaranth. 24,84
Juglans 145,302 Fagus 96,65 Urticaceae 32,31 Artemisia 11,66
Selected results of correlation analysis of weekly pollen concentration from two stations was given in Table 2. It was found that Amaranthaceae, Urtica and Fagus pollen have the highest correlation coefficient between stations. On the other hand, there was a statistically differences pollen concentrations of Solanum, Rumex, Typha between stations at 95% confidence level (Table 2).
The Kolmogorov-Smirnov test was also done for the equality of continuous of pollen distribution. According to this test results, it has been found that Solanum (D=0.547, P<0.001) and total of nonarboreal taxa (D=0.321, P<0.001) pollen were different between stations. The last test for comparison of two stations was the group comparison with Mann-Whitney U test. In contrast to other tests used in the study, the result of this test indicates that some arboreal taxa such as Juglans, Ostrya, Quercus were different between stations. Solely Solanum pollen concentration among arboreal taxa was different. On the other hand total non-arboreal pollen were different. It is very interesting is that observation of differences in taxa belonging to Fagales that are characterized by having catkin.
a
b
FIGURE 3. Monthly variations of arboreal and non-arboreal pollen concentrations in İncivez (b) and Kozlu (b) stations.
TABLE 2. Results of Spearman’s rank correlation analysis between stations with weekly data. Only results of three most correlated and uncorrelated taxa were given.
Taxa Amaran. Urtica Fagus Solanum Rumex Typha Arboreal Non-arboreal Coeff. 0.927** 0.883 0.828
** 0.22 0.251 0.154 0.904 ** 0.804 ** ** p<0.01
TABLE 3. Pollen types which statistically different between stations in the result of Mann-Whitney U test based on weekly pollen data.
Juglans Ostrya Quercus Solanum
non-arboreal
Statistic./P-value
1086.0/0.007 1193.0/0.044 1122.5/0.027 677.0/0.006 987.5/0.004
There are some studies about comparing pollen data between stations. Velasco-Jiménez et al. reported that there was no significant differences between two aerobiological stations which have about 9 km apart [11]. They found correlation between all studied pollen types. Although our results are consistent with this study, we found some differences between stations despite of lower distance between sampler than their study. This could be associated with height of sampler. They placed samplers approximately same height. On the other hand, while distance increases, it has been observed differences between stations even though samplers placed same height. Del Mar Trigo et al. indicated clear differences between stations where were placed apart 40 km at approximately same height [9]. Interestingly, they reported that Quercus and Poaceae were the pollen showed fewer differences. In contrast to our results indicates that differences in non-arboreal taxa more evident than non-arboreal taxa. Vegetation of the region that sampler placed could be primarily responsible for this difference. Kozlu is a district with garden houses. Although significant difference was observed between pollen and allergen concentration in one aerobiological station [7], such a difference was
not observed in pollen concentrations between stations. This can be interpreted that pollen and allergens have different aerodynamic.
References
[1] P.J. Beggs, C.H. Katelaris, D. Medek, F.H. Johnston, P.K. Burton, B. Campbell, A.K. Jaggard, D. Vicendese, D.M. Bowman, and I. Godwin, Differences in grass pollen allergen exposure across Australia. Australian and New Zealand Journal of Public Health, 39 (1), (2015) 51–55.
[2] T. Frei and E. Gassner, Climate change and its impact on birch pollen quantities and the start of the pollen season an example from Switzerland for the period 1969–2006. International Journal of Biometeorology, 52, No. 7 (2008) 667.
[3] A. Acar, S. Alan, A. Kaplan, E.O. Baysal, C. Doğan, and N.M. Pinar, General trends in atmospheric pollen concentration in the high populated city of Ankara, Turkey. Karaelmas Fen ve Muhendilik Dergisi, 7, No. 1 (2017) 40–46.
[4] X. Xiao, A. Fu, X. Xie, M. Kang, D. Hu, P. Yang, and Z. Liu, An investigation of airborne allergenic pollen at different heights. International Archives of Allergy and Immunology, 160 (2) (2013) 143–151.
[5] G.S. Raynor, E.C. Ogden, and J.V. Hayes, Variation in ragweed pollen concentration to a height of 108 meters. Journal of Allergy and Clinical Immunology, 51 (4) (1973) 199–207.
[6] P. Chakraborty, S. Gupta-Bhattacharya, I. Chowdhury, M.R. Majumdar, and S. Chanda, Differences in concentrations of allergenic pollens and spores at different heights on an agricultural farm in West Bengal, India. Annals of Agricultural and Environmental Medicine, 8 (2) (2001) 123–130.
[7] S. Alan, A. Acar Sahin, T. Sarısahin, S. Sahin, A. Kaplan, and N.M. Pınar, The effect of geographical and climatic properties on grass pollen and Phl p 5 allergen release. International Journal of Biometeorology, (2018) 1–13. [8] A. Kaplan, Airborne pollen grains in Zonguldak, Turkey, 2001-2002. Acta
Botanica Sinica, 46 (6), (2004) 668–674.
[9] M. Del Mar Trigo, F.J. Toro, M. Recio, and B. Cabezudo, A statistical approach to comparing the results from different aerobiological stations. Grana, 39 (5), (2000) 252–258.
[10] E. Jones, T. Oliphant, and P. Peterson, {SciPy}: open source scientific tools for {Python}, (2014).
[11] M.J. Velasco-Jiménez, P. Alcázar, E. Domínguez-Vilches, and C. Galán, Comparative study of airborne pollen counts located in different areas of the city of Córdoba (south-western Spain). Aerobiologia, 29, No. 1 (2013) 113– 120.
Current Address: SENOL ALAN: Bulent Ecevit University, Faculty of Art and Sciences, Department of Biology, Zonguldak, Turkey.
E-mail: [email protected]
ORCID: https://orcid.org/0000-0003-4941-1794
Current Address:AYSE KAPLAN: Bulent Ecevit University, Faculty of Art and Sciences, Department of Biology, Zonguldak, Turkey.
E-mail: [email protected]