45 Transportation Research Record: Journal of the Transportation Research Board, No. 2376, Transportation Research Board of the National Academies, Washington, D.C., 2013, pp. 45–55.
DOI: 10.3141/2376-06
E. F. Morgul and K. Ozbay, Department of Civil and Environmental Engineering, Rutgers Intelligent Transportation Systems Laboratory, Rutgers University, 96 Frelinghuysen Road, Piscataway, NJ 08854. Current affiliation for E. F. Morgul and K. Ozbay: Department of Civil and Urban Engineering, Center for Urban Science and Progress, New York University, 1 Metrotech Center, 19th Floor, Brooklyn, NY 11201. O. Cavus, Department of Industrial Engineering, Bilkent University, 06800 Ankara, Turkey. C. Iyigun, Department of Industrial Engineering, Middle East Technical University, Universiteler Mahallesi, Dumlup #305, Nar Bulvar #305, No. 1, 06800 Çankaya, Ankara, Turkey. Corresponding author: E. F. Morgul, [email protected].
the number of extraboard operators comes at a significant cost. Thus efficient extraboard management is necessary for optimum use of lim-ited resources. In the case of an evacuation, the burden on transit agen-cies to meet minimum service requirements (which may be greater or different from regular service) is of even higher importance. At the same time, absenteeism can be higher because of operators’ personal concerns or constraints that prevent them from fulfilling their duties.
Despite its critical role in transit operations, extraboard staff allocation has not received the same level of attention in the literature as other problems, such as vehicle routing, driver cost reduction, or fleet sizing. According to the key findings of a survey of transit agencies in the United States conducted by DeAnnuntis and Morris, the majority of agencies use full-time operators as extraboard opera-tors (hourly pay is higher than for half-time operaopera-tors), the rates of absenteeism are not properly recorded or evaluated, and automated scheduling software is not used to assist in determining the extraboard requirement in lieu of historical data (1). Another study, in which decision makers from 35 transit agencies in the United States were interviewed, found that scheduling software packages used by agencies do not include a module for extraboard management. The general trend for determining the correct size of extraboard staff in practice depends on historical data and experience. The literature review conducted as part of the same study showed that the limited number of earlier efforts focused only on minimizing overtime pay-ments. Developed models were tested for specific transit systems only, and no generic model applies to all transit systems (2).
The importance of transit-based evacuation has been increasingly recognized during the past few decades. Several studies emphasize the lack of planning to evacuate transit-based populations effec-tively, especially after the experiences of the terrorist attacks of September 11, 2001, in New York and Hurricanes Katrina and Rita in the southeastern United States (3–7). Performance evaluation reports after the two hurricanes clearly demonstrate a significant failure in the lack of evacuation plans for people who do not drive or are dependent on transit. Besides the lack of an effective plan, limited resources for some agencies is an obstacle. For instance, New Orleans had approxi-mately 500 buses and needed about 2,000 buses to evacuate all of the residents who were not using their private vehicles (4). Another com-prehensive analysis for transit-based emergency evacuation includes the results of a survey of agencies to evaluate the emergency plans of major urbanized areas in the country. Of 16 respondents, only one (Seattle, Washington) stated that it has a plan for ensuring that the transit staff will be available in an emergency condition, which highlights the lack of effective planning for extraboard sizing among transit agencies (3).
Extraboard management is one of the vital components of transit evacuation planning because it ensures that there will be a sufficient
Modeling of Bus Transit Driver Availability
for Effective Emergency Evacuation
in Disaster Relief
Ender Faruk Morgul, Ozlem Cavus, Kaan Ozbay, and Cem Iyigun
Potential evacuees without access to personal automobiles are expectedto use transit, especially buses, to reach safer regions. For a transit agency, operation problems to be considered include establishing bus launch areas, positioning the minimum number of required buses, and coordinating transit operators, especially determining whether the number of drivers will be sufficient to cover the number of vehicles (i.e., buses) to be used during the evacuation. It is also highly probable that during an emergency, absenteeism rates for bus drivers might increase. In this study, the authors developed two stochastic models to determine the need for extra drivers during an emergency evacuation and to pro-vide optimal solutions using well-established concepts in mathemati-cal programming. First, the authors reviewed the literature to develop an effective methodology for the development of optimal extraboard management strategies. The authors found that although several recent reports clearly mentioned the problem of not having enough bus drivers during emergency evacuation operations, no analytical study incorpo-rated the optimal extraboard size problem into emergency evacuation operations. Second, two mathematical models are presented in this paper. The aim of the developed models is to fill the gap in the litera-ture for determining optimal extraboard size for transit operations dur-ing emergency evacuations. The models are specifically designed to capture risk-averse behavior of decision makers. Finally, these models were tested with hypothetical examples from real-world data from New Jersey. Results show that both models give reasonable extraboard size estimates, and under different conditions, these models are responsive to the changes in cost and quality of service preferences. The results are encouraging in terms of the models’ usefulness for real-world applications. Transit agencies must employ enough operators for transit vehicles to meet scheduled service requirements and to account for absences because of illness, vacation, absenteeism, and the like. Agencies employ extraboard operators (on-call backups) to account for these situations and ensure that service is not interrupted. Overestimation of
number of bus drivers to evacuate transit-dependent victims of a disaster. Thus the goal of this paper is to provide practical models that can be used to better plan to meet needs of a transit agency in terms of drivers for different types of emergency evacuations. Quality of service, which is a widely used measure of reliability, is used in these models. The objective function of the problem is to minimize the total costs of extraboard management, which include agency costs and social costs. Two models are proposed to determine the optimum number of extra drivers for a predefined quality of service requirement, which is assumed to be determined by the agency itself.
The rest of the paper is organized as follows. The next section is a review of the literature about extraboard management. The following section explains the stochastic programming models used in this paper and later gives the models for the extraboard problem. Next, numerical examples using the proposed models are presented. Then the results of these various scenarios are discussed. The paper concludes with a summary of the findings and the direction for future research.
Literature review
The importance of transit operations during emergency evacua-tions is well established by several studies conducted after recent catastrophic events that required mass evacuations. However, devel-opment of an operational extraboard management model has not received the same level of attention as optimal routing of transit vehi-cles to maximize the number of people evacuated while minimizing evacuation times.
Extraboard management is studied only in the context of daily transit operations, and there is no specific study on this important problem for emergency evacuations. Although the number of studies about optimal extraboard sizing is also limited for regular operations, there is an agreement on two factors affecting the extraboard size, namely, labor contracts and the size of the fleet (1). However these constraints can be relaxed to some extent for an emergency situa-tion because many of the state plans described in the TRB report on transit-based evacuation suggest the usage of extra resources such as school buses and their drivers as the additional capacity (3).
Earlier studies defining the extraboard management problem stated that for regular operations, the major cause of extraboard staff need is “open work,” which is a term used for temporarily uncovered work assignments. Open work can be a result of unassigned service, non-operating assignments, or operator absence (8). Open work caused by absenteeism is a major issue during an evacuation operation because the risk of losing drivers might be higher, depending on the severity of the situation. This situation was underlined in the evaluation report prepared in the aftermath of Hurricanes Katrina and Rita (4).
One of the earlier and most significant studies focusing on extraboard management for regular scheduling of transit systems was conducted by Koutsopoulos. This paper proposed models for determining the optimum number of extra operators for regular daily operations of transit systems by defining the problem at three levels: strategic, tactical, and operational. At the tactical level, deter-mination of the required daily extraboard assignments by using the available resources was the main objective. The model attempted to minimize the expected daily difference between the available extraboard operators and the current ones who have days off. The model constraints ensured that all operators were using 2 days off per week. The author noted that the model assumes a requirement of 100% reliability. The Frank–Wolfe algorithm was used as the solution method for the continuous version of the problem. An application
to a real-world example resulted in a 24% decrease per week in the expected overtime (9).
A comprehensive discussion about the reliability and absenteeism relationship, with its role in determining optimal extraboard size, was given by Shiftan and Wilson in 1994. They started their analysis by developing a disaggregate model to understand the relationship between absenteeism and overtime (i.e., trips for which extraboard drivers are needed) and estimated the model using panel data from the Massachusetts Bay Transportation Authority. They found that absenteeism is a habit that cannot be handled by reducing overtime. In other words, even if extra effort is made to cover most of the trips with regular drivers, absenteeism will not be reduced significantly, and the only solution may be enforcements through strict monitor-ing. The authors did not recommend generalization of their finding because it might have been data specific. They then studied the rela-tionship between reliability and overtime using aggregate data from the Massachusetts Bay Transportation Authority. Similar to the pre-vious research by Koutsopoulos, they measured the reliability as the expected number of missed trips and found a strong relationship between the two parameters. They concluded that it is important to take reliability into account in strategic extraboard management models (10).
Another related study by Shiftan and Wilson proposed a model to determine the optimal staff size for minimizing the total operating cost, considering a minimum desired service reliability constraint. The authors considered a global model with two stages. The first stage estimated the optimal total staff size (i.e., including extraboard as a function of the reliability constraint) for a given time (e.g., a month), and the second stage aimed to determine the annual hiring program and vacation day allocations. The authors calculated the number of extraboard personnel as the difference between required work and available manpower (11).
Different aspects of transit-based evacuation modeling are also reviewed. A number of studies on modeling routing of transit vehicles for evacuation are identified. However, none of the reviewed studies incorporates constraints related to staffing in the models. A heuristic algorithm based on the vehicle routing problem was developed by Bish to model the bus-based evacuation for a threat with advance notice (12). Transit-dependent evacuation for a no-notice disaster was also studied by Sayyady and Eksioglu. The developed model aimed to maximize the number of evacuees served during the evacuation operation (13).
The literature search reveals that no specific model has been developed to determine the optimal extraboard sizing for transit-based evacuation planning. Therefore, the contribution of this paper is twofold. First, it defines a general extraboard management model for evacuation operations with stochastic programming methods, and second, it provides techniques capable of handling the risk-averse behavior of the decision makers as well as the system service quality. One of the key points of the modeling and solution approaches is the flexibility of the models in the specific purpose they will be used for. As a direct result of this flexibility, the proposed mod-els can be applicable to different events and multiple regions in an evacuation area.
research MethodoLogy
Extraboard management is a complex problem because of the uncertainty of open work. The probability of a driver to show up dur-ing regular operations can be estimated by employdur-ing the historical
data of absenteeism resulting from certain factors such as illness or vacation. However, this process is not straightforward because of the lack of reliable recording of precise open work data. The problem gets even more complex for emergency conditions because it is difficult to predict the behavior of driver crews struggling with their own evacu-ation problems. External factors such as the availability of roads for access to the main hubs also affect the probability of reporting to duty. Therefore, the problem of predicting the available number of drivers under emergency conditions is highly stochastic.
If the agency can make an adequate estimation of the probabil-ity distribution of driver availabilprobabil-ity, the extraboard management problem can be formulized as a stochastic problem for different quality of service levels. The term quality of service is used for the reliability measure of the service, which also offers flexibility for the agency or decision makers to take into account various probabilities of outcomes. For example, an agency may decide to have a higher quality of service in the shore regions during a hurricane than in inland regions to avoid extra costs. This factor also brings the concept of risk into the problem because agencies’ risk-taking behavior may also be an important factor in extraboard management strategy. Therefore, in this paper, the authors present two approaches to model the risk-taking behavior of decision makers.
The models in this paper are developed for an evacuation area that can consist of several regions. The idea of dividing the evacuation area into regions ensures that every region has independent needs and the capability to hire extra staff. This assumption is made because in an emergency, connections between regions can be disturbed and staff transfer between regions may not be possible. It is also considered that the driver costs can be varied depending on the region, which can get higher as the vulnerability risk increases.
Demand for drivers is assumed to be directly related to transit-dependent demand by the people affected by the specific disaster. Transit-dependent demand for evacuation may vary substantially during emergencies, but considering both demand and supply as random variables may bring additional computational difficulties. Car ownership and other socioeconomic data from census reports can be useful for deterministic demand estimation that can be used by the models presented here.
Parameters that are common to both models follow: N = number of regions;
Mi = number of realizations of available regular drivers at region i∈ {1, . . . , N};
Ri = random variable representing the number of available regular drivers at region i ∈ {1, . . . , N} [its distribution is P(Ri = Rij) = pij, j ∈ {1, . . . , Mi}];
Di = demand for drivers at region i ∈ {1, . . . , N}; c = cost per unit of unsatisfied demand ($); and cix = cost for extraboard drivers ($).
The decision variable (integer) used in the models is xi = number of extraboard drivers at region i ∈ {1, . . . , N}.
Model 1
Model 1 aims to determine the optimal number of drivers for each region depending on the probability distributions for driver availabilities. Risk-averse behavior is involved in the model only in terms of a systemwide quality-of-service parameter. Thus, individual
risk-taking preferences of decision makers are not captured in this model. c z pij c x j M ij iX i i N i N i
∑
∑
∑
+ = = = minimize (1) 1 1 1 subject to P D x(
− ≤R)
≥qservice (2) zij≥Di−Rij−xi i∈{
1, . . . ,N j}
, ∈{
1, . . . ,Mi}
(3) zij≥0 i∈{
1, . . . ,N j}
, ∈{
1, . . . ,Mi}
(4) xi≥0 and integer i∈{
1, . . . ,N}
(5) wherezij = unsatisfied demand when there exist Rij regular drivers with probability pij;
R = vector of Ri, i ∈ {1, . . . , N}; D = vector of Di, i ∈ {1, . . . , N}; x = vector of xi, i ∈ {1, . . . , N}; and
qservice = systemwide quality of service determined by decision makers.
The model aims to minimize the overall costs of extraboard scheduling for an emergency evacuation operation. The objective function (Equation 1) has two terms representing costs. The first term in the objective function is the total expected cost for the unsat-isfied demand and the second term is the driver costs for the hired extraboard staff. Unsatisfied demand brings an indirect cost that is difficult to quantify in terms of monetary units. The interpretation of this portion of the cost model can be made by considering the costs of a possible injury or fatality because of the failure of the evacua-tion operaevacua-tion. The second cost term in the objective funcevacua-tion is a direct cost for the extra drivers, including salaries and other benefits. Therefore, the model tries to optimize the number of extraboard drivers by considering the cost burden for the operating agency. The term “quality of service” is included in the first constraint (Equation 2), which gives the flexibility to determine the optimal extraboard scheduling to the decision makers for different possible situations. Here, quality of service is defined systemwide. When its value is equal to one, the constraint (Equation 2) will be satisfied with 100% certainty. Thus, it becomes a deterministic constraint. The second and third constraints are presented in Equations 3 and 4, with the objective function force zij to be equal to unsatisfied demand, which is max{0, Di − Rij − xi}.
Model 1 is solved with the p-level efficient point (p-lep) technique. The p-lep algorithm for a given discrete distribution was introduced by Prekopa et al., and it is an efficient and fast way of calculating the Pareto frontiers (p-efficient points) (14). The p-lep method has been employed in several studies for modeling evacuation opera-tions, including measuring the probabilistic effects of road capacity constraints on shelter capacities for a hurricane evacuation (15), evacuation network modeling (16) and inventory management for disasters (17). [For further discussion of the theoretical background
of the p-lep technique, see work by Prekopa et al. (14), Prekopa (18) and Dentcheva et al. (19)].
Model 2
Solving Model 1 can be computationally difficult when the number of evacuation regions is large. In this section, the authors suggest an alternative model that is linear and handles the risk by using second-order stochastic dominance constraints. The dominance constraints require a reference distribution for the unsatisfied demand. In Model 2, the authors are interested in finding a distribution of unsatisfied demand that is at least as good as the reference distribution.
second-order stochastic dominance constraints Model 2 uses second-order stochastic dominance constraints, which allow decision makers to obtain a random outcome from an optimi-zation problem that is at least as good as another reference random outcome. In this case, it is said that the resulting random outcome stochastically dominates the previously given probabilistic reference outcome.
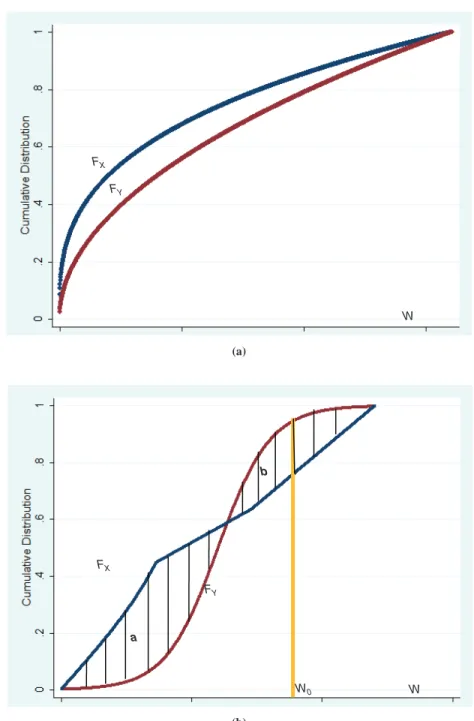
The stochastic dominance concept is defined for different orders. Figure 1 is a graphical depiction of the concept of stochastic domi-nance. If higher values are preferable, first-order stochastic dominance ensures that an alternative Y dominates another alternative X when the cumulative distribution function of Y (denoted by FY) never lies
FIGURE 1 Stochastic dominance: (a) first order and (b) second order.
FY W FX FX FY W W0 a b (a) (b)
above the cumulative distribution of X (FX), where F denotes the cumulative distribution function. However, first-order dominance is not always enough to explain the risk-averse behavior; therefore, higher-order stochastic dominance models are used to distinguish different risk attitudes of decision makers (20). Integrable random variables are used and risk-averse decisions are taken, depending on the areas under the curve. In Figure 1b, Y dominates X in the second order if the area under FX is not smaller than the area under FY for any W0, or in other words, a − b ≥ 0. A comprehensive analysis of stochastic dominance relationships is given by Muller and Stoyan (21). If every risk-averse decision maker prefers an option Y to X (higher values are preferable for both), given that they have increasing concave utility functions, then Y is said to dominate X with respect to second-order stochastic dominance (SSD) and is denoted as Y ≥ (SSD)X. In this paper, the authors use another notation common in the literature: Y≥ (2)X. A dual concept of second-order stochastic dominance is called increasing convex order (icx), which defines an ordering relation when lower values of X and Y are preferable. Y ≤ (icx)X denotes that Y is less than or equal to X in the sense of increasing convex order. It is known that Y ≤ (icx)X if and only if −Y ≥ (SSD) − X [see work by Muller and Stoyan (21) for details].
Although stochastic dominance is popular in statistics and finance areas, it remains largely unexplored in transportation research. To the knowledge of the authors, the only related study in the literature is an optimal path problem formulated by using second-order stochastic dominance constraints for analyzing risk-averse driver behavior (22).
Dentcheva and Ruszczynski introduce stochastic optimization prob-lems with dominance constraints and study the optimality and dual-ity conditions (23, 24). Model 2, which uses second-order stochastic dominance constraints, is defined as
c z pij c x j M ij iX i i N i N i
∑
∑
∑
+ = = = minimize (6) 1 1 1 subject to Zi Yi i{
N}
− ≥ −( )2 ∈1, . . . , (7) zij≥Di−Rij−xi i∈{
1, . . . ,N j}
, ∈{
1, . . . ,Mi}
(8) zij≥0 i∈{
1, . . . ,N j}
, ∈{
1, . . . ,Mi}
(9) xi≥0 and integer i∈{
1, . . . ,N}
(10)where P(Zi = zij) = pij is demand equal to zij, which is not satisfied with probability pij, and P(Yi = yil) = fil is the reference distribution of unsatisfied demand at region i with l ∈ {1, . . . , Hi}.
The objective function of Model 2 is the same as that of Model 1. The first constraint (Equation 7) is introduced to find a distribution for Zi which is at least as good as the reference distribution. Therefore, the reference distribution should be one that is acceptable by both modelers and practitioners. Assume that the unsatisfied demand at region i is distributed by P(U = uil) = fil, i ∈ {1, . . . , N}, l ∈ {1, . . . , Hi} when no extraboard drivers are hired. Here Hi is the number of realizations for the unsatisfied demand. The authors define qi
service corresponding to an improvement for the unsatisfied demand of a region i ∈ {1, . . . , N}.
For the reference distribution of unsatisfied demand, the following is assumed:
P Y
(
=yil=(
1−qservicei)
uil =)
fil (11) Here ⎡a⎤ denotes the smallest integer not less than a. Because the unsatisfied demand takes integer values, (1 − qiservice)uil is rounded up to the nearest integer. A similar calculation for reference distribution can be found in work by Noyan, who used second-order stochastic dominance constraints to model the risk aversion in an emergency response facility location and allocation problem (25).
A linear formulation for the second-order stochastic dominance constrained optimization problem is introduced by Luedtke (26). Following Theorem 3.2 of Luedtke’s work, the authors obtain the formulation in Equations 12 through 15 for the dominance constraint in Equation 7: y wil ikl zik i N k M l H i i
∑
≥ ∈{
}
∈{
}
= 1, . . . , , 1, . . . , (12) 1 wikl i N k M l H i i∑
= ∈{
}
∈{
}
= 1 1, . . . , , 1, . . . , (13) 1 p wik ikl fil i N l H k M i i∑
= ∈{
}
∈{
}
= 1, . . . , , 1, . . . , (14) 1 wikl≥0 i∈{
1, . . . ,N k}
, ∈{
1, . . . ,M li}
, ∈{
1, . . . ,Hi}
(15) additional constraintsAdditional constraints can be included in the models. In real-world applications, there is always a budget constraint, which can be added for driver cost as follows, where UBbudget is the upper bound for the budget: c xi X i i N
∑
≤ = UBbudget (16) 1Another constraint can be used to limit the total number of extra-board drivers (where UBtotal drivers is the upper bound for the total num-ber of drivers), which is a sum of all drivers for all regions in the evacuation region. This bound may be determined from the licensed bus driver numbers in that region and can be included in the model as
xi i N
∑
≤ = UBtotal drivers (17) 1The following section presents an example that illustrates the use of these models.
case study
In this section, the authors present an example using the two models. The problem is defined for four regions with different characteris-tics in terms of driver demand and availability. Input parameters are
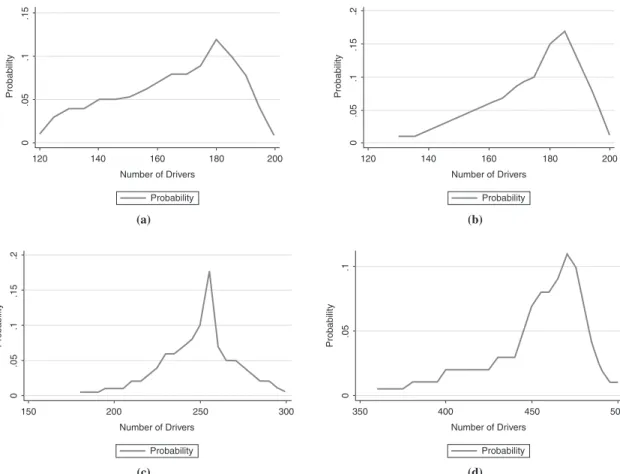
selected to demonstrate the capabilities of the models. Driver demand is assumed to be deterministic, and the availability of drivers during an emergency condition is subject to change according to a probabilistic distribution. Assumed values are shown in Figure 2.
Regions 1 and 2 have the same number of drivers for regular con-ditions, but Region 1 has a larger transit-dependent population under threat. Region 2 demands the lowest number of extra drivers during evacuation, indicating neither that this region is as much under risk as other regions nor that decision makers exhibit a risk-prone behavior for this region. Region 4 has the largest number of regular drivers and the need for drivers in an emergency is also the greatest.
Probability distributions depict the certainty and uncertainty of the available number of drivers during an emergency evacuation. For example, a distribution with a sharp increase for Region 3 indicates that decision makers have a strong belief that they will have a certain number of drivers with the probability of the peak point value, whereas the probabilities of the others are considerably lower. For Region 1, there is a flat distribution, which shows a higher level of uncertainty about driver availability.
Table 1 shows the scenario definitions and model outputs. For most of the scenarios, extra driver requirements determined by Model 2 are usually greater than or equal to the numbers obtained from Model 1. This difference is the cause of higher total costs for Model 2. For the first eight scenarios in which unsatisfied demand cost is assumed to
be in a similar range with driver costs, Model 1 seems to be more sensitive to the marginal changes in driver costs. For Scenarios 9 through 12, for which considerably higher unsatisfied demand costs are assumed, both models try to keep the extra driver numbers as high as possible.
Both models generate reasonable results under different scenarios, and it is difficult to conclude that either model is superior to the other. In a real-world setting, decision makers can use the results obtained from both models to build a range for extra workforce requirements for an evacuation operation for a number of likely scenarios ranging from a worst case scenario to an average scenario to an optimistic scenario. Incorporating different quality-of-service values will enable a comprehensive sensitivity analysis, which will provide valuable information to reduce the risk of failure in case of transporting a transit-dependent population.
Different quality-of-service levels are also tested to observe the sensitivity of the models with respect to the quality-of-service pref-erences. The reason for selecting the two scenarios is that Scenario 2 assumes all the cost measures in the objective function are the same, and Scenario 1 assumes the cost for unsatisfied demand is relatively higher than the cost for drivers. Therefore, sensitivity of the models is tested for two distinctly different cost structures.
The results of the sensitivity analysis are shown in Table 2. According to Scenario 1, the results of both models are conservative
FIGURE 2 Regional characteristics and assumed hypothetical probability distributions for driver availabilities for the example problem: (a) Region 1, regular number of drivers = 200, demand for drivers during evacuation = 250; (b) Region 2, regular number of drivers = 200, demand for drivers during evacuation = 240; (c) Region 3, regular number of drivers = 300, demand for drivers during evacuation = 350; and (d) Region 4, regular number of drivers = 500, demand for drivers during evacuation = 570.
(b) Probability 120 140 160 180 200 Probability 0 .05 .1 .15 .2 Number of Drivers (c) Probability 150 200 250 300 Probability 0 .05 .1 .15 .2 Number of Drivers (a) Probability 120 140 160 180 200 Probability 0 .05 .1 .15 Number of Drivers (d) Probability 350 400 450 500 Probability 0 .05 .1 Number of Drivers
when the unsatisfied demand cost is assumed to be higher than the driver cost.
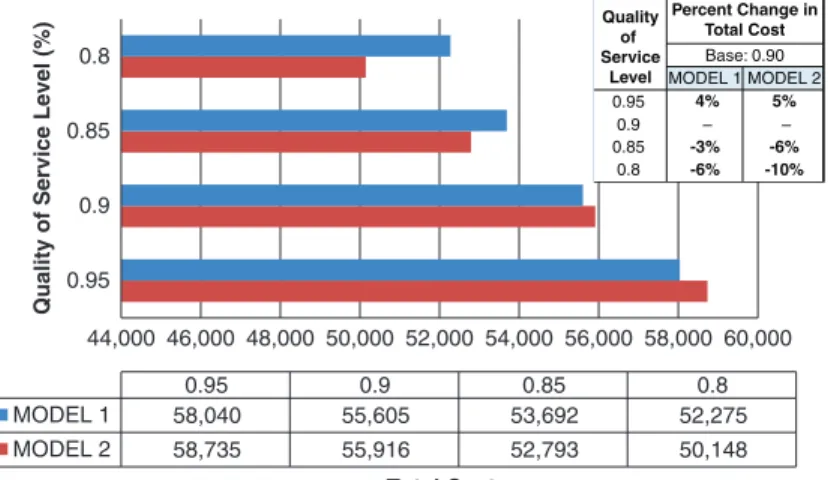
Results of Scenario 2 show more diverse results as the quality-of-service level changes. In this case, unsatisfied demand costs are assumed to be at the same level as driver costs. Figure 3 shows the changes in total costs: that Model 2 is more sensitive to the varying quality-of-service levels than Model 1.
Table 3 depicts the model results when additional constraints (budget and the number of drivers) are used. When the driver budget cap is decreased, both models try to rearrange the extraboard assign-ments and the total number of extra drivers decreases; however, total costs rise because of the increase in unsatisfied demand. Similar behavior can be seen for the constraint on the number of drivers as well. These results confirm that both models successfully reflect the possible changes in availability of physical and monetary resources for the evacuation operation.
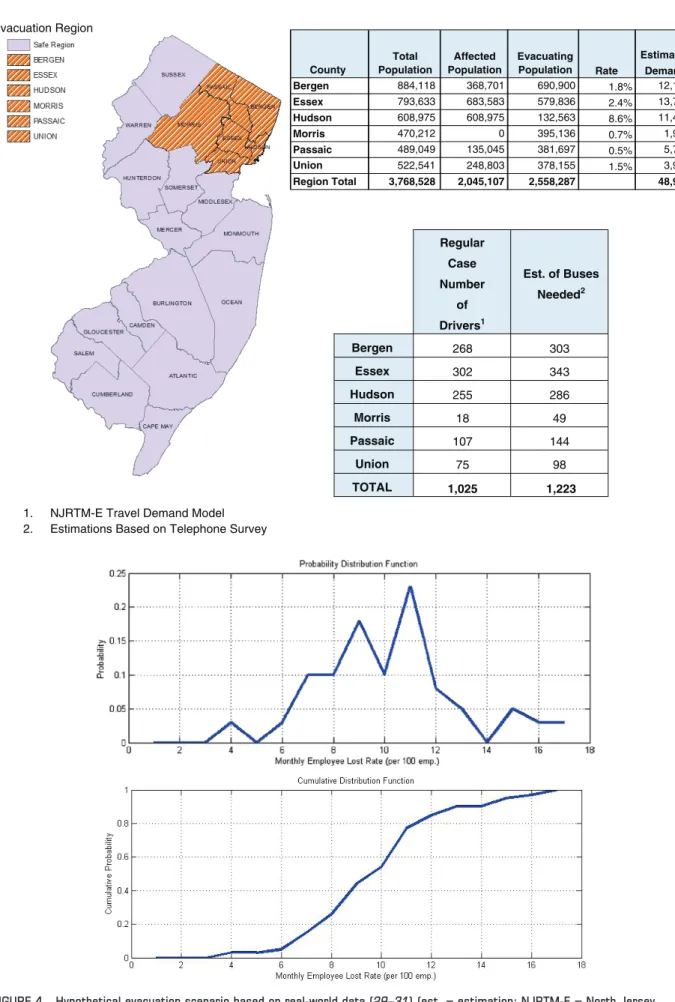
hypotheticaL scenario Based on reaL-worLd data
In this section, the developed models are tested for a hypothetical evacuation scenario in northern New Jersey. A primary reason for testing the model with data from real transit operations is to observe the interpretation of unsatisfied demand cost in the proposed models; this step can be challenging for practical applications. Therefore, in this example, the authors take the unsatisfied demand cost as unknown and try to estimate its value while taking all other parameters from real examples. New Jersey has significant transit usage, and the percentage of households that do not have access to automobiles is higher than the national average (27). This population will need to use transit in an evacuation; therefore, ensuring maintenance of adequate transit service is critical. Figure 4 shows the six New Jersey counties selected as the possible evacuation regions, evacuation TABLE 1 Scenario Definitions and Model Results
Model 1 Model 2
Scenario
Driver Costa($) Unsatisfied
Demand Cost
($) Total Cost ($)
Number of Extra Drivers
Total Cost ($)
Number of Extra Drivers
c1x c2x c3x c4x x1 x2 x3 x4 x1 x2 x3 x4 1 100 100 100 100 5,000 60,000 125 105 155 195 60,000 125 102 155 190 2 100 100 100 100 100 55,605 125 100 145 185 55,916 117 99 153 189 3 1,000 100 100 100 100 162,080 115 110 160 200 161,216 117 99 153 189 4 100 1,000 100 100 100 138,100 130 90 155 195 145,016 117 99 153 189 5 100 100 100 100 100 173,657 130 110 130 195 193,616 117 99 153 189 6 100 100 1,000 1,000 100 201,205 130 110 170 160 226,016 117 99 153 189 7 100 200 100 100 100 65,593 125 95 150 190 65,816 117 99 153 189 8 100 200 100 100 5,000 70,000 125 100 155 190 70,000 125 99 155 190 9 1,000 100 100 100 10,000 170,000 115 110 160 205 170,400 117 105 160 200 10 100 1,000 100 100 10,000 147,500 130 90 160 200 151,400 125 99 160 200 11 100 100 1,000 100 10,000 189,000 130 110 130 200 199,750 125 105 153 200 12 100 100 100 1,000 10,000 221,250 130 110 165 165 232,550 125 105 160 189 ac
1, c2, c3, and c4 are the costs for regions 1, 2, 3, and 4, respectively; x = number of extraboard drivers for each region.
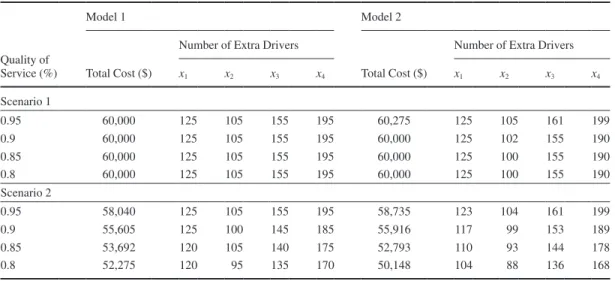
TABLE 2 Results for Different Quality-of-Service Levels
Quality of Service (%)
Model 1 Model 2
Total Cost ($)
Number of Extra Drivers
Total Cost ($)
Number of Extra Drivers
x1 x2 x3 x4 x1 x2 x3 x4 Scenario 1 0.95 60,000 125 105 155 195 60,275 125 105 161 199 0.9 60,000 125 105 155 195 60,000 125 102 155 190 0.85 60,000 125 105 155 195 60,000 125 100 155 190 0.8 60,000 125 105 155 195 60,000 125 100 155 190 Scenario 2 0.95 58,040 125 105 155 195 58,735 123 104 161 199 0.9 55,605 125 100 145 185 55,916 117 99 153 189 0.85 53,692 120 105 140 175 52,793 110 93 144 178 0.8 52,275 120 95 135 170 50,148 104 88 136 168
TABLE 3 Results for Additional Constraints
Model 1 Model 2
Value TotalCost ($)
Number of Extra Drivers
Total Cost ($)
Number of Extra Drivers
x1 x2 x3 x4 x1 x2 x3 x4
Cap on Driver Budgets
No cap 61,500 125 110 160 205 61,500 125 105 160 200 $60,000 61,500 125 110 160 205 61,500 125 105 160 200 $59,000 61,500 125 110 160 205 61,500 125 105 160 200 $58,000 62,000 125 105 155 195 62,000 125 105 155 195 $57,000 63,000 125 100 155 190 63,000 125 100 155 190 $56,000 64,750 125 100 150 185 66,000 119 99 153 189 $55,000 na — — — — na — — — —
Cap on Number of Drivers
No cap 61,500 125 110 160 205 61,500 125 105 160 200 595 61,500 125 105 160 205 61,500 125 105 160 200 590 61,500 125 105 160 200 61,500 125 105 160 200 585 61,750 125 105 155 200 61,750 125 105 155 200 580 62,000 125 105 155 195 62,000 125 105 155 195 575 62,500 125 100 155 195 62,500 125 100 155 195 570 63,000 125 100 155 190 63,000 125 100 155 190 565 63,750 125 100 150 190 64,100 124 99 153 189 560 64,750 125 100 150 185 66,000 119 99 153 189 558 65,250 125 100 148 185 67,400 117 99 153 189 555 66,000 125 100 145 185 na — — — — 550 na — — — — na — — — —
Note: na = not applicable; — = infeasible.
demand, and the number of bus drivers for regular operations and evacuation operations. Evacuation demand is determined from telephone surveys that were conducted from random samples from New Jersey. Survey results enable decision makers to examine the evacuation decision changes, possible destinations, and mode choice for different threat types. More details about this survey can be found in work by Ozbay et al. (28) and Carnegie and Deka (29). The number
of drivers required under nonemergency conditions is from the North Jersey Regional Transportation Model–Enhanced, a calibrated travel demand model developed by the North Jersey Transportation Planning Authority (30).
Realistic probability distribution for driver availability, which is given in Figure 4, is obtained from Metropolitan Transportation Authority bus employee lost time data, which are publicly available FIGURE 3 Change in total cost by quality-of-service level.
44,000 46,000 48,000 50,000 52,000 54,000 56,000 58,000 60,000 0.95 0.9 0.85 0.8 Total Cost
Quality of Service Level (%)
0.95 0.9 0.85 0.8 MODEL 1 58,040 55,605 53,692 52,275 MODEL 2 58,735 55,916 52,793 50,148 Quality of Service Level Percent Change in Total Cost 4% 5% Base: 0.90 0.95 0.9 – – 0.85 -3% -6% -6% -10% 0.8 MODEL 1 MODEL 2
Bergen 884,118 368,701 690,900 1.8% 12,121 Essex 793,633 683,583 579,836 2.4% 13,719 Hudson 608,975 608,975 132,563 8.6% 11,439 Morris 470,212 0 395,136 0.7% 1,950 Passaic 489,049 135,045 381,697 0.5% 5,764 Union 522,541 248,803 378,155 1.5% 3,915 Region Total 3,768,528 2,045,107 2,558,287 48,907 Rate Estimated Demand County Total Population Affected Population Evacuating Population
1. NJRTM-E Travel Demand Model 2. Estimations Based on Telephone Survey
Regular Case Number of Drivers1 Est. of Buses Needed2 Bergen 268 303 Essex 302 343 Hudson 255 286 Morris 18 49 Passaic 107 144 Union 75 98 TOTAL 1,025 1,223 Evacuation Region
FIGURE 4 Hypothetical evacuation scenario based on real-world data (29–31) (est. = estimation; NJRTM-E = North Jersey Regional Transportation Model–Enhanced; emp. = employees).
monthly data (http://www.mta.info/developers/) that show the num-ber of workers who did not show up for the shift they were assigned because of illness, injury, and other reasons. The data cover 4 years (2008 to 2012) and the probability distributions are estimated for the number of unavailable drivers per 100 employees (31). Metropolitan Transportation Authority buses operate in New York City, which is assumed to have similar characteristics to the study region in New Jersey.
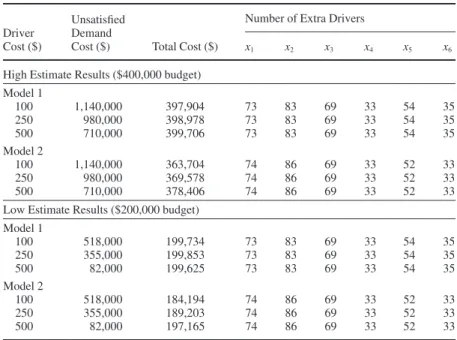
For real-world applications, quantification of unsatisfied demand costs is not straightforward and various risk measures should be taken into account. Previous literature focuses on the value of life for economic analysis (32–35), but no cost estimation study was found for the case of an emergency evacuation. A meta-analysis by Mrozek and Taylor reveals that the value-of-life estimations vary between $20,000 and $30.7 million per fatality (33). Assuming a higher value of life for a mass evacuation could cause an overestimation of the social costs. Therefore, for the selected case study, estimation for the unsatisfied demand cost is performed by using the estimated bud-get cap. The North Jersey Transportation Planning Authority annual budget was reported as $2 billion for 2011 (36). A rough estimation by Litman for the cost of total evacuation transportation for the transit-based population is given to be 20% of the annual budget of the transportation agency which equals to $400,000 for the study region (4). This amount is assumed to be the budget cap for the operations. Clearly, cost resulting from loss of life is an extreme situation used to test an upper bound. In real life, delay in transit service is expected to have less severe impacts, such as minor inconveniences or nonfatal injuries. Two different cases are considered. First, the high estimate assumes that the agency spends its entire available budget for transit operations. Second, the low estimate assumes that the agency spends half of its available budget for evacuation operations.
Model results are shown in Table 4. Driver costs are assumed to be $100, $250, and $500 per one bus run. For the high estimate, unsatisfied demand costs are found to range from $1.14 million to $710,000 and for the low estimate they range from $518,000 to $82,000 for the given models. These examples show that the unsat-isfied demand cost case is consistent with the existing value-of-life
literature reported in the meta-analysis (33). The cost associated with the loss of productivity and cost of injury can also be incorpo-rated in the same cost. Therefore, further analysis can be conducted to better explain the unsatisfied demand cost. However, value-of-life analyses in the literature also consider most of these social costs, which are difficult to monetize in a generalized way. Therefore, the findings in this paper can also be used to verify the validity of the extraboard management models.
concLusion
In this study, strategic extraboard planning and management for transit-based emergency evacuations is modeled with two stochastic optimization models developed to determine the optimum number of extra drivers. Transit evacuation models in the literature generally focus on the optimization of routing, and to the best knowledge of the research team, there are no published studies analytically combining extraboard management and evacuation modeling.
The modeling methodology used in this work tries to approach this problem from a stochastic point of view because a number of uncertain-ties exist on the supply side. Two different stochastic programming models for the risk-taking behavior of decision makers are suggested.
The proposed models are tested with a numerical example for dif-ferent cost scenarios. Model results for the case study are found to be promising for real-life applications because they allow an agency to make a reliable prediction of the need for extra drivers for evacu-ation planning under various stochastic constraints. Moreover, the models allow the use of a desired quality-of-service level that can be agency and event related. This kind of information allows for the better development of customized policies for each region. Finally, an interpretation of the unsatisfied demand cost is given, with a hypothetical evacuation scenario with real-world data. Estimations are found to be consistent with the existing value of life studies. The two components of the cost function (i.e., driver costs and unsatisfied demand costs) are useful in deciding the effect of a certain policy on the out-of-pocket agency costs as well as external costs to society as a result of possible injuries, loss of life, or both.
TABLE 4 Scenario Results
Driver Cost ($)
Unsatisfied Demand Cost ($)
Number of Extra Drivers
Total Cost ($) x1 x2 x3 x4 x5 x6
High Estimate Results ($400,000 budget) Model 1 100 1,140,000 397,904 73 83 69 33 54 35 250 980,000 398,978 73 83 69 33 54 35 500 710,000 399,706 73 83 69 33 54 35 Model 2 100 1,140,000 363,704 74 86 69 33 52 33 250 980,000 369,578 74 86 69 33 52 33 500 710,000 378,406 74 86 69 33 52 33
Low Estimate Results ($200,000 budget) Model 1 100 518,000 199,734 73 83 69 33 54 35 250 355,000 199,853 73 83 69 33 54 35 500 82,000 199,625 73 83 69 33 54 35 Model 2 100 518,000 184,194 74 86 69 33 52 33 250 355,000 189,203 74 86 69 33 52 33 500 82,000 197,165 74 86 69 33 52 33
There are currently no models and tools for decision makers to use to make informed decisions to determine the number of extraboard drivers they need to guarantee a certain level of service under emer-gency conditions. The models proposed in this paper are an attempt to address this issue and provide decision makers with a set of new reliable models. Because of the high level of uncertainty during evacuation events, stochastic models that can take into account the probabilities of a set of outcomes are developed. Proposed stochas-tic models can clearly help emergency planning by estimating the minimum number of drivers for different levels of quality of service under different demand, supply, and budget constraints. The imme-diate next step is a functionality that will allow the use of historical data for the estimation of different probability distributions required by both models. The research team also plans to implement these models in a user-friendly tool that enables users to easily create various if–then scenarios and get comparative results for quick deci-sion making. Transportation planners can use a computer applica-tion developed with the provided models and reliability preferences developed from their own historical data for several different events where extraboard management is important.
references
1. DeAnnuntis, C. P., and W. P. Morris. Transit Extraboard Management Optimum Sizing and Strategies. In Transportation Research Record:
Journal of the Transportation Research Board, No. 2072, Transporta-tion Research Board of the NaTransporta-tional Academies, Washington, D.C., 2008, pp. 110–124.
2. National Center for Transit Research, Center for Urban Transportation Research, University of South Florida. Transit Extraboard
Manage-ment: Optimum Sizing and Strategies. Final report. Florida Department of Transportation, Tallahassee, 2007.
3. Special Report 294: The Role of Transit in Emergency Evacuation. Transportation Research Board of the National Academies, Washington, D.C., 2008.
4. Litman, T. Lessons from Katrina and Rita: What Major Disasters Can Teach Transportation Planners. Journal of Transportation Engineering, Vol. 132, No. 1, 2006, pp. 11–18.
5. Jenkins, B. M., and F. Edwards-Winslow. Saving City Lifelines:
Lessons Learned in the 9-11 Terrorist Attacks. MTI Report 02-06. Mineta Transportation Institute, San Jose State University, Calif., 2003. http:// transweb.sjsu.edu/mtiportal/research/publications/documents/Sept11. book.htm. Accessed Feb. 28, 2012.
6. Naghawi, H., and B. Wolshon. Transit-Based Emergency Evacuation Simulation Modeling. Journal of Transportation Safety and Security, Vol. 2, 2010, pp. 184–201.
7. Managing Pedestrians During Evacuation of Metropolitan Areas. Publica-tion FHWA-HOP-07-066. FHWA, U.S. Department of TransportaPublica-tion, 2007.
8. MacDorman, L. C. NCTRP Synthesis of Transit Practice 5: Extraboard
Management: Procedure and Tools. TRB, National Research Council, Washington, D.C., 1985.
9. Koutsopoulos, H. N. Scheduling of Extraboard Operators in Transit Systems. Transportation Science, Vol. 24, No. 2, 1990, pp. 87–104. 10. Shiftan, Y., and N. H. M. Wilson. Absence, Overtime, and Reliability
Relationships in Transit Workforce Planning. Transportation Research
Part A: Policy and Practice, Vol. 28, No. 3, 1994, pp. 245–258. 11. Shiftan, Y., and N. H. M. Wilson. Public Transport Workforce Sizing
Rec-ognizing the Service Reliability Objective. In Computer-Aided Scheduling
of Public Transport, Springer-Verlag, Berlin, 1995, pp. 248–266. 12. Bish, D. Planning for a Bus-Based Evacuation. OR Spectrum, Vol. 33,
No. 3, 2011, pp. 629–654.
13. Sayyady, F., and S. D. Eksioglu. Optimizing the Use of Public Transit System During No-Notice Evacuation of Urban Areas. Computers and
Industrial Engineering, Vol. 59, No. 4, 2010, pp. 488–495.
14. Prekopa, A., B. Vizvari, and T. Badics. Programming Under Probabilistic Constraint with Discrete Random Variables. In New Trends in
Mathemati-cal Programming (F. Giannessi and T. Rapcsak, eds.), Kluwer Academic Publishers, Dordrecht, Netherlands, 1998, pp. 235–257.
15. Yazici, M. A., and K. Ozbay. Impact on Probabilistic Road Capacity Constraints on the Spatial Distribution of Hurricane Evacuation Shelter Capacities. In Transportation Research Record: Journal of the
Transpor-tation Research Board, No. 2022, Transportation Research Board of the National Academies, Washington, D.C., 2007, pp. 55–62.
16. Yazici, A., and K. Ozbay. Evacuation Network Modeling via Dynamic Traffic Assignment with Probabilistic Demand and Capacity Constraints. In Transportation Research Record: Journal of the Transportation
Research Board, No. 2196, Transportation Research Board of the
National Academies, Washington, D.C., 2010, pp. 11–20.
17. Ozguven, E. E., and K. Ozbay. A Secure and Efficient Inventory Man-agement System for Disasters. Transportation Research Part C: Emerging
Technologies, Vol. 29, April 2013, pp. 171–196.
18. Prekopa, A. Dual Method for a One-Stage Stochastic Programming Problem with Random RHS Obeying a Discrete Probability Distribution.
Mathematical Methods of Operations Research, Vol. 34, No. 6, 1990, pp. 441–461.
19. Dentcheva, D., P. Prekopa, and A. Ruszczynski. Concavity and Efficient Points of Discrete Distributions in Probabilistic Programming.
Math-ematical Programming, Vol. 89, No. 1, 2000, pp. 55–77.
20. Hun Seog, S. The Economics of Risk and Insurance. John Wiley and Sons, New York, 2010.
21. Muller, A., and D. Stoyan. Comparison Methods for Stochastic Models
and Risks. Wiley Series in Probability and Statistics. John Wiley and Sons, New York, 2002.
22. Nie, Y., X. Wu, and T. Homen-de-Mello. Optimal Path Problems with Second-Order Stochastic Dominance Constraints. Networks and Spatial
Economics, No. 12, 2012, pp. 561–587.
23. Dentcheva, D., and A. Ruszczynski. Optimization with Stochastic Dominance Constraints. SIAM Journal on Optimization, Vol. 14, No. 2, 2003, pp. 548–566.
24. Dentcheva, D., and A. Ruszczynski. Optimality and Duality Theory for Stochastic Optimization Problems with Nonlinear Dominance Con-straints. Mathematical Programming, Vol. 99, 2004, pp. 329–350. 25. Noyan, N. Alternate Risk Measures for Emergency Medical Service
System Design. Annals of Operations Research, Vol. 181, No. 1, 2010, pp. 559–589.
26. Luedtke, J. New Formulations for Optimization under Stochastic Domi-nance Constraints. SIAM Journal on Optimization, Vol. 19, No. 3, 2008, pp. 1433–1450.
27. Bureau of Transportation Statistics, U.S. Department of Transportation. National Household Survey. http://www.bts.gov/programs/national_ household_travel_survey/. Accessed June 28, 2012.
28. Ozbay, K., M. A. Yazici, S. Iyer, J. Li, E. E. Ozguven, and J. A. Carnegie. Use of Regional Transportation Planning Tool for Modeling Emergency Evacuation: Case Study of Northern New Jersey. In Transportation
Research Record: Journal of the Transportation Research Board, No. 2312,
Transportation Research Board of the National Academies, Washington, D.C., 2012, pp. 89–97.
29. Carnegie, J., and D. Deka. Using Hypothetical Disaster Scenarios to Predict Evacuation Behavioral Response. Presented at 89th Annual Meeting of the Transportation Research Board, Washington, D.C., 2010. 30. North Jersey Transportation Planning Authority. North Jersey Regional
Transportation Model-Enhanced (NJRTM-E). 2012. http://www.njtpa. org/DataMap/Perf/Model/default.aspx. Accessed Nov. 15, 2012. 31. Metropolitan Transportation Authority, New York. Bus Employee Lost
Time Data, 2012. http://www.mta.info/developers/. Accessed Jan. 8, 2012. 32. Viscusi, W. The Value of Life: Estimates with Risks by Occupation and
Industry. Discussion Paper 422. Harvard Law School, Cambridge,
Mass., 2003. http://www.law.harvard.edu/programs/olin_center/. Accessed Nov. 13, 2012.
33. Mrozek, J. R., and L. Taylor. What Determines the Value of Life? A Meta Analysis. Journal of Policy Analysis and Management, Vol. 21, No. 2, 2002, pp. 253–270.
34. Blomquist, G. Value of Life Saving: Implications of Consumption Activity. Journal of Political Economy, Vol. 87, No. 31, 1979, pp. 540–558. 35. Blaeij, A., R. Florax, P. Rietveld, and E. Verhoef. The Value of Statistical
Life in Road Safety, A Meta-Analysis. Accident Analysis and Prevention, Vol. 35, 2003, pp. 973–986.
36. Unified Planning Work Program: Budget Book Year 2 Update. North Jersey Transportation Planning Authority, Newark, 2011. http://www. njtpa.org/About/Business/documents/FY2012_UPWP_Budget_000.pdf. Accessed July 24, 2012.