SOIL CORROSION PROTECTION BY NICKEL ELECTROPLATING
1Ebru SARALOĞLU GÜLER
1Baskent University, Faculty of Engineering, Department of Mechanical Engineering, 06790 Ankara, TURKEY
(Geliş/Received: 18.02.2019; Kabul/Accepted in Revised Form: 08.05.2019)
ABSTRACT: The corrosion exposure of steels is a common case. The aim of this study is to decrease corrosion rate in soil that is especially critical in submerged steel pipes by nickel electroplating. Nickel electroplating is conducted at two current densities of 1.5 A/dm2 and 4 A/dm2. It is revealed that the hardness values of the steels that are plated at low current density (1.5 A/dm2) are higher than that of the ones that are plated at high current density (4 A/dm2). The soil corrosion tests were carried out with the electroplated specimens at 1.5 A/dm2 to preserve the hardness. Both electroplated and un-plated steel specimens were hold for 624 hours in the soil solution prepared in the laboratory. The soil corrosion behavior of nickel electroplated steels has not been studied in literature. The cell potentials are measured by using Cu-CuSO4 reference electrode. The corrosion rates for the un-plated and plated specimens are calculated 5.7 and 1.4 µm/year, respectively. Electroplating the pipes and measuring pipe to soil potentials in situ applications can be suggested for future research.
Key Words: Corrosion, Electroplating, Hardness, Vickers indentation, Pipe to soil potential.
Nikel Elektro Kaplama ile Toprak Korozyonuna Karşı Koruma
ÖZ: Çeliklerin korozyona uğraması yaygın bir durumdur. Bu çalışmanın amacı, özellikle gömülü çelik borularda kritik olan korozyon hızının nikel elektro kaplama ile azaltılmasıdır. Nikel kaplama, 1.5 A/dm2 ve 4 A/dm2 olmak üzere iki akım yoğunluğunda yapılmıştır. Düşük akım yoğunluğunda (1.5 A/dm2) kaplanan çeliklerin sertlik değerleri yüksek akım yoğunluğunda (4 A/dm2) kaplananlarınkinden daha yüksektir. Elektro kaplanmış ve kaplanmamış numunelerin ikisi de laboratuvarda hazırlanan bir toprak çözeltisinde 624 saat bekletilmiştir. Nikel kaplanmış çeliklerin topraktaki korozyon davranışları literatürde çalışılmamıştır. Hücre potansiyelleri Cu-CuSO4 referans elektrot kullanarak ölçülmüştür. Kaplanmamış ve kaplanmış numunelerin korozyon hızları sırasıyla 5.7 ve 1.4 µm/yıl olarak hesaplanmıştır. Boruları elektro kaplama ve borudan toprağa potansiyelleri yerinde ölçme uygulamaları gelecek çalışmalar için önerilebilir.
Anahtar Kelimeler: Korozyon, Elekto kaplama, Sertlik, Vickers indentasyon, Boru toprak potansiyeli.
INTRODUCTION
The corrosion of buried steel pipes is a well-known problem. There are several methods to protect steels from corrosion. The main prevention methods are covering, coating the steel pipe, sacrificing other anodes like magnesium, applying electrical potential that will reverse the flow of current from the pipe. Despite using sacrificial Mg anode is effective, this method is not economical. Bituminous coatings are economical way to protect steel pipes but this time continuity and water adsorption problems arise that led to cracking and flow under pressure (“Underground Corrosion Part 2: Behaviour of Protective Coatings in Soils,” 1958).
There are many methods for coating such as hot dip, chemical vapor deposition, physical vapor deposition, sputtering and electrochemical deposition (Davis, 2001). Vapor deposition is more expensive than electroplating. Moreover, amorphous like interfaces can be revealed by vapor deposition techniques and it is the most time consuming process among other deposition techniques (Paunovic & Schlesinger, 2006). In addition, sputtering requires a vacuum system that increases the cost of the process (Nguyen & Wereley, 2013; Paunovic & Schlesinger, 2006). The electrochemical deposition comes into prominence due to its advantages.Various electroplating materials were studied to observe the effect on the corrosion rate in different mediums. Nickel and nickel alloys are preferred to deposit on surfaces in order to achieve improved corrosion and wear resistance (Schlesinger & Paunovic, 2010). The alloys studied and their test mediums are nickel-cobalt alloy electroplating in NaCl solution (Vaezi, Sadrnezhaad, & Nikzad, 2008), nickel electroplating in supercritical CO2 fluid at atmospheric pressure (Benea, Bonora, Borello, & Martelli, 2001), Ni-SiC composite electroplating in 0.5 M NaCl (Vaezi et al., 2008) and in 0.5 M Na2SO4 (Benea et al., 2001), Ni-Al2O3 coating in 0.5 M solution of Na2SO4 (Szczygieł & Kołodziej, 2005). Soil corrosion comes forward when the corrosion of the buried steel pipe is considered. The main parameters in the soil that determine corrosion rate of the buried steel pipes are the content of the moisture and dissolved salts that determine the conductivity (Davis, 2001). In addition, the degree of aeration and pH of the soil can also be listed (Baboian, 2005). Even stainless steels suffer from the high acidity (low pH) and chloride of the soil (Baboian, 2005). Soil samples can be both obtained from a specific location originally or prepared in laboratory during soil corrosion tests (“G 162 Standard Practice for Conducting and Evaluating Laboratory Corrosions Tests in Soils,” 1999). The major constituents in the original soils are K+, Na+, Ca2+, Mg2+, Cl-, NO3-, SO42- [10]. The reagents that present in the simulated soil solutions are KCl, NaHCO3, CaCl2.2H2O, MgSO4.7H2O (Antunes de Sena, Bastos, & Platt, 2012).
The effect of corrosion protection of the coated sample can be revealed by corrosion tests. The tests can be conducted in outdoor applications, field tests or in the laboratory, accelerated tests like salt spray tests, electrochemical tests (Davis, 2001). Potentiodynamic polarization technique is the most common method among electrochemical tests (Benea et al., 2001; Vaezi et al., 2008). In addition, the degree of the corrosion in a buried steel pipe in soil is determined by measuring the pipe to soil potential (Ahmad, 2006).
In this study, the corrosion behavior of the nickel electroplated steel in soil was studied since there has not been any investigation regarding this. In addition, different electrochemical method was used by measuring the pipe to soil potential. The experiments were conducted in the laboratory but the method can easily be used in situ applications.
EXPERIMENTAL PROCEDURE Nickel electroplating
Nickel electroplating was performed in an electroplating cell consisting of the steel that will be plated, nickel anode, conducting cables plugged to power source. The nickel electroplating process was conducted at two current densities, 1.5 A/dm2 and 4 A/dm2 but the thickness of the coating was kept constant at 10µm. The specimens were hold for 34 and 13 minutes in the electroplating bath when the current densities were set to 1.5 A/dm2 and 4 A/dm2 respectively (Davis, 2000; Paunovic & Schlesinger, 2006). The nickel plating medium was Watts bath that includes 300 g nickel sulfate, 60 g nickel chloride and 40 g boric acid in 1-liter water. In addition, additives were incorporated such as 10 g carrier, 4 g leveler, 1 g wetting agent and 1.1 g brightener. Wetting agents were added to hinder trapped air and hydrogen bubbles in the coating (Davis, 2000). The aim of the leveler addition was to obtain smoother surfaces (Davis, 2000).
Hardness
The specimens were subjected to hardness tests after electroplating. The hardness of the un-plated steel specimen was also recorded in the same conditions to make a comparison. Micro hardness measurements were carried out by nano-micro mechanic test device to measure the coating thickness. Nano indenter was chosen to hinder the indenter to pass through the coating to the matrix. The load range of the nano-indenter was 0.1mN – 400mN that correspond to minimum and maximum depth, respectively. Three hardness values were obtained from each specimen. The representative average values were calculated.
Laboratory soil preparation
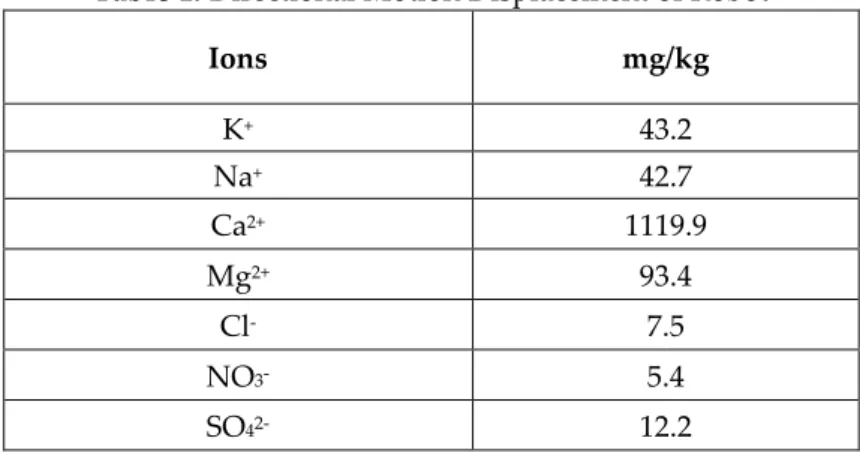
Soil resistivity (ohm-cm) is inversely proportional with the corrosion rate since it expresses the ability of Fe ions to travel from the corrosion spot (Chaker & Palmer, 1989; Fu et al., 2013) Increase in the soil resistivity increases the pipe to soil potential (Baboian, 2005). Therefore, soil type is a very important parameter that has to be considered. For instance, despite the chloride ion which is a constituent of soil makes the effect on the corrosion rate difficult to analyze, the humidity of the soil has an increasing effect on the corrosion rate (White, 1992). Moreover, pH of the soil is another important criterion. It can be concluded that decrease in the pH value has an increasing effect on the corrosion rate (Chaker & Palmer, 1989). In this study, the soil was kept constant to eliminate the effects of soil properties and the soil constituents used in the experiment (Table 1) were determined (Fan et al., 2011). Four types of original soil samples were analyzed and their constituents, pH values, humidity levels, conductivities were listed in the research (Fan et al., 2011). The one with the highest humidity to have increased rate of corrosion that has a resistivity of 314.5 Ω.m is chosen among these soil types (Fan et al., 2011). Glass container for the soil was used to be resistant to the soil environment (“G 162 Standard Practice for Conducting and Evaluating Laboratory Corrosions Tests in Soils,” 1999). The test was carried out at room temperature since the effect of the temperature is not studied (“G 162 Standard Practice for Conducting and Evaluating Laboratory Corrosions Tests in Soils,” 1999).
Table 1. Directional Motion Displacement of Robot
Ions mg/kg K+ 43.2 Na+ 42.7 Ca2+ 1119.9 Mg2+ 93.4 Cl- 7.5 NO3- 5.4 SO42- 12.2 Corrosion rate
Both of the un-plated and the electroplated specimens (1.5 A/dm2) connected to a reference electrode were buried in the prepared soil for 26 days. The potential was measured against a reference half-cell and the data can be used to obtain corrosion rate according to Faraday’s Law assuming that all the current that passes through the system is due to the corrosion (“G 162 Standard Practice for Conducting and Evaluating Laboratory Corrosions Tests in Soils,” 1999). The measurements were conducted by connecting the negative end of the voltammeter to the steel pipe and the positive end to the reference
electrode that is Cu- CuSO4 half cell (Ahmad, 2006). The connection of the system that was used in this experiment is in Figure1.
Figure 1.The connection of the Cu-CuSO4 reference electrode and steel specimen to the voltammeter The oxidation and the reduction reactions that occur at the anode and the cathode, respectively and the half-cell potentials are given in Table 2 (Stansbury & Buchanan, 2000). The cell potential is the summation of the two half cells which is -0.78V for the cell reaction.
Table 2.Standard aqueous half-cell potentials (Stansbury & Buchanan, 2000) Electrode Reaction E0 (V) Oxidation / Reduction Electrode Reaction E0 (V) Fe Fe+2 + 2e- - 0.44 Anode Fe Fe+2 + 2e- - 0.44 Cu Cu+2 + 2e- 0.34 Cathode Cu Cu+2 + 2e- 0.34
Another way to detect the corrosion rate is measuring the mass loss during the exposure time that can be related to the corrosion rate. According to ASTM G1-03 corrosion rate equation is given by the below equation (“G1-03 Standard Practice for Preparing, Cleaning, and Evaluating Corrosion Test Specimens,” 2011).
(“G1-03 Standard Practice for Preparing, Cleaning, and Evaluating Corrosion Test Specimens,” 2011) where:
K: a constant = µm/year (micrometers per year) : mass loss (g)
A: area (cm2)
t: time of exposure (hours) D: density = 8.92 g/cm3 RESULTS AND DISCUSSION Nickel electroplating
The microstructures of the nickel electroplated steels at two current densities, 1.5 A/dm2 and 4 A/dm2 are given in Figure 2, respectively. The specimens were prepared with Metcon grinder, polisher
and mounting press prior to the etching process by nital (100mL ethanol + 8mL nitric acid). According to Figure 2.a, the coating thickness is almost 10 µm as expected however the deposit thickness is a little bit less than 10 µm in Figure 2.b. This may stem from the difference between throwing powers. It is known that throwing power is increased by ~%38 when the current density is decreased from 4 to 1 A/dm2 in various plating solutions (Schlesinger & Paunovic, 2010).
Figure 2. Optical micrographs of the nickel electroplated specimens at current densities of a. 1.5 A/dm2b. 4 A/dm2
Hardness
As it can be seen, nickel plating has a decreasing effect on the hardness of the steel (Table 3). The hardness values for semi bright and commercial bright nickel deposits have hardness values of 300 HV and 600 HV respectively (Dennis & Such, 1986). The hardness can be controlled by the electroplating parameters (Dennis & Such, 1986). Current density value at which the electroplating carried on is one of the parameters that affect the hardness of the deposit. In addition, the hardness values decrease with an increase in the current density of the electroplating at room temperature (Banovic, Barmak, & Marder, 1998; Dennis & Such, 1986). It was observed that the increase in the current density leads to a decrease in the hardness also in composite coatings (Bahrololoom & Sani, 2005). Table 3 shows that when the plating current density decreased from 4 to 1.5 A/dm2, the average hardness values increased 481.47 HV to 548.02 HV. The hardness of the underground steel pipes is preferred to be high so the corrosion experiment was continued with the specimen electroplated at 1.5 A/dm2.
Table 3.Vickers nano hardness values of the un-plated and the plated specimens at 1.5 and 4 A/dm2 current densities
Measurements Un-plated (HV) Plated at 1.5 A/dm2 (HV) Plated at 4 A/dm2 (HV)
1 616.72 550.23 415.27
2 665.63 550.23 521.38
3 604.65 546.80 507.78
Average 629.00 548.02 481.47
Pipe to soil potential
The potential of the steel pipe to a copper sulphate reference electrode is measured as 0.76 V in unplated and 0.58 V in the plated specimen (Table 4). The reading of the voltammeter must be 0.78 V theoretically according to the above calculations. There is a decrease in the cell potential when the steel
25μ m
25μ m
is electroplated. The drop in the voltage stems from the difficulty of the current to flow meaning that the corrosion is diminished.
In addition, the potential values of the ferrous pipe respect to copper sulphate reference electrode measured in different soils which have low (500-1000 ohm-cm), medium (1000-10000 ohm-cm) and high resistivity (10000-100000 ohm-cm) (Calhoun, 1962). It is found that when the measured voltages (negative) are nearly 0.5 – 0.6 V, the medium is called mildly corrosive however when the voltage values increase up to 0.6 V or higher, the medium is noted as corrosive in the soil that has medium resistivity (Calhoun, 1962). Therefore, it can be concluded that the corrosivity is decreased by electroplating. The model that gives the relation between corrosion rate and voltage measurements is developed in the regression analysis part.
Table 4. The voltammeter readings in the system for electroplated and un-plated steel specimens Specimen Voltammeter reading (V)
Un-plated -0.76
Electroplated -0.58
Corrosion rate
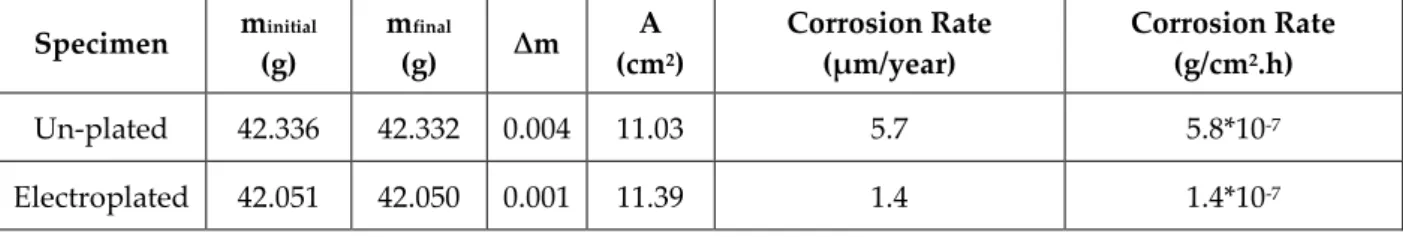
The mass loss ( ) and the calculated corrosion rates for both nickel electroplated at 1.5 A/dm2 and un-plated steel specimens for 26 days (624 hours) exposure time are given in Table 5. Nickel electroplating decreased the corrosion rate from 5.7 to 1.4 µm /year. This result revealed that the effect of nickel electroplating on the corrosion protection. According to the study of Barbalat et. al., the corrosion rate under cathodic protection was measured ~10 µm/year when the exposed time was 34 days (Barbalat et al., 2012). The difference may stem from the high Cl- content (11.7 mg/l) of the soil in the study of Barbalat et. al. which is an important parameter that increases the corrosivity of the soil (Barbalat et al., 2012). Moreover, it was found that carbon steel has a corrosion rate that is higher than 10 µm/year whereas copper clad steel lower than 5 µm/year after 30 days in the soil that has a Cl- content of 8.72 mg/l and pH of 7.87 (Fan et al., 2011). The pH of the prepared soil is measured as 6 in this study. It is stated that the pH values for most of the soils are in the range of 5 – 8 generally that led to decrease in the soil reaction caused by pH and it is concluded that other factors have the important effect on the corrosion rate (Smith, 1981). The corrosion rate for the galvanized steel which is calculated as 7.4*10-10 g/cm2.h in the study of Fu et. al. (Fu et al., 2013), is smaller than the corrosion rate that is calculated as 1.4*10-7 g/cm2.h in this study. One cannot jump into the conclusion that galvanization is a better method for the protection of steel from soil corrosion than nickel coating. Because, the difference may also stem from the high resistivity of the soil which is equal to 579.6 Ω.m in the study of Fu et. al (Fu et al., 2013). Therefore, healthy comparison of the corrosion rate cannot be done unless the soil resistivity values are equal.
Table 5.The corrosion rates for electroplated and un-plated steel specimens Specimen minitial (g) mfinal (g) ∆m A (cm2) Corrosion Rate (µm/year) Corrosion Rate (g/cm2.h) Un-plated 42.336 42.332 0.004 11.03 5.7 5.8*10-7 Electroplated 42.051 42.050 0.001 11.39 1.4 1.4*10-7
Regression analysis
Simple linear regression analysis was applied to obtain a model that estimates the relation between pipet to soil potential and corrosion rate. Table 6 shows the dependent (y) and independent variables (x) that are corrosion rates calculated from the mass differences and the corresponding measurements for pipe to soil potentials, respectively. The linear regression model is given in equations 1, 2 and 3 consisting of intercept, b0; slope, b1 and error, e (Montgomery, Peck, & Vining, 2012). An error can be calculated by the least square method that must be minimized for the model work (Montgomery et al., 2012). Table 7 shows the calculated values for the coefficients and the error. Since the error is minimized the linear regression equation can be simply written as in Equation 5. In this experiment, the data was controllable but when data is huge then statistical programs may be used to obtain regression analysis.
Table 6. Dependent (Y) and independent variables (X) of the model
Y: Dependent (corrosion rate, µm/year) X: Independent (pipe to soil potential, V)
5.7 0.76 1.4 0.58 Equation 1 Equation 2 Equation 3 Equation 4 Equation 5 CONCLUSION
The hardness of the steel preserved when it is electroplated at 1.5 A/dm2. Higher current density decreased hardness. The corrosion rate of the steel specimens in the prepared soil is nearly four times higher than the electroplated specimens. It can be concluded that nickel electroplating is an effective way to protect buried pipes in soil. The linear regression model gives the relation between cell potential and corrosion rate.
REFERENCES
Ahmad, Z., (2006),Principles of Corrosion Engineering and Corrosion Control. Elsevier Ltd. , 1–656. Antunes de Sena, R., Bastos, I. N., & Platt, G., (2012),"Theoretical and Experimental Aspects of the
Corrosivity of Simulated Soil Solutions",ISRN Chemical Engineering, 2012, 1–6.
Baboian, R., (2005),"Corrosion Tests and Standards: Application and Interpretation",ASTM International. Bahrololoom, M. E., & Sani, R., (2005),"The influence of pulse plating parameters on the hardness and wear resistance of nickel-alumina composite coatings",Surface and Coatings Technology, 192,No.2–3, 154–163.
Banovic, S. W., Barmak, K., & Marder, A. R., (1998),"Microstructural Characterization and Hardness of Electrodeposited Nickel Coatings from a Sulphamate Bath",Journal of Materials Science, 33, 639–645.
Barbalat, M., Lanarde, L., Caron, D., Meyer, M., Vittonato, J., Castillon, F., Refait, P., (2012),"Electrochemical study of the corrosion rate of carbon steel in soil: Evolution with time and determination of residual corrosion rates under cathodic protection",Corrosion Science, 55, 246–253.
Benea, L., Bonora, P. L., Borello, A., & Martelli, S., (2001),"Wear corrosion properties of nano-structured SiC-nickel composite coatings obtained by electroplating",Wear, 249,No.10–11, 995–1003. Calhoun, C. M., (1962),"Preliminary Fields Survey of Underground Corrosion",Underground corrosion,
cathodic protection, and required field measurements.
Chaker, V., & Palmer, J. D., (1989),"Effects of soil characteristics on corrosion". Davis, J. R., (2000),"Nickel, Cobalt, and Their Alloys",ASM International.
Davis, J. R., (2001),Surface Engineering for Corrosion and Wear Resistance. Ohio: ASM International. Dennis, J. K., & Such, T. E., (1986),Nickel and Chromium Plating,Butterworth & Jo. England.
Fan, X., Wang, J., Zhou, M., Huang, S., Wang, Y., & Dou, P., (2011),"Laboratory soil corrosion test of steel grounding materials",7th Asia-Pacific International Conference on Lightning, 706–710.
Fu, J., Pei, F., Zhu, Z., Tan, Z., Tian, X., Mao, R., & Wang, L., (2013),"Influence of moisture on corrosion behaviour of steel ground rods in mildly desertified soil",Anti-Corrosion Methods and Materials, 60,No.3, 148–152.
G 162 Standard Practice for Conducting and Evaluating Laboratory Corrosions Tests in Soils, (1999),Annual Book of ASTM Standards, 1–4.
G1-03 Standard Practice for Preparing, Cleaning, and Evaluating Corrosion Test Specimens, (2011),Annual Book of ASTM Standards, 1–9.
Montgomery, D. C., Peck, E. A., & Vining, G. G., (2012),Introduction to Linear Regression Analysis. New Jersey: John Wiley & Sons.
Nguyen, N., & Wereley, S. T., (2013),"Fundamentals and applications of microfluidics",Journal of Chemical Information and Modeling, 53,No.9, 1689–1699.
Paunovic, M., & Schlesinger, M., (2006),Fundamentals of Deposition. United States of America: John Wiley & Sons, Inc.
Schlesinger, M., & Paunovic, M., (2010),Modern Electroplating. New Jersey: John Wiley & Sons, Inc. Smith, C. A., (1981),"Soil in the Corrosion Process",Anti-Corrosion Methods and Materials, 28,No.2, 4–8. Stansbury, E. E., & Buchanan, R. A., (2000),"Fundamentals of Electrochemical Corrosion - Ele Eugene
Stansbury, Robert Angus Buchanan - Google Books",ASM International.
Szczygieł, B., & Kołodziej, M., (2005),"Composite Ni/Al2O3 coatings and their corrosion resistance",Electrochimica Acta, 50,No.20, 4188–4195.
Underground Corrosion Part 2: Behaviour of Protective Coatings in Soils", (1958),Anti-Corrosion Methods and Materials, 5,No.2, 45–56.
Vaezi, M. R., Sadrnezhaad, S. K., & Nikzad, L., (2008),"Electrodeposition of Ni-SiC nano-composite coatings and evaluation of wear and corrosion resistance and electroplating characteristics",Colloids and Surfaces A: Physicochemical and Engineering Aspects, 315,No.1– 3, 176–182.
White, B. S., (1992),"Influence of Humidity on Corrosion Rate",Anti-Corrosion Methods and Materials, 39,No.8, 1–4.