Smelling in Chemically Complex Environments: An Opto
fluidic Bragg
Fiber Array for Di
fferentiation of Methanol Adulterated Beverages
Adem Yildirim,
†,§Fahri Emre Ozturk,
†,§and Mehmet Bayindir*
,†,‡†UNAM-National Nanotechnology Research Center and Institute of Materials Science and Nanotechnology and‡Department of
Physics, Bilkent University, 06800 Ankara, Turkey
*
S Supporting InformationABSTRACT: A novel optoelectronic nose for analysis of alcohols (ethanol and methanol) in chemically complex environments is reported. The cross-responsive sensing unit of the optoelectronic nose is an array of three distinct hollow-core infrared transmitting photonic band gapfibers, which transmit a specific band of IR light depending on their Bragg mirror structures. The presence of alcohol molecules in the optofluidic core quenches the fiber transmissions if there is an absorption band of the analyte overlapping with the transmission band of the fiber; otherwise they remain unchanged. The cumulative response data of the fiber array enables rapid, reversible, and accurate discrimination of alcohols in chemically complex backgrounds such as
beer and fruit juice. In addition, we observed that humidity of the environment has no effect on the response matrix of the optoelectronic nose, which is rarely achieved in gas-sensing applications. Consequently, it can be reliably used in virtually any environment without precalibration for humidity or drying the analytes. Besides the discussed application in counterfeit alcoholic beverages, with its superior sensor parameters, this novel concept proves to be a promising contender for many other applications including food quality control, environmental monitoring, and breath analysis for disease diagnostics.
A
nalysis of deleterious chemical substances in end-user products (complex environments containing several diverse components) is of great interest in food, biomedical, and chemical industries in terms of quality control and public health.1,2The most common analytical methods to discriminate chemicals in complex environments are spectroscopic techni-ques, often coupled with chromatographic methods, such as gas chromatography/mass spectroscopy (GC/MS). Although such methods ensure high sensitivity, they are usually unable to differentiate similar chemicals in mixtures.3 Also, they are expensive, labor intensive, time-consuming, and not portable. Therefore, rapid, cost-effective, and portable sensors with good sensitivity and selectivity are highly demanded for in situ analysis of chemicals in complex environments.A promising way to detect a single chemical in complex mixtures or to differentiate similar mixtures from each other is to use array-based sensors, so-called artificial noses.4−9 Initial artificial noses utilize mostly electrical10−14 (e.g., metal oxide and polymer semiconductor arrays) and mechanical trans-ducing elements15−18 [e.g., differently functionalized micro-cantilevers and quartz crystal microbalance (QCM) and surface acoustic wave (SAW) sensors]. In these schemes, electrical or mechanical properties of each sensor element shift as a response to sorbed chemical species. Ever since the first prototypes, the design parts of electronic noses have barely changed; electronic noses invariably comprise an array of broadly responsive sensing elements, coupled with a pattern recognition software to sort out the recorded half-fuzzy data for the precise yet ephemeral smell information. More recently, optical smelling gadgets (i.e., optoelectronic noses) have also
arisen, incorporatingfluorescent dye-coated optical fibers,19−21 colorimetric dyes,22−24 or mesoporous Bragg mirrorarrays.2,25 These methods detect odorants based on changes in an optical property (e.g.,fluorescence, refractive index, or absorbance) of an active layer (e.g., dye-doped polymers). Optical transducing schemes enabled production of more compact artificial noses with low power consumption. Also, they have been successfully applied for discrimination of complex mixtures such as coffee aromas and soft drinks.1,26However, their response and signal regeneration (recovery) times are relatively long because the analytes mustfirst diffuse into the active layer and then desorb to the environment for each measurement. In addition, once the analytes diffuse into the active layer, they can irreversibly change the properties of the layer, which constrains their reusability.
Recently, we have developed a distinct optoelectronic nose concept using hollow-core photonic band gap (PBG) infrared-transmittingfiber array.27In this design, analytes are detected through their infrared absorption in microfluidic channels of thefibers, which enables direct smelling of the odors, without the need of an active layer. Thus, with such an optofluidic28 approach, odors can be detected and response signal can be generated in less than a second without any baseline drift of the initial signal. The fibers are produced by thermal drawing method29,30and can guide a specified spectral band of infrared
Received: March 17, 2013 Accepted: June 10, 2013 Published: June 10, 2013
light, which is determined by their Bragg structure. In our previous works,27,31 we showed that, by use of this novel concept, a large number of chemicals can be selectively and sensitively identified from vapors of pure analytes.
In this work, we demonstrate that the optoelectronic nose can also successfully operate in complex chemical environ-ments, in addition to pure analyte environments. For this purpose, we tested solutions of two very similar chemicals (ethanol and methanol) in complex environments (beer and fruit juice) with the optoelectronic nose. The discrimination of these two resembling alcohols from each other is particularly important to detect falsified alcoholic beverages, in which methanol is used instead of ethanol. While methanol is cheaper than ethanol, it is very toxic to humans; ingestion of as little as 10 mL can cause blindness, and an amount of 30 mL can be fatal.32In order to detect toxic methanol-containing alcoholic beverages, we prepared an optoelectronic nose using three optofluidic PBG fibers, which have different spectral positions in the infrared region. The spectral positions of thefibers were determined according to Fourier transform infrared (FT-IR) spectra of ethanol and methanol, to match their absorption bands with the fiber transmissions. Initially, we tested the optoelectronic nose on binary and ternary mixtures of ethanol, methanol, and water, and it was observed that the optoelectronic nose can rapidly (in a few seconds) and reversibly discriminate ternary mixtures even at low alcohol concentrations. Typically, it is very challenging for electronic noses to smell in highly humid environments because water can strongly interact with most types of sensor elements (e.g., metal oxide and conjugated polymer sensors) and largely block the signal obtained from the analytes.33Therefore, before measure-ments, analytes must be dried in some manner. On the other hand, the optoelectronic nose can directly analyze the alcohols even in 100% humidity since water vapor does not have any absorption band that overlaps with the transmission bands of thefibers; therefore, water does not affect the IR transmission of fibers (sensor response). Finally, we showed that the optoelectronic nose can discriminate methanol-containing (falsified) beverages from ethanol-containing beverages with nonalcoholic beer and mixed fruit juice as complex back-grounds.
■
MATERIALS AND METHODSMaterials. Ethanol and methanol were purchased from Merck (Germany) and Carlo-Erba (Italy), respectively. Non-alcoholic beer and canned mixed fruit juice was purchased from a local market. All materials were used as received.
Fiber Fabrication. Hollow-core photonic band gap fibers utilize in-fiber dielectric mirrors; they are periodically layered structures of varying thickness and refractive indices. These structures are produced so that they obey the quarter wave stack (QWS) equation for omnidirectional reflection at the desired wavelength.34Fibers used in this study have dielectric mirror layers of poly(ether sulfone) (PES) and chalcogenide glass (As2Se3). First, both sides of PESfilms were coated with
chalcogenide glass by a thermal evaporation technique. Control over PES and chalcogenide thickness is necessary at this stage for the final structure to obey the QWS equation for omnidirectional reflection. The coated polymer was wrapped around a cylindrical glass rod. After multiple rounds of polymer around the rod, a cylindrical multilayer photonic crystal was obtained. This structure was solidified with heating in vacuum to obtain a macroscale preform. By thermal drawing of the
preform, hollow-core photonic band gap fibers of extended length and desired band gaps were produced.29,30
Analyte Preparation. Ethanol, methanol, and water solutions with different volume percentages were prepared in plastic vials. For beverage adulteration experiments, non-alcoholic beer and canned mixed fruit juice were adulterated with 5% ethanol and 5% methanol individually right after opening the bottle. All samples were stored at room temperature.
Measurements. The scheme for the optoelectronic nose utilizes an IR source, collimator optics, hollow-core IR fiber array, and an IR detector (see Supporting Information, Scheme S1). Measurement system should enable the coupling of IR light tofiber and delivery of analyte into fiber simultaneously. A simple handmade tool with two entries was attached to one end of thefibers. The other end of the fibers was left open to allow flow of analyte gas and transmittance of IR radiation to the detector. One entry of the tool was kept open to allow the coupling of IR radiation, and a hose for analyte delivery was fixed at the other entry. Blackbody IR light source (SiC filament) and DLaTGS (deuteratedL-alanine-doped triglycine
sulfate) IR detector of a FT-IR system (Bruker Tensor) were used for IR absorption measurements. Two zinc selenide (ZnSe) lenses were incorporated for coupling of radiation into fiber. The radiation transferred to the other side of the fiber was measured by simply placing the DLaTGS detector at the end of thefiber.
Analyte solutions were inserted into aflask and their vapors at room temperature were introduced to thefibers by use of nitrogen carrier gas at aflow rate of 1000 sccm. The gas flow was adjusted with a mass flow controller (MKS, multi gas controller 647C). After each measurement, the analytes inside thefibers were removed with pure nitrogen gas.
Data Analysis. Obtained transmission values for various analytes were discriminated by use of hierarchical cluster analysis (HCA) as the pattern recognition technique. The analyses were performed by built-in HCA algorithms of a commercial software. Squared Euclidean distance metric and single-link linkage method were used for the dendrogram in Figure 3c; squared Euclidean distance metric and Ward’s linkage method were used for all the remaining dendrograms (basic algorithms of the pattern recognition techniques are provided as Supporting Information).
■
RESULTS AND DISCUSSIONOptoelectronic Nose Design. Optoelectronic nose comprises a broadband light source, hollow-core photonic band gap (PBG) fiber array, and DLaTGS IR detector. The length of thefibers is typically around 30 cm, their hollow-core diameters are around 750μm, and their cell volume is about 150μL. The broadband light source is coupled to each fiber via an IR lens, and the transmitted integrated infrared energy from the other side of thefiber was monitored with the DLaTGS detector (see Supporting Information, Scheme S1). In optoelectronic nose design, thermally drawn (see Materials and Methods) optofluidic Bragg fibers (sensing elements) are used for three purposes: (i)filtering the incoming infrared light depending on their PBG structure, (ii) guiding thefiltered light, and (iii) as miniaturized gas cells. The Bragg structure of the fibers (Figure 1a), produced utilizing high refractive index contrast dielectric multilayers, determines their transmission spectra. By simply changing the dielectric layer thicknesses, the transmission spectra offibers can be tuned in the whole
infrared region (2−20 μm).35Fibers used in this study have fundamental transmission bands at around 910 cm−1(11μm), 1030 cm−1 (9.7 μm), and 3100 cm−1 (3.2 μm) and are designated asfibers 1, 2, and 3, respectively (Figure 1b). Also, second-order transmission bands with much lower intensities, which is typical for Bragg fibers,35 for fibers 1 and 2 were observed at around 2750 and 3400 cm−1, respectively. Forfiber 3, the second-order band is out of the measurement range. The spectral positions of thefibers were decided by examining the FT-IR spectra of analytes, which will be discussed below in detail.
The fiber responses after analyte (ethanol, methanol, and water) introduction and their FT-IR spectra are given in Figure 2. Fiber transmissions decrease by analyte vapors if the analyte has an infrared absorption in the transmission band range of the fiber; otherwise they remain unchanged. For instance, ethanol vapor resulted in a large quenching in the transmission of all fibers (Figure 2a). On the other hand, introduction of methanol quenches the fundamental transmission bands offibers 2 and 3 but not fiber 1 (Figure 2b). When we examined the transmission of fiber 1 after methanol introduction in detail, we observed that its fundamental transmission band was slightly reduced (Figure 2b, inset at left) due to the tail of the absorption band of the methanol centered around 1000 cm−1. Second-order transmission band of the fiber was also significantly quenched by the absorption band of the methanol at around 3000 cm−1(Figure 2b, inset at right). Water vapor did not quench the transmission of any of thefibers (Figure 2c) since it does not have any absorption band infiber transmission regions (in other words, the optoelectronic nose cannot smell
the water vapor); therefore, the response of optoelectronic nose is independent of the humidity of the environment.
Sensor Array Response against Alcohol−Water Mixtures. In order to demonstrate the efficacy of the optoelectronic nose in discrimination of binary and ternary alcohol water mixtures, we tested several alcohol solutions. The alcohol percentages in the mixtures were selected between 5% and 40% by volume since most of the alcoholic beverages have alcohol percentages in this region. The response matrix was collected by measuring thefiber transmission before and after analyte introduction. For each chemical andfiber set, the ratio (I/I0) between total transmitted intensity before (I0) and after (I) interaction with the analyte is calculated and analyzed. A typical sensor response data is presented in Figure 3a for further discussion (see also Supporting Information, Table S1). Also, the average values of at least three different measurements for various alcohol concentrations and their standard errors are given in Table S2 (see Supporting Information), which indicates the good reproducibility of the sensor array response.
Figure 1.(a) Scanning electron microscopic images of in-fiber Bragg mirror structures. Infrared light-transmitting bands of the fibers are controlled by the thickness and refractive index parameters of the periodic structure. The gradual decrease in layer thicknesses of the fibers is apparent as the transmission band shifts to higher wavenumber values. (b) Measured transmission spectra of the three fibers used in this study. It is possible to design a fiber array for a specific application by adjusting the transmission bands of the fibers so that they correspond to major absorption lines of analytes. (Inset) Photograph of hollow-core infrared photonic band gap (PBG)fibers demonstrating theirflexibility.
Figure 2.Quenching offiber transmissions due to absorption of light by the analyte inside thefiber. Absorption spectra (purple lines) of the analytes and transmission spectra offibers before (dashed lines) and after (solid lines) analyte introduction are shown for (a) ethanol, (b) methanol, and (c) water. Insets in panel b are close-up views of fundamental and second-order bands offiber 1.
As we previously mentioned, the total transmitted light intensity of thefiber array remained unchanged against water vapor. For other cases,fiber transmissions decreased depending on the ethanol and methanol percentages of the mixtures. Also, we observed larger quenching percentages at higher alcohol concentrations as expected. In order to better visualize the differences in the fiber array response set, we also present the data as a 2D color map (Figure3b), where each mixture resulted in a distinct blue-scale color pattern. The multivariate distances between mixture responses (i.e., the distances in three-dimensional data space collected from three fibers) were examined by performing a hierarchical cluster analysis (HCA) that utilizes “squared Euclidean distance” metric and “single-link” linkage method (for further details see Supporting Information).6 The dendrogram, showing the distances between three pure chemicals and their eight mixtures,
indicates clear separation between all responses (Figure 3c). The algorithm clusters the analytes into two main groups of alcohol concentrations: low and high. Also, within these two groups the solutions with the same alcohol percentages are closely clustered. For instance, 40% ethanol, 40% methanol, and 20% ethanol + 20% methanol solutions formed a subgroup among solutions with high alcohol concentrations. As a result, measurements are arranged in order of alcohol concentrations from top (pure alcohols) to bottom (water) of the dendrogram. The distances in the dendrogram are highly reproducible, even for the lowest alcohol concentrations, which will be discussed in detail below.
The effect of alcohol percentage on quenching of fiber transmissions was studied in detail with fiber 2. Ethanol and methanol solutions in water with alcohol percentages ranging between 0.5% and 20% were introduced to thefiber, and fiber transmissions were recorded. This experiment was repeated three times for each analyte. Figure 4a,c shows that as the concentration of ethanol or methanol increases, the fiber transmission is reduced gradually. We observed a good consistence for both analytes with the Beer−Lambert law; that is, there is a linear relationship between concentration and absorbance. Using these linear relationships, we calculated the limit of detection to be 0.31% and 0.27% (v/v) for ethanol and methanol, respectively. Corresponding molar percentages are 0.097% for ethanol and 0.122% for methanol. By assuming that solutions are ideal mixtures (note that since the molar percentages of the alcohols are very small, the deviation from ideality can be neglected), we calculated the concentration of the alcohols in the vapor phase to be 57 and 157 ppm for ethanol and methanol, respectively. Therefore, it is possible to quantitatively analyze the alcohol solutions with good sensitivity.
However, it is obvious that one cannot discriminate two alcohols from each other by use of a singlefiber; to qualitatively analyze the alcohol solutions, more than onefiber is needed. Since eachfiber scans a different part of the infrared region for a possible absorption band, reliable differentiation depends strongly on the number offibers in the array. To discuss this, we obtained the dendrograms of analytes using the response of singlefibers (Figure S1 in Supporting Information). Figure S1 demonstrates that if the analysis is done with only singlefiber, meaningful and reliable classification is not possible. For instance, forfiber 1 there is no significant difference between 5% ethanol and 10% methanol, and for fiber 2 the same phenomenon is observed between 10% ethanol, 10% methanol, and 5% ethanol + 5% methanol. On the other hand, as previously mentioned, when allfibers are used it is possible to discriminate all analytes successfully. In other words, the combinatorial response obtained from all fibers allows us to analyze the alcohol water mixtures both qualitatively and quantitatively.
In addition, it is interesting to note that the response offiber 2 to a ternary mixture is a combined response of its reaction to binary mixtures with the same alcohol percentages. Figure S2 (see Supporting Information) shows response of fiber 2 to binary and ternary mixtures with same total alcohol and water concentrations but varying in percentages of ethanol and methanol. The 10% methanol mixture demonstrates the highest quenching in transmission of fiber 2 at 1033 cm−1 and 10% ethanol at 1045 cm−1. The 5% ethanol + 5% methanol mixture’s quenching is intermediate at both frequencies. Therefore, it may be possible to determine the concentrations
Figure 3.(a) Intensity ratio of thefibers before and after introduction of ethanol, methanol, and water mixtures at different concentrations. Eachfiber respond differently to the alcohol-containing mixtures in a concentration-dependent manner. None of the fibers showed any response against pure water, indicating that the response of thefiber array is independent of the humidity of the environment. The analytes are named with the number showing the analyte volume percentage and initial letter of the analyte, such that 20E + 20M is the solution containing 20% ethanol and 20% methanol. (b) Blue-scale representation of the response of each fiber. White corresponds to 100% intensity drop and blue corresponds to 0%. (c) Hierarchical cluster analysis of alcohol mixture measurements. Horizontal length scale shows how similar the analytes are according to the sensor array. The overall response of the sensor array shows a clear discrimination for alcohol mixtures of different concentrations.
of alcohols in a ternary mixture by investigating the quenching offiber 2.
Sensor Array Parameters. The reproducibility, reusability, and fast response time of the optoelectronic nose was demonstrated byfive repeated measurements of 5% methanol and ethanol solutions and pure water. We observed that the signal of the quenchedfiber regenerates in less than a second by simplyflushing the fiber with the carrier gas, and it immediately quenches again by introducing the analyte vapor. For instance, Figure 5a shows such five repeated measurements performed withfiber 2 and 5% methanol solution. The statistical error in the intensity ratio of the repeated measurements (Figure 5a, inset) was calculated as 0.75%, which revealed that the response of the optoelectronic nose is highly reproducible. Intensity ratios for all fiber and analyte sets are given in Supporting Information (Table S3). The HCA analyses (performed using minimum variance Ward’s method) of the repeatability measurements (Figure 5b) demonstrated that the optoelec-tronic nose successfully identified the mixtures, without a mistake, for several repeated measurements. These results revealed that the optoelectronic nose can rapidly, accurately, and reproducibly discriminate 5% methanol and 5% ethanol solutions.
Discrimination of Alcohols in Complex Environments. Industrial-scale production of methanol-containing counterfeit alcoholic beverages is a growing worldwide problem causing serious health problems, including breathing difficulties and blindness and even death.36,37 Conventionally, it is very challenging to analyze alcohols in highly interfering alcoholic beverage environment, which can be composed of water,
ethanol, carbon dioxide, and many other volatile (aromas and flavors) or fixed compounds.38
Besides the background complexity, another challenge of alcohol analyses in counterfeit alcoholic beverages is the highly similar physical and chemical nature (i.e., functional groups, polarity, vapor pressure, molecular size etc.) of methanol and ethanol. In fact, successful discrimination of ethanol and methanol by an electronic nose, even from their pure vapors, has been rarely reported.39−43On the other hand, here we demonstrate discrimination of ethanol and methanol in complex environments by taking advantage of the high selectivity of the optoelectronic nose concept.31 Spectral positions of thefibers were selected after investigating the FT-IR spectra of ethanol, methanol, water, and carbon dioxide, which are the main components of the vapor of an alcoholic beverages, since their vapor pressures are higher than the other compounds such as aromas and flavors. The transmission bands of the fibers were adjusted to overlap with the main absorption bands of ethanol and methanol and not to overlap with water and carbon dioxide. Other volatiles in the complex background have no significant effect on the transmission of the sensor array since their concentrations are very low compared to the other components. Therefore, our sensor array can selectively discriminate ethanol and methanol in a complex alcoholic beverage background.
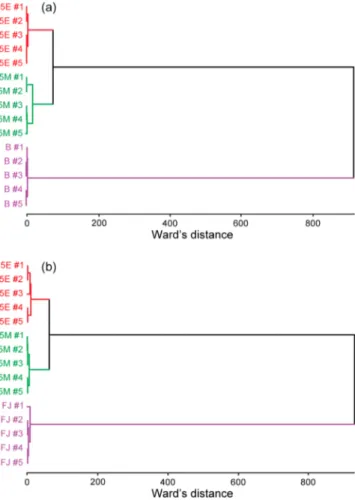
In order to simulate the complexity of the alcoholic beverage background, we used nonalcoholic beer and mixed fruit juice. Both samples were spiked with 5% ethanol and 5% methanol, andfive repeated measurements were taken. The dendrograms corresponding to HCA analyses of the samples in nonalcoholic beers (Figure 6a) and mixed fruit juice (Figure 6b) revealed
Figure 4.Quenching offiber transmissions can be analyzed not just for discrimination of two different alcohols but also for quantitative analysis of the alcohol concentrations. (a, c) Quenching offiber 2 transmission spectrum for different concentrations of (a) ethanol and (c) methanol. The increase in analyte concentration results in more absorption of radiation within thefiber. (b, d) Quantitative analysis: three measurements were taken at each concentration, showing the high linearity of thefiber response.
successful discrimination of these two alcohols from each other in chemically complicated environments. The optoelectronic nose classified the alcohol solutions correctly for all five measurements in both environments.
Results of all measurements are provided in Supporting Information (Tables S4 and S5). Interestingly, none of the fibers respond to the nonalcoholic beer and mixed fruit juice backgrounds. On the other hand, samples spiked with 5% alcohol resulted in a significant decrease in the fiber transmissions, which is in good accordance with the results of alcohol water mixture experiments. As we previously reported,27the sensitivity of the optoelectronic nose is around low parts per million (ppm) levels (comparable with the sensitivity of FT-IR spectroscopy) since a blackbody light source was used in the optoelectronic nose design. The sensitivity of the nose is not high enough to smell the volatiles in these beverages, which might have concentrations in the vapor phase lower than 1 ppm. Therefore, beer and fruit juice vapor introduction did not affect the fiber transmissions. We note that the sensitivity of the optoelectronic nose can be simply improved by use of more powerful light sources such as
quantum cascade lasers (QCL).44However, for our case the sensitivity of the optoelectronic is more than enough since a 5% alcohol solution is equivalent to around a couple of thousand ppm concentration in the vapor phase, which is almost 2 orders of magnitude higher than the sensitivity of the optoelectronic nose (57 ppm for ethanol and 157 ppm for methanol). In addition, improving the sensitivity may make data evaluation more complicated because the volatile chemicals in the backgrounds become detectable by the optoelectronic nose.
■
CONCLUSIONIn conclusion, we investigated qualitative and quantitative analytic qualities of the optoelectronic nose concept in complex environments. The main technology of the developed artificial nose is optofluidic Bragg fibers, which are employed as IR filter, gas chamber, and waveguide simultaneously. Transmission bands of the fibers can be controlled during fabrication, and therefore a specific fiber array for a specific purpose can be designed since IR absorption spectra of chemicals are well-known. We chose two alcohols, ethanol and methanol, to conduct analytical experiments, and we designed thefiber array accordingly. The discrimination of these two alcohols is particularly important to detect toxic methanol-containing counterfeit alcoholic beverages. This is a challenging task for artificial noses for two reasons: (i) beverage background
Figure 5. (a) Transmission spectra of fiber 2 before and after 5% methanol vapor introduction. (Inset) I/I0 ratios of five repeated
measurements. (b) Hierarchical cluster analysis of ethanol and methanol mixtures in water. Repeated measurements of 5% ethanol, 5% methanol, and pure water are correctly clustered by the algorithm. This demonstrates the accuracy of the optoelectronic nose concept. Abbreviations indicate analyte name and percentage, such that 5E is the solution containing 5% ethanol.
Figure 6. Hierarchical cluster analysis of ethanol- or methanol-adulterated (a) nonalcoholic beer (B) and (b) mixed fruit juice (FJ). In an environment with various volatile organic compounds, it is possible to distinguish methanol-adulterated beverages. Abbreviations indicate analyte name and percentages, such that 5E is the solution containing 5% ethanol in beer or in fruit juice.
contains several volatile chemicals that can interfere with the sensor elements, and (ii) ethanol and methanol are very similar in physical and chemical properties (molecular mass, vapor pressure, polarity, etc.). In this study, we demonstrated that the optoelectronic nose can selectively discriminate these two alcohols independent from the background. In addition, other analytical features of the optoelectronic nose, that is, sensitivity, reproducibility, reusability, and response time, were demon-strated. The optoelectronic nose concept is proved to be able to discriminate ethanol and methanol mixtures of concentrations down to 5% by volume in a couple of seconds. The optoelectronic nose revealed excellent reusability; the signal is totally regenerated by simplyflushing the fibers with nitrogen. Quenching experiments performed withfiber 2 revealed a linear relationship between absorbance and concentration in the range of 0.5% to 20% alcohol concentrations, which can be exploited for a simple quantitative analysis. We shall emphasize that the flexibility in the optoelectronic nose design and its simple and cost-effective production makes this novel concept a promising artificial nose candidate, which could be employed in many aspects of our everyday lives.
■
ASSOCIATED CONTENT*
S Supporting InformationAdditional text with details of HCA analysis, one scheme of the experimental setup, twofigures showing response of fiber 2 to ternary mixtures and dendrogram plots of the response of single fibers, and five tables containing I/I0 values of all
measurements. This material is available free of charge via the Internet at http://pubs.acs.org.
■
AUTHOR INFORMATIONCorresponding Author
*E-mail [email protected]; tel +90 312 2903501; fax +90 312 266 4365.
Author Contributions
§A.Y. and F.E.O. contributed equally to this work.
Notes
The authors declare no competingfinancial interest.
■
ACKNOWLEDGMENTSWe gratefully thank Urandelger Tuvshindorj for her helps on fiber transmission measurements. We also thank Dr. Mecit Yaman for fruitful discussions and Murat Dere and Bihter Dağlar for cross-sectioning of fibers. This work was supported by TUBITAK Grants 110M412, 111T696, and 112T612. The research leading to these results has received funding from the European Research Council under the European Union’s Seventh Framework Programme (FP/2007-2013)/ERC Grant Agreement 307357. M.B. acknowledges partial support from the Turkish Academy of Sciences (TUBA).
■
REFERENCES(1) Suslick, B. A.; Feng, L.; Suslick, K. S. Anal. Chem. 2010, 82, 2067−2073.
(2) Bonifacio, L. D.; Ozin, G. A.; Arsenault, A. C. Small 2011, 7, 3153−3157.
(3) Munoz-Munoz, A. C.; Grenier, A. C.; Gutierrez-Pulido, H.; Cervantes-Martinez, J. J. Chromatogr. A 2008, 1213, 218−223.
(4) Walt, D. R. Anal. Chem. 2005, 77, 45a−45a.
(5) Rock, F.; Barsan, N.; Weimar, U. Chem. Rev. 2008, 108, 705−725.
(6) Pearce, T. C.; Schiffman, S. S.; Nagle, H. T.; Gardner, J. W. Handbook of Machine Olfaction; Wiley−VCH: Weinheim, Germany, 2003.
(7) Tisch, U.; Haick, H. Rev. Chem. Eng. 2010, 26, 171−179. (8) Peng, G.; Hakim, M.; Broza, Y. Y.; Billan, S.; Abdah-Bortnyak, R.; Kuten, A.; Tisch, U.; Haick, H. Br. J. Cancer 2010, 103, 542−551.
(9) Smyth, H.; Cozzolino, D. Chem. Rev. 2013, 113, 1429−1440. (10) Persaud, K.; Dodd, G. Nature 1982, 299, 352−355.
(11) Peng, G.; Tisch, U.; Adams, O.; Hakim, M.; Shehada, N.; Broza, Y. Y.; Billan, S.; Abdah-Bortnyak, R.; Kuten, A.; Haick, H. Nat. Nanotechnol. 2009, 4, 669−673.
(12) Lonergan, M. C.; Severin, E. J.; Doleman, B. J.; Beaber, S. A.; Grubb, R. H.; Lewis, N. S. Chem. Mater. 1996, 8, 2298−2312.
(13) Haick, H.; Hakim, M.; Patrascu, M.; Levenberg, C.; Shehada, N.; Nakhoul, F.; Abassi, Z. ACS Nano 2009, 3, 1258−1266.
(14) Sysoev, V. V.; Goschnick, J.; Schneider, T.; Strelcov, E.; Kolmakov, A. Nano Lett. 2007, 7, 3182−3188.
(15) Lange, D.; Hagleitner, C.; Hierlemann, A.; Brand, O.; Baltes, H. Anal. Chem. 2002, 74, 3084−3095.
(16) Harbeck, M.; Sen, Z.; Gurol, I.; Gumus, G.; Musluoglu, E.; Ahsen, V.; Ozturk, Z. Z. Sens. Actuators, B 2011, 156, 673−679.
(17) Paoloni, F. P. V.; Kelling, S.; Huang, J. Z.; Elliott, S. R. Adv. Funct. Mater. 2011, 21, 372−379.
(18) Toal, S. J.; Trogler, W. C. J. Mater. Chem. 2006, 16, 2871−2883. (19) Dickinson, T. A.; White, J.; Kauer, J. S.; Walt, D. R. Nature 1996, 382, 697−700.
(20) Aernecke, M. J.; Walt, D. R. Anal. Chem. 2009, 81, 5762−5769. (21) Bowden, M.; Song, L. N.; Walt, D. R. Anal. Chem. 2005, 77, 5583−5588.
(22) Rakow, N. A.; Suslick, K. S. Nature 2000, 406, 710−713. (23) Lim, S. H.; Feng, L.; Kemling, J. W.; Musto, C. J.; Suslick, K. S. Nat. Chem. 2009, 1, 562−567.
(24) Janzen, M. C.; Ponder, J. B.; Bailey, D. P.; Ingison, C. K.; Suslick, K. S. Anal. Chem. 2006, 78, 3591−3600.
(25) Bonifacio, L. D.; Puzzo, D. P.; Breslav, S.; Willey, B. M.; McGeer, A.; Ozin, G. A. Adv. Mater. 2010, 22, 1351−1354.
(26) Zhang, C.; Suslick, K. S. J. Agric. Food Chem. 2007, 55, 237−242. (27) Yildirim, A.; Vural, M.; Yaman, M.; Bayindir, M. Adv. Mater. 2011, 23, 1263−1267.
(28) Fan, X.; White, I. M. Nat. Photonics 2011, 5, 591−597. (29) Temelkuran, B.; Hart, S. D.; Benoit, G.; Joannopoulos, J. D.; Fink, Y. Nature 2002, 420, 650−653.
(30) Abouraddy, A. F.; Bayindir, M.; Benoit, G.; Hart, S. D.; Kuriki, K.; Orf, N.; Shapira, O.; Sorin, F.; Temelkuran, B.; Fink, Y. Nat. Mater. 2007, 6, 336−347.
(31) Yaman, M.; Yildirim, A.; Kanik, M.; Cinkara, T. C.; Bayindir, M. Anal. Chem. 2012, 84, 83−90.
(32) Vale, A. Medicine 2007, 35, 633−634.
(33) Konvalina, G.; Haick, H. ACS Appl. Mater. Interfaces 2012, 4, 317−325.
(34) Yeh, P.; Yariv, A.; Marom, E. J. Opt. Soc. Am. 1978, 68, 1196− 1201.
(35) Kuriki, K.; Shapira, O.; Hart, S. D.; Benoit, G.; Kuriki, Y.; Viens, J. F.; Bayindir, M.; Joannopoulos, J. D.; Fink, Y. Opt. Express 2004, 12, 1510−1517.
(36) British Broadcasting Corporation. http://www.bbc.co.uk/news/ uk-12456360, February 15, 2011.
(37) Yayci, N.; Agritmis, H.; Turla, A.; Koc, S. Forensic Sci. Int. 2003, 131, 36−41.
(38) Pontes, M. J. C.; Santos, S. R. B.; Araujo, M. C. U.; Almeida, L. F.; Lima, R. A. C.; Gaiao, E. N.; Souto, U. T. C. P. Food Res. Int. 2006, 39, 182−189.
(39) Kieser, B.; Dieterle, F.; Gauglitz, G. Anal. Chem. 2002, 74, 4781−4787.
(40) Chang, C. K.; Bastiaansen, C. M. W.; Broer, D. J.; Kuo, H. L. Adv. Funct. Mater. 2012, 22, 2855−2859.
(41) Wongchoosuk, C.; Wisitsoraat, A.; Tuantranont, A.; Kerdcharoen, T. Sens. Actuators, B 2010, 147, 392−399.
(43) Peres, L. O.; Li, R. W. C.; Yamauchi, E. Y.; Lippi, R.; Gruber, J. Food Chem. 2012, 130, 1105−1107.
(44) Charlton, C.; Temelkuran, B.; Dellemann, G.; Mizaikoff, B. Appl. Phys. Lett. 2005, 86, No. 194102.