Address for Correspondence/Yaz›şma Adresi: Dr. Şerafettin Demir, Adana Devlet Hastanesi, Kardiyoloji Kliniği 01270, Adana-Türkiye
Phone: +90 533 627 19 91 Fax: +90 432 212 19 54 E-mail: [email protected] Accepted Date/Kabul Tarihi: 17.07.2013 Available Online Date/Çevrimiçi Yayın Tarihi: 02.01.2014 ©Telif Hakk› 2014 AVES Yay›nc›l›k Ltd. Şti. - Makale metnine www.anakarder.com web sayfas›ndan ulaş›labilir.
©Copyright 2014 by AVES Yay›nc›l›k Ltd. - Available on-line at www.anakarder.com doi:10.5152/akd.2014.4668
A
BSTRACTObjective: Objective of this study was to investigate the correlation between P wave dispersion and left ventricular diastolic function, which are associated with the increased cardiovascular events in patients with dipper and non-dipper HT.
Methods: Eighty sex and age matched patients with dipper and non-dipper HT, and 40 control subject were included in this observational cross-sectional study. P wave dispersion was measured through electrocardiography obtained during the admission. The left ventricule (LV) ejection fraction was measured using the modified Simpson’s rule by echocardiography. In addition, diastolic parameters including E/A rate, decelera-tion time (DT) and isovolumetric relaxadecelera-tion time (IVRT) were recorded. Independent samples Bonferroni, Scheffe and Tamhane tests and cor-relation test (Spearman and Pearson) were used for statistical analysis.
Results: P wave dispersion was found to be significantly increased in the non-dipper than in the dipper group (56.0±5.6 vs. 49.1±5.3, p<0.001). Pmax duration was found significantly higher (115.1±5.6 vs. 111.1±5.8, p=0.003) and Pmin duration significantly lower (59.0±5.6 vs. 62.3±5.3, p=0.009) in the non-dippers. Correlation analysis demonstrated presence of moderate but significant correlation between P-wave dispersion and left ventricular mass index (LVMi) (r=0.412, p=0.011), IVRT (r=0.290 p=0.009), DT (r=0.210, p=0.052) and interventricular septum (IVS) thickness (r=0.230 p=0.04).
Conclusion: P wave dispersion and P Max were found to be significantly increased and P min significantly decreased in the non-dipper HT patients compared to the dipper HT patients. P-wave dispersion is associated with left ventricular dysfunction in non-dipper and dipper HT. (Anadolu Kardiyol Derg 2014; 14(0): 000-000)
Key words: hypertension, non-dipper hypertension, p wave dispersion, diastolic function
Ö
ZETAmaç: Bu çalışmanın amacı, dipper ve non-dipper hipertansiyon (HT) bulunan hastalarda kardiyovasküler olaylardaki artışla ilişkili olan P dalga dispersiyonu ile sol ventriküler diyastolik fonksiyon arasındaki ilişkiyi incelemektir.
Yöntemler: Dipper ve non-dipper HT olmak üzere 80 yaş ve cinsiyet uyumlu hasta ile 40 sağlıklı kontrol bu gözlemsel enine kesit çalışmasına dahil edilmiştir. P dalga dispersiyonları hastaneye kabul sırasında elektrokardiyografi aracılığıyla ölçülmüştür. Ekokardiyografi ile sol ventriküler ejeksiyon fraksiyonu modifiye Simpson yöntemi yardımıyla ölçülmüştür. Ayrıca E/A hızı, deselerasyon zamanı (DT) ve izovolümetrik relaksasyon zamanı (IVRT) gibi diyastolik parametreler de kaydedilmiştir. İstatistiksel analizlerde Bonferroni, Scheffe ve Tamhane testleri ve korelasyon testi (Spearman and Pearson) kullanılmıştır.
Bulgular: P dalga dispersiyonu non-dipper grupta dipper gruptan anlamlı olarak yüksek bulunmuştur (56,0±5,6'ya karşı 49,1±5,3, p<0,001). Maksimum P dalga süresi non-dipper grupta anlamlı olarak yüksek (115,1±5,6'ya karşı 111,1±5,8, p=0,003), minimum P dalga süresi ise anlamlı olarak düşük bulunmuştur (59,0±5,6'ya karşı 62,3±5,3, p=0,009). Korelasyon analizi P dalga dispersiyonu ile sol ventrikül kitle indeksi (LVMi) (r=0,412, p=0,011), IVRT (r=0,290 p=0,009), DT (r=0,210, p=0,052) ve interventriküler septum (IVS) kalınlığı (r=0,230 p=0,04) arasında orta derecede, ancak anlamlı bir korelasyon bulunduğunu göstermiştir.
Aydın Rodi Tosu, Şerafettin Demir
1, Yüksel Kaya
2, Murat Selçuk, Serkan Akdağ, Turgay Işık
3, Can Baba Arın,
Mahmut Özdemir
4, Oğuz Akkuş
Clinic of Cardiology, Van Education and Research Hospital, Van-Turkey
1Clinic of Cardiology, Adana State Hospital, Adana-Turkey
2Department of Cardiology, Faculty of Medicine, Kafkas University, Kars-Turkey 3Department of Cardiology, Faculty of Medicine, Balıkesir University, Balıkesir-Turkey
4Department of Cardiology, Faculty of Medicine, Yüzüncü Yıl University, Van-Turkey
Association of P wave dispersion and left ventricular diastolic
dysfunction in non-dipper and dipper hypertensive patients
Non-dipper ve dipper hipertansif hastalarda P dalga dispersiyonu ile diyastolik disfonksiyon
arasındaki ilişkisi
Introduction
The circadian rhythm in the neurohumoral system results in a circadian rhythm in blood pressure. Depending on the circa-dian rhythm, blood pressure reaches its highest value in the morning, shows a gradual decrease during the day and courses at the lowest levels at night (1). The condition in which blood pressure the nocturnal blood pressure falls 10% or more com-pared to the diurnal blood pressure is defined as dipper hyper-tension (DHT) and the condition with a fall of the nocturnal blood pressure falling less than 10% compared to the diurnal blood pressure is defined as non-dipper hypertension (NDHT) (2). NDHT is associated with high rates of end organ damages (3, 4) and cardiovascular morbidity (such as AF) and mortality (5, 6).
Maximal P wave duration and P wave dispersion (Pd) are non-invasive markers showing the heterogeneous and instable distribution of the impulses arising from the sinus node on a standard ECG. Maximal P wave duration is an indicator of the disrupted inter-atrial conduction, while Pd shows the heteroge-neous electrical conduction. Maximal P wave duration and P wave dispersion are used as non-invasive indicators in predic-tion of the risk for AF in the patients with paroxysmal AF, mitral stenosis, aortic stenosis, dilated cardiomyopathy, acute myo-cardial infarction, atherosclerotic heart disease and angina (7-13). In the previous studies, hypertension was demonstrated to be an independent risk factor for atrial fibrillation (AF) (14).
Several studies demonstrated that P-wave dispersion is in increased in dipper and non-dipper hypertension (15, 16) but the mechanisms have not been well clarified. Diastolic dysfunction will be suggested between these mechanisms (17, 18). In this study, we aimed to compare P wave dispersion in dipper and non-dipper HT patients and evaluate its association with left ventricular dysfunction.
Methods
Study populationThis is an observational cross-sectional study. The approval of the local Ethics Committee was obtained for this study and informed consent were taken from the patients who were par-ticipated to the study. For the purposes of our study, 40 healthy subjects and 80 patients with hypertension were included to study. Hypertensive patients were selected from patients who had presented to the cardiology clinic of our hospital within the last year and were previously diagnosed with primary (essential) hypertension and followed up under treatment with the same group of anti-hypertensives (combination therapy with ACE inhibitors+thiazide). Hypertensive patients were divided into two subgroups: 40 dipper (group I: 18 male, 22 female, mean age:
54.2±7.0 years) and 40 non-dippers (group II: 17 male, 23 female, mean age 54.4±7.1 years). The classification of the dippers and non dippers were based on the ambulatory blood pressure monitoring (19). Those with atrial fibrillation, history of isch-emic heart disease, left ventricular systolic dysfunction, left ventricular hypertrophy, renal and hepatic failure (serum cre-atinine >1.5 mg/dL and AST-ALT >2 times the normal values), hypothyroidism, hepatic dysfunction, haemolytic disease, con-comitant inflammatory diseases such as autoimmune disorders, neoplastic disease, recent major surgery or any systemic disor-ders, diseases of the respiratory tract (chronic obstructive pulmonary disease, chronic bronchitis, pulmonary embolism), primary pulmonary hypertension, isolated right heart failure, congenital heart disease and valvular disease were excluded from the study. Physical examination findings, risk factors, medical history data, and resting 12-lead electrocardiograms were obtained from all groups. In addition, whole blood count, fasting blood glucose, blood urea nitrogen, creatinine, serum sodium, potassium levels, HDL, LDL, total cholesterol, triglycer-ide levels, liver and thyroid function test measurements were performed.
The patients body mass indices (BMI) and smoking status were specified
The body mass index (BMI) was calculated by dividing the weight in kilograms by the height in square meters (kg/m2). In
line with the World Health Organization criteria, anemia at the presentation was defined and as a baseline Hgb concentration below 13 mg/dL in males and below 12 mg/dL in females (20). The diagnosis of DM was based on previous history of diabetes treated with or without medical therapy (21). Stable angina was defined as discomfort in the chest, jaw, shoulder, back, or arms; typically elicited by exertion or emotional stress and relieved by rest or nitroglycerin. Current smokers were defined as those who had smoked for some period during the past year. Those patients dependent on chronic dialysis were considered as hav-ing end-stage renal disease (ESRD).
Blood pressure measurements
Ambulatory blood pressure monitoring was performed using the non invasive recording system (DiaSys Diagnostic Systems GmbH, Holzheim, Germany). The device was programmed to repeat the measurements every 15 minutes throughout the day-time (06.00-20.00) and every 30 minutes during the night (20.00-06.00) for 24 hours. Those patients in which the mean systolic and diastolic BP values measured during the night showed a 10% or greater decrease compared to the mean daytime values were classified into the DHT group, while those with decreases below 10% were classified into the non-DHT group.
Sonuç: P dalga dispersiyonu ile maksimum P dalga süresinin non-dipper HT hastalarında dipper HT hastalarına kıyasla anlamlı olarak arttığı, minimum P dalga süresinin ise anlamlı olarak azaldığı bulunmuştur. Non-dipper ve dipper HT hastalarında P dalga dispersiyonu sol ventriküler disfonksiyonla ilişkilidir. (Anadolu Kardiyol Derg 2014; 14(0): 000-000)
Electrocardiographic recording and P wave dispersion measurement
Following a resting period of 20 minutes, 12-lead ECG was recorded at supine position at a paper speed of 50-mm/s and an amplitude of 20 mm/mV. The onset of P wave was defined as the point of first downward departure from the top of baseline for negative waves. The return to the baseline of the bottom of trace was considered to be the end of the P wave. The difference between the maximum and minimum P wave duration calculated from any derivation of the 12-lead ECG and was defined as the Pd (Pd=Pmax-Pmin).
Transthoracic echocardiography
The transthoracic echocardiography was carried out before the discharge by a system V (Vingmed; GE, Horten, Norway) device and using a 2.5 MHz phased-array transducer. Recordings were performed while the patients were in the left lateral decu-bitus position. The left ventricule (LV) ejection fraction was measured using the modified Simpson’s rule. In addition, dia-stolic parameters including E/A rate, deceleration time (DT) and isovolumetric relaxation time (IVRT) were recorded. Furthermore, left atrial diameter and interventricular septal thickness (IVS) were measured from the parasternal long-axis with M-mode method (22).
Statistical analyses
Statistical analyses were performed using the IBM SPSS version 20 .0 for Windows (IBM Corp. SPSS, Chicago IL. USA). Continuous variables in the group data are indicated as mean±standard deviation (AVG±SD). Categorical variables are given in numbers and percentages. Single direction variance analysis was used in general comparison between the groups, while Kruskal Wallis test was used to compare quantitative measurements between the groups. Bonferroni, Scheffe and Tamhane tests were used in inter-group subgroup comparisons in cases of the quantitative measurements according to the homogeneity of the variances. Mann-Whitney U test with Bonferroni correction was used in case of the binary sub-group comparisons. Parametric or nonparametric (Pearson and Spearman) correlation analysis was performed to identify the relationship between continuous variables. Statistical signifi-cance was accepted as p<0.05.
Results
Baseline characteristics
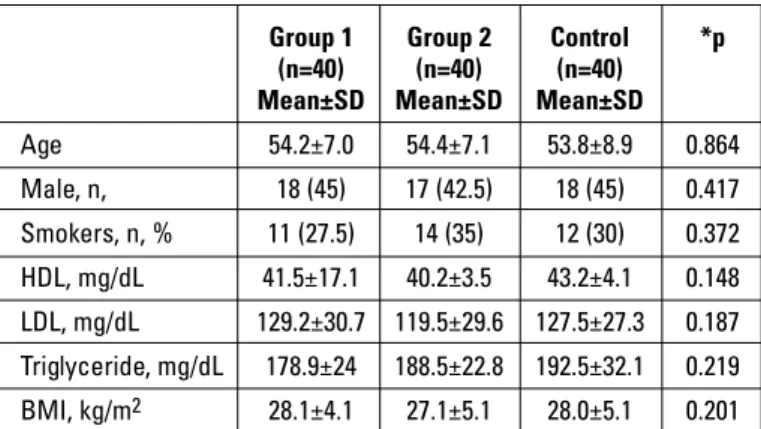
In total, 80 patients were enrolled in the study (54.1±7.2, male: 29%). Group I had 40 patients (54.2±7.0, Male: 25%) and Group II had 40 patients (54.4±7.1, Male: 33%). The groups were similar in terms of the smoking history, BMI and lipid parameters (Table 1). Considering the atrial conduction to be affected, non-diabetic patients were included in the study.
LV diastolic function in dipper and non-dipper hypertension Group 2 showed a higher left ventricular mass index (LVMi) (89.3±18.5 vs. 97.6±16.1, p=0.02) left atrial diameter (3.8±0.4 vs. 4.0+0.2 p=0.044), DT (218.6+35.0 vs. 199.4+37.4, p=0.01) and IVRT (94.1+12.7 vs. 85.3+11.5, p=0.02). There was no difference between the groups in regard to left E/A ratio (1.1+0.3 vs. 1.2+0.4, p=0.56 and IVS diameter (1.0+0.2 vs. 1.0+0.1, p=0.98) (Table 2).
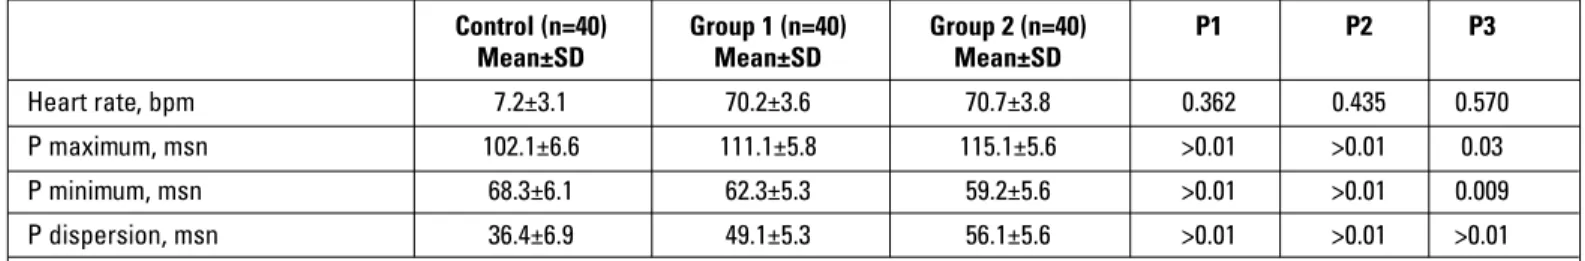
P wave dispersion in dipper and non-dipper hypertension There was no difference between the groups in regard to heart rate (70.7+3.8 vs. 70.2+3.6, p=0.57). Group 2 showed higher P max (115.1+5.6 vs. 111.1+5.8, p=0.003) and P dispersion values
Group 1 Group 2 Control *p (n=40) (n=40) (n=40)
Mean±SD Mean±SD Mean±SD
Age 54.2±7.0 54.4±7.1 53.8±8.9 0.864 Male, n, 18 (45) 17 (42.5) 18 (45) 0.417 Smokers, n, % 11 (27.5) 14 (35) 12 (30) 0.372 HDL, mg/dL 41.5±17.1 40.2±3.5 43.2±4.1 0.148 LDL, mg/dL 129.2±30.7 119.5±29.6 127.5±27.3 0.187 Triglyceride, mg/dL 178.9±24 188.5±22.8 192.5±32.1 0.219 BMI, kg/m2 28.1±4.1 27.1±5.1 28.0±5.1 0.201
BMI - body mass index, HDL - high density lipoprotein, LDL - low density lipoprotein, Group 1- dipper hypertension, Group 2- non-dipper hypertension. Data are presented as mean±SD and number (percentage), *ANOVA test
Table 1. Baseline characteristics of study patients
Control (n=40) Group 1 (n=40) Group 2 (n=40) P1 P2 P3
Mean±SD Mean±SD Mean±SD
LV Mi, g/m2 74.6±17.6 89.3±18.5 97.6±16.1 >0.01 >0.01 0.02 LA Diameter, cm 3.4±0.4 3.8±0.4 4.0±0.2 >0.01 >0.01 0.044 DT, msn 172.7±20.8 199.4±37.4 218.6±35.0 >0.01 >0.01 0.013 IVRT, msn 82.6±21.2 85.3±11.5 94.1±12.7 >0.01 >0.01 0.021 E/A ratio 1.4±0.24 1.2±0.4 1.1±0.3 >0.01 >0.01 0.562 IVS thickness, cm 0.9±0.1 1.0±0.1 1.0±0.2 >0.01 >0.01 0.986
DT - deceleration time, IVRT - isovolumetric relaxation time, IVS - interventricular septum, LA - left atrial, LVMi - left ventricular mass index. P1: Control group versus Group I, P2 - Control group versus Group II, P3- C=Group I versus Group II
Data are presented as mean±SD (percentage).
(56.0+5.6 vs. 49.1+5.3, p<0.001) when compared with group 1. But Goup 2 showed lower P min values (59.0+5.6 vs. 62.3+5.3, p=0.009) when compared with Group 1 (Table 3).
Correlation analysis
When clinical and echocardiographic qualifications that affect P wave period were examined, it was obtained that P dispersion did not have any relation with clinical parameters such as age, gender, heart rate etc., echocardiographic param-eters such as left atrium diameter and E/A proportion and there is a significant correlation with LVMi (r=0.412, p=0.011), IVRT (r=0.290 p=0.009), DT (r=0.210, p=0.052) and IVS thickness (r=0.230 p=0.04) (Table 4).
Discussion
Main findings of our study were P wave dispersion to be found significantly increased in the patients having non-dipper hypertension and related to left ventricular diastolic dysfunc-tion. The need for making a classification as nocturnal decreas-ing and non-decreasdecreas-ing blood pressure, resulted from cardio-vascular morbidity to be different between two groups. Case control studies conducted with hypertensive patients showed that target organ damage was significantly greater in the patient having not nocturnal decrease (23). Whereas in prospective studies, non-decreasing nocturnal blood pressure or nocturnal blood pressure higher than daytime were found to be indepen-dent risk factors for cardiovascular disease (24-26). Arterial hypertension is an important risk factor in development of AF (14). Increased atrial tension may lead to structural alterations such as disorganization in the myocardial fibers and fibrosis in hypertension (11, 12). Furthermore, levels of plasma renin, nor-epinephrine and angiotensin II increase in pre-hypertension and hypertension (27, 28). Angiotensin and catecholamines cause
development of fibrosis in atrium and a heterogeneous and dif-ferent conduction. Previous studies reported that atrial ischemia may develop in hypertension (29). Deceleration in the ischemic area lead to elektrical instability in atrial myocard (13, 30). This situation was reported may increase inter-atrial and intra-atrial conduction time (maxium P wave time) and P dispersion may increase. P wave dispersion is an important non-invasive ECG marker indicating heterogeneity of intra-atrial conduction. Dilaveris et al. (31) investigated for the first time the correlation between Pd and development of AF in hypertensive patients and found that development of AF was higher in the group with higher Pd. In a study by Aytemir et al. (9), P wave dispersion was reported to be a predictor of atrial fibrillation in hypertensive patients. In another study, P wave dispersion was reported to show prolongation in 19 hypertensive patients who developed atrial fibrillation compared to 78 hypertensive patient who did not develop AF at the end of 2-year follow-up period (32). Unlike these studies, in our study hypertensive patients were com-pared as dipper and non-dipper. P wave dispersion and Pmax time were found to increase and Pmin time to decrease in non-dipper hypertensive group. Compensatory wall hypertrophy resulted from the increased pressure load in systemic hyperten-sion causes prolongation of ventricular relaxation and flexibility and diastolic dysfunction (33). Increased end-diastolic pressure may develop direct atrial pumu dysfunction in diastolic dysfunc-tion. This physiopathologic condition causes an increase in the atrial volum and tension. Increased atrial tension stimulates collagen synthesis in the atrial myocytes, causing fibrosis and hypertrophy. Resultant hypertrophy and fibrosis exacerbate symptoms of arrhythmia and diastolic heart failure. This vicious circle may explain the mechanism of AF development in hyper-tension (34, 35). In a study by Tsai et al. (36) P wave dispersion was demonstrated to be correlated with increased volum index and development of diastolic dysfunction in hypertensive patients. Numerous studies reported that frequency of SVH and SVDFB was higher in NDHT patients than in DHT patients (17, 18). Ferrara et al. (37) found that E wave velocity and E/A ratio decreased in both DHT and NDHT patient groups, while A wave velocity sig-nificantly increased only in NDHT group. In this study, we found that DT, IVRT and left atrial diameter significantly increased in the non-dipper hypertensive group compared to the dipper hypertensive group. Again we found a significant correlation between P wave dispersion and interventricular septum
thick-Control (n=40) Group 1 (n=40) Group 2 (n=40) P1 P2 P3
Mean±SD Mean±SD Mean±SD
Heart rate, bpm 7.2±3.1 70.2±3.6 70.7±3.8 0.362 0.435 0.570
P maximum, msn 102.1±6.6 111.1±5.8 115.1±5.6 >0.01 >0.01 0.03
P minimum, msn 68.3±6.1 62.3±5.3 59.2±5.6 >0.01 >0.01 0.009
P dispersion, msn 36.4±6.9 49.1±5.3 56.1±5.6 >0.01 >0.01 >0.01
P1- Control group versus Group I, P2- control group versus Group II, P3- C-group I versus Group II Data are presented as mean±SD (percentage)
Table 3. Electrocardiographic parameters of study patients
LVMi LAd DT IVRT E/A IVS P dispersion r 0.412 0.769 0.210 0.290 0.477 0.230
p 0.011 0.033 0.052 0.009 -0.081 0.04
DT - deceleration time, IVRT - isovolumetric relaxation time, IVS - interventricular septum, LAD-left atrium diameter, LVMi - left ventricular mass index
Pearson correlation analysis
Table 4. Relationship of P wave dispersion with echocardiographic parameters
ness, IVRT and DT that are among echocardiographic parame-ters. Therefore, persistence of distolic dysfunction was found to be an important clinical variable determining P wave dispersion.
Study limitations
Possible limitations of the present study are: First, the study was conducted in a single center and included only a small number of patients. Second, cytokines related to inflammation were not investigated. Several previous studies demonstrated increased inflammation in the non-dipper hypertension com-pared to the dipper hypertension. Third, we did not perform an analysis to prognostic value of Pd. However, the correlation between Pd and AF has been shown in the previous studies.
Conclusion
In conclusion, in the present study, we found that the levels of Pd and Pmax were increased in the non-dipper compared with dipper group and these changes were related to LV dysfunction. With this study, we demonstrated that hypertensive patients having prolonged Pd and Pmax values might be the patients without a sufficient nocturnal fall. We believe that administra-tion of more aggressive anti-HT therapies to provide a circadian rhythm could decrease the risk for AF. Of course further pro-spective multicenter randomized controlled studies are needed to confirm this and to verify this hypothesis.
Conflict of interest: None declared. Peer-review: Externally peer-reviewed.
Authorship contributions: Concept - A.R.T.; Design - A.R.T, S.A.; Supervision - Y.K.; Resource- O.A., C.B.A.; Materials - M.Ö.; Data collection&/or Processing - M.Ö., M.S.; Analysis &/or inter-pretation - A.R.T., C.B.A.; Literature search - C.B.A., T.I.;Writing - A.R.T.; Critical review - T.I., S.A.; Other - M.S., O.A.
References
1. Fujii T, Uzu T, Nishimura M, Takeji M, Kuroda S, Nakamura S, et al. Circadian rhythm of natriuresis is disturbed in non-dipper type of essential hypertension. Am J Kidney Dis 1999; 33: 29-35.
2. Shimada K, Kario K. Altered circadian rhythm of blood pressure and cerebrovascular damage. Blood Press Monit 1997; 2: 333-8. 3. Timio M, Venanzi S, Lolli S, Lippi G, Verdura C, Monarca C, et al.
“Non-dipper” hypertensive patients and progressive renal insufficiency: a 3-year longitudinal study. Clin Nephrol 1995; 43: 382-7.
4. Verdecchia P, Porcellati C, Schillaci G, Borgioni C, Ciucci A, Battistelli M, et al. Ambulatory blood pressure. An independent predictor of prognosis in essential hypertension. Hypertension 1994; 24: 793-801.
5. Ohkubo T, Hozawa A, Yamaguchi J, Kikuya M, Ohmori K, Michimata M, et al. Prognostic significance of the nocturnal decline in blood pressure in individuals with and without high 24-h blood pressure: the Ohasama study. J Hypertens 2002; 20: 2183-9.
6. Vigushin DM, Pepys MB, Hawkins PN. Metabolic and scintigraphic studies of radioiodinated human C-reactive protein in health and disease. J Clin Invest 1993; 91: 1351-7.
7. Yılmaz R, Demirbağ R. P-wave dispersion in patients with stable coronary artery disease and its relationship with severity of the disease. J Electrocardiol 2005; 38: 279-84.
8. Özer N, Aytemir K, Atalar E, Sade E, Aksöyek S, Övünç K, et al. P wave dispersion in hypertensive patients with paroxysmal atrial fibrillation. Pacing Clin Electrophysiol 2000; 23: 1859-62.
9. Aytemir K, Özer N, Atalar E, Sade E, Aksöyek S, Övünc K, et al. P wave dispersion on 12-lead electrocardiography in patients with paroxysmal atrial fibrillation. Pacing Clin Electrophysiol 2000; 23: 1109-12.
10. Turhan H, Yetkin E, Senen K, Yılmaz MB, İleri M, Atak R, et al. Effects of percutaneous mitral balloon valvuloplasty on P-wave dispersion in patients with mitral stenosis. Am J Cardiol 2002; 89: 607-9. 11. Turhan H, Yetkin E, Atak R, Altınok T, Senen K, Ileri M, et al.
Increased p-wave duration and p-wave dispersion in patients with aortic stenosis. Ann Noninvasive Electrocardiol 2003; 8: 18-21. 12. Senen K, Turhan H, Rıza Erbay A, Başar N, Saatçi Yaşar A, Şahin O,
et al. P-wave duration and P-wave dispersion in patients with dilated cardiomyopathy. Eur J Heart Fail 2004; 6: 567-9.
13. Lammers WJ, Kirchhof C, Bonke FI, Allessie MA. Vulnerability of rabbit atrium to reentry by hypoxia. Role of inhomogeneity in conduction and wavelength. Am J Physiol 1992; 262: 47-55. 14. Kannel WB, Wolf PA, Benjamin EJ, Levy D. Prevalence, incidence,
prognosis, and predisposing conditions for atrial fibrillation: population-based estimates. Am J Cardiol 1998; 82: 2-9.
15. Aydın M, Özeren A, Bilge M, Dursun A, Cam F, Elbey MA. Effects of dipper and non-dipper status of essential hypertension on left atrial mechanical functions. Int J Cardiol 2004; 96: 419-24.
16. Ermiş N, Açıkgöz N, Cuğlan B, Cansel M, Yağmur J, Taşolar H, et al. Comparison of atrial electromechanical coupling interval and P-wave dispersion in non-dipper versus dipper hypertensive subjects. Blood Press 2011; 20: 60-6.
17. Slama M, Susic D, Varagic J, Frohlich ED. Diastolic dysfunction in hypertension. Curr Opin Cardiol 2002; 17: 368-73.
18. Seo HS, Kang TS, Park S, Choi EY, Ko YG, Choi D, et al. Non-dippers are associated with adverse cardiac remodeling and dysfunction (R1). Int J Cardiol 2006; 112: 171-7.
19. European Society of Hypertension-European Society of Cardiology Guidelines Committee. 2003 European Society of Hypertension-European Society of Cardiology guidelines for the management of arterial hypertension. J Hypertens 2003; 21: 1011-53.
20. DeMaeyer EM, Dallman P, Gurney JM, Hallberg L, Sood SK, Srikantia SG. The prevalence of anaemia in the world. Preventing and controlling iron deficiency anaemia through primary health care: a guide for health administrators and programme managers WHO Geneva, Switzerland. 1989: 5-58.
21. American Diabetes Association. Diagnosis and classification of diabetes mellitus. Diabetes Care 2013; 36: 67-74.
22. Schiller NB, Shah PM, Crawford M, De Maria A, Devereux R, Feigenbaum H, et al. Recommendations for quantitation of the left ventricle by two-dimensional echocardiography. American Society of Echocardiography Committee on Standards, Subcommittee on Quantitation of Two-Dimensional Echocardiograms. J Am Soc Echocardiogr 1989; 2: 358-67.
23. Kobrin I, Oigman W, Kumar A, Ventura HO, Messerli FH, Frohlich ED, et al. Diurnal variation of blood pressure in elderly patients with essential hypertension. J Am Geriatr Soc 1984; 32: 896-9.
24. Verdecchia P, Schillaci G, Borgioni C, Ciucci A, Gattobigio R, Guerrieri M, et al. Altered circadian blood pressure profile and prognosis. Blood Press Monit 1997; 2: 347-52.
25. Verdecchia P, Schillaci G, Guerrieri M, Gatteschi C, Benemio G, Boldrini F, et al. Circadian blood pressure changes and left ventricular hypertrophy in essential hypertension. Circulation 1990; 81: 528-36.
26. Verdecchia P, Porcellati C, Schillaci G, Borgioni C, Ciucci A, Battistelli M, et al. Ambulatory blood pressure. An independent predictor of prognosis in essential hypertension. Hypertension 1994; 24: 793-801.
27. Cheema AN, Ahmed MW, Kadish AH, Goldberger JJ. Effects of autonomic stimulation and blockade on signal-averaged P wave duration. J Am Coll Cardiol 1995; 26: 497-502.
28. Coumel P. Paroxysmal atrial fibrillation: a disorder of autonomic tone? Eur Heart J 1994; 15: 9-16.
29. Calhoun DA, Bakir S, Oparil S. Etiology and pathogenesis of essential hypertension. Editors; Crawford MH, DiMarco JP. Cardiology. Mosby 2001 London pp. 3 1.1-3 1.10.
30. Fareh S, Villemaire C, Nattel S. Importance of refractoriness heterogeneity in the enhanced vulnerability to atrial fibrillation induction caused by tachycardia-induced atrial electrical remodeling. Circulation 1998; 98: 2202-9.
31. Dilaveris PE, Gialafos EJ, Andrikopoulos GK, Richter DJ, Papanikolaou V, Poralis K, et al. Clinical and electrocardiographic predictors of recurrent atrial fibrillation. Pacing Clin Electrophysiol 2000; 23: 352-8.
32. Ciaroni S, Cuenoud L, Bloch A. Clinical study to investigate the predictive parameters for the onset of atrial fibrillation in patients with essential hypertension. Am Heart J 2000; 139: 814-9.
33. Tigen K, Karaahmet T, Fotbolcu H, Gürel E, Çevik C, Geçmen C, et al. The influence of dipper and non-dipper blood pressure patterns on left ventricular functions in hypertensive patients: a tissue Doppler study. Turk Kardiyol Dern Ars 2009; 37: 101-6.
34. Brilla CG, Funck RC, Rupp H. Lisinopril-mediated regression of myocardial fibrosis in patients with hypertensive heart disease. Circulation 2000; 102: 1388-93.
35. Mattioli AV, Bonatti S, Monopoli D, Zennaro M, Mattioli G. Left atrial remodelling after short duration atrial fibrillation in hypertrophic hearts. Heart 2005; 91: 91-2.
36. Tsai WC, Lee KT, Wu MT, Chu CS, Lin TH, Hsu PC, et al. Significant correlation of P-wave parameters with left atrial volume index and left ventricular diastolic function. Am J Med Sci 2013; 346: 45-51. 37. Ferrara AL, Pasanisi F, Crivaro M, Guida L, Palmieri V, Gaeta I, et al.
Cardiovascular abnormalities in never-treated hypertensives according to non-dipper status. Am J Hypertens 1998; 11: 1352-7.