J. Phys. D: Appl. Phys. 53 (2020) 23LT03 (6pp) https://doi.org/10.1088/1361-6463/ab7e63
Crossed chiral band approximation for
wide-band self-collimation of light
Melike A Gumus
1
, Onder Akcaalan
2and Hamza Kurt
11Department of Electrical and Electronics Engineering, TOBB University of Economics and Technology,
Ankara 06560, Turkey
2Department of Physics, Bilkent University, Ankara 06800, Turkey
E-mail:[email protected]
Received 10 October 2019, revised 13 February 2020 Accepted for publication 10 March 2020
Published 7 April 2020
Abstract
We propose a perspective to the evaluation of the wide bandwidth phenomenon for low-symmetric photonic structures, by introducing the band tailoring and chiral band
approximation on the self-collimation effect. In the case of the crossing of the bands, we claim the excitation of the lower mode can provide the utilization of the entire bandwidth by suppressing the intersection regions where the frequencies tend to mix. Thereby, we design broadband self-collimation capable, defect-free photonic structures and examine their performances. A fractional bandwidth of 0.35 (a/λ = 0.429− 0.607) and 0.37
(a/λ = 0.481− 0.701) are achieved for radii of r = 0.25a and r = 0.23a, respectively. We explore the full-range collimation by using transmission and E-field intensity analyses in addition to band diagrams and group velocity dispersions. Moreover, we indicate all-angle collimation validity even for highly tilted sources up to an angle of 80◦.
Keywords: self-collimation, dispersion, photonic-crystals (Some figures may appear in colour only in the online journal)
1. Introduction
Photonic crystals (PhCs) are structures that provide light propagation control by refractive index modulation [1, 2]. Due to their scalability, these structures can be studied at many different wavelengths for photonic researchers. Dur-ing PhC investigations, some peculiar light properties, such as super-prism [3], high-quality factor cavity [4], and self-collimation [5] have been discovered. Considering the invest-igations in terms of applications, it can be claimed that each phenomenon can be utilized for a device such as wavelength-division multiplexers (super-prism), sensors (cavity), photonic integrated circuits (self-collimation). The usage of these prop-erties brings along some common operational constraints and figures of merit. Bandwidth (BW) is one of these figures of merit because of the fact that it can provide information about the working interval of a phenomenon for photonic applications. One can say that the wider BW means more operating frequency to process data. As a simple math-ematical description, the division of the interval between ending and beginning frequencies to the center frequency
describes the fractional bandwidth (FBW). In this point of view, the FBW can be determined through the band dia-gram branches and equi-frequency contours (EFCs) which give direct information of the light propagation in the fre-quency domain. The utilization of BW on self-collimation ability can be exemplified by investigations on hybrid plas-monic PhCs [6], flat band localization [7], and diffraction management [8].
In the present work, C2 symmetric PhC structures are investigated in terms of wide-band self-collimation ability. In section2.1, by utilizing the rotation and radius diversity fea-tures of low-symmetry, band tailoring has been performed to achieve the ideal operating case. Thus, the appropriate config-uration for the widest bandwidth has been determined. Also, the crossed chiral band approximation has been introduced. In section2.2, the group velocity dispersion (GVD) analyses are performed to track the self-collimation ability of the presen-ted structures. Section2.3details the E-field intensity results by focusing on light propagation. Section 2.4discusses the all-angle self-collimation performance of the proposed struc-ture through tilted sources. The conclusions of the presented
work are given in section 3. The validity of the proposed approximation in the study is supported through plane wave expansion (PWE) analyses and finite-difference-time-domain (FDTD) method.
2. Numerical investigations of proposed structures 2.1. Proposed designs and WBW focused frequency domain analysis for band structure investigation
The time and frequency domain analysis investigations have been performed to achieve more information about the light propagation in a PhC structure. In this study, the self-collimation phenomenon, which is widely used for various photonic applications [9–11], is chosen to investigate the BW characteristics of symmetry reduced PhCs. This is because it provides a comprehensive analysis opportunity by employ-ing EFC and band diagram. Consideremploy-ing EFCs, flat contours give insight into the collimated light propagation of a struc-ture. Due to the Poynting vector (group velocity) conservation rules, a vector that comes across to the normal of a flat con-tour goes on its way without any deflection [12]. This means that the lateral light deflection can be prevented under the case of flat contour frequency [13,14]. In terms of complete flat EFCs, linear frequency alterations (increasing or decreasing) are observed with a constant slope of frequency along the Γ− X direction. However, the frequency slope is zero along the X− M direction. These conditions mean that the light has a self-collimation tendency for all incident angles from zero to 90◦. Meanwhile, it is expected that the M− Γ direction has the same attitude (constant slope but opposite sign) with the Γ− X direction in terms of frequency. Considering the band, the mentioned flatness corresponds to a branch–flat–branch (B–F– B) manner throughout the Γ− X − M − Γ direction. The dense frequencies on the EFCs are observed as high-slope branches in the band diagrams and they correspond to a wider BW with respect to other band structures.
Furthermore, the mentioned B–F–B tendency reveals a chiral band relation between two adjacent bands, which super-impose along the X− M direction. Thus B–F–B enables a sig-nificant BW addition to the all-angle property. This combined and well-performed band structure has been named as the
chiral band in this study, see figure1(c). To achieve that kind of fully adequate band, there is a need to control the band branch behavior. Low-symmetric structures allow a more controllable mechanism that provides more degree of freedom. Here, we choose to direct the structural investigations towards C2 sym-metric configuration because of its simplicity [15]. The men-tioned C2 symmetric configuration enables to distribute the dielectric density by altering its location or radius. In this way, the diversity of dielectric density leads to control of branch behavior and relatedly the operating frequency interval. At this point, it should be remarked that each of the frequency domain analysis is performed in MATLAB [16]. Throughout these analyses, the eigenvalue problems are solved by way of PWE method as mentioned in our previous studies [15,17]. The first step to band investigations is the alteration of the rotation angle
θrot= 0◦, 30◦, 60◦, 90◦of the elements in the unit cell for the
3rd TM band along the Γ− X direction in the vicinity of the Γ symmetry point. In this condition, taking the filling ratio (0.3927) constant for each unit cell, we alter the rotation angle by reference to the center of the cell. Then the configurations are compared, and a convenient unit cell with the highest FBW value is chosen for promising self-collimation. An inverse pro-portional relation between the rotation angle of the rods and slope of the branches is observed. According to the result, the rotation angle θrot= 0◦corresponds to the highest FBW value,
see the upper part of figure1(a). The second step is to change the element radii to obtain the highest FBW value once again. In this step, while the rotation angle is θrot= 0◦, the radii
are altered as r = 0.05ar1, 0.10ar2, 0.15ar3, 0.20ar4, 0.25ar5,
where a is a lattice constant. The radii alteration is performed without changing the center points of elements as seen in the lower part of figure1(a). Increasing the filling factor causes the dispersion branch to positioned along at a lower frequency interval. Thereby, it is proved that the band tailoring is pos-sible by changing the filling ratio in the unit cell. When the altered radii are compared, it is observable the high FBW value is obtained for r5= 0.25a radii rods that position to each
other with θrot= 0◦rotation angle. Thereby, the optimum unit
cell is determined. The structure which is designed by util-izing the mentioned unit cell is shown in figure 1(b), it has the extends for x and y-axes x = 40a, y = 10a, respectively. The unit cell consists of rod type alumina dielectrics with
ε = 9.8 in a square-lattice, an extended depiction of the unit
cell is shown as an inset in figure 1(b). In order to achieve the chiral band structure mentioned above, additional fine-tuning is performed in terms of radii, and finally, a perfect
chiral band is obtained for r = 0.23a. Since reducing the radii
of the elements in the unit cell causes a smaller filling ratio with respect to r = 0.25a, the bands are observed at higher frequencies. A comparison between two different radii can be seen in figure1(c). According to figure1(c), r = 0.23a and r = 0.25a radii configurations behave as chiral (symmetric) and
chiral-like (nearly symmetric) bands, respectively. Also, in
figure1(c) some remarkable representations can be seen such as wide bandwidth region (WBW) and superimpose region. The mentioned regions identify the mirror-symmetric posi-tioning and superposition of the adjacent bands, respectively. Adjacent bands are symmetric with respect to mirror lines which consist of superimposed region and divide the WBW region into equal (chiral) or nearly equal parts (chiral-like) in terms of frequency. The branches extend across the Γ− X dir-ection and provide ~0.36 FBW which is a satisfactory result. Considering the other bands besides chiral ones, a compre-hensive explanation for band behaviors can be attained. The 2D and 3D versions of TM band diagrams of r = 0.25a and r = 0.23a are illustrated in figures1(d) and (e), respectively. Here, the 3D presentation focuses on the bands from the 3rd to 7th along the Γ− X direction that is the investigation direction of self-collimation. When two different radii configurations are compared, it is seen that the bands show similar characteristics, but the drastic change occurs for bands of (3rd–6th)/(3rd–7th) for (r = 0.25a)/ (r = 0.23a) with respect to the Γ symmetry point. For the configurations of r = 0.23a and r = 0.25a, there are three and two crossing points, respectively. These crossing
points cause intersected frequency regions, which include the same frequencies on the bands. As a consequence of band crossing, some light propagation disturbances may occur in this intersection regions due to mixed modes.
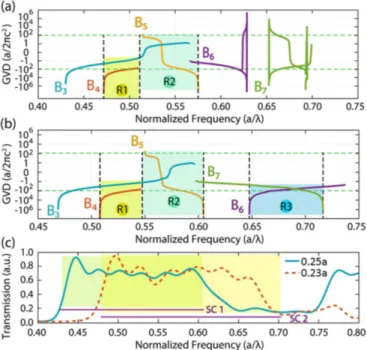
2.2. WBW focused frequency domain analysis for GVD investigation
In order to estimate the dispersion of the propagating light within the structure, GVD analyses are performed. There-fore, another indicator of self-collimation property is GVD analysis as well. The relation between GVD, dispersion dia-gram and self-collimation can be explained as follows; a lin-ear dispersion branch has a constant slope which states the
k-vector components are not affected by altering
frequen-cies. This relation prevents the different speed of k-vector components and de-phasing, thus, results in self-collimation [18, 19]. As a simple mathematical definition, the GVDs which are calculated for each structure through the relation of GVD = ∂/∂w (1/vg) = ∂2k/∂w2. The equation indicates
that GVD is the frequency-dependent group velocity altera-tion, and this dependency induces beam broadening caused by phase shifts on wave vector. The fact the light does not broaden over time is an indication of self-collimation. Thus, GVD values are expected to be at the vicinity of zero. Here, GVD values are shown on a logarithmic scale, this pref-erence annihilates the demonstration limitation and enables a wider scale investigation of the full frequency range, see figures2(a) and (b). GVD values are reasonable for a big por-tion of the BW for mainly investigated bands (3rd and 6th bands for r = 0.25a, 3rd and 7th bands for r = 0.23a). How-ever, some large GVD values at the beginning frequencies of intersection region 1 (R1) GVDr=0.25a=−108/GVDr=0.23a=
−108 and ending frequencies of intersection region 2 (R2) GVDr=0.25a=−107/GVDr=0.23a=−107, have been
determ-ined. Additionally, an intersection region represented as R3 emerges for r = 0.23a structure. This region has a large GVD value of GVDr=0.23a=−107 at the beginning
fre-quencies, as in the other regions. The emergence of a new intersection region provides an opportunity for structure comparison.
Despite the common idea, deciding about the propagation of light by only applying to the GVD is a limited perspective. GVD is the second derivative of the band diagram hence, there is a direct relation between GVD and band diagram. There-fore, a missing point in the band diagram will be valid for the GVD as well. In such cases, time-domain analysis can be used as supportive of the frequency domain analysis. Sometimes, large GVD values can be deceptive, it should be remarked that even if the GVD may diverge to higher values, the structure may keep the collimation ability at acceptable level. Our study emphasizes that the effects of the other crossing modes can be suppressed by proper excitation of the low order mode through the Gaussian source type [20]. Thereby, encountered mixed modes problems can be eliminated and the entire BW can be exploited. In figures2(a) and (b), each line demonstrates the calculated GVD values of the dispersion bands. Shaded parts on bands correspond to frequency intersection regions, and the
horizontal dashed lines are the limits of the region that the self-collimation phenomenon is valid.
The valid collimation region should be determined accord-ing to the field intensity profiles besides transmission ana-lysis with adequate data points. Although GVD is quite high for crossing points, high transmission appears on the entire frequency range without any interruption, according to figure2(c), hence our claim is supported. In figure2(c), the transmission results do not indicate any drop points which means dispersion bands are definitely crossing without any gap. Transmission shows that a good self-collimation ability for the entire frequency interval which is illustrated by green and yellow shaded rectangles for r = 0.25a and r = 0.23a, respectively. For both configurations, the average transmis-sion is 70% and starts to decline at the frequencies which are approaching the edges of the operation frequency inter-val. This information supports our chiral band approximation by providing ~0.36 wide FBW and strengthens the low order mode excitation approach, which is not influenced by the inter-section distortion.
2.3. WBW focused time domain analysis for self-collimation phenomenon
The field intensity profile is a useful tool to track light propagation visually. In order to strengthen the approach, the light propagation in the structure is examined in terms of E-field intensity profiles as well as transmission. E-field investigations have been performed by utilizing the FDTD method with LUMERICAL software [21]. Sampling fre-quencies are a0.25/λ = 0.429, 0.434, 0.500, 0.595, 0.607 and a0.23/λ = 0.481, 0.491, 0.601, 0.691, 0.701, which refer to
the chosen self-collimation stages. Additionally, selected fre-quencies, which are clarifying that the modes do not mix in the intersection region are a0.25/λ = 0.472, 0.575 and a0.23/λ =
0.508, 0.604, 0.647.
Results indicate the self-collimation effect is sustainable even for intersection regions throughout the proposed inter-val, see the results in figures3(a) and (b). To observe propaga-tion tendency, sampling frequencies have been determined from the beginning, center, and ending of the self-collimation region. Meanwhile, the adjacent frequencies are selected near the limits of the region to represent the light beha-vior as well. In the GVD investigations, the most problem-atic regions have been labeled as intersection regions. These regions are located at the beginning frequencies of R1 and R3 regions and ending frequencies of the R2 region. The inter-section frequencies are chosen as the near points of these regions. Through the selected frequencies, the light coup-ling and the strengthening process are shown step by step in the intensity profile representations. When the intensity pro-files are associated with the bands in figure1, it is seen that stronger collimation emerges for the frequencies at the lin-ear part of the branch. As seen in figure 3 more satisfying collimation is obtained for the adjacent frequencies which are relatively closer to the center of branch with respect to beginning and ending frequencies of the self-collimation region. Here, adjacent frequencies are a0.25/λ = 0.434, 0.595
Figure 1. Calculated band diagrams for ideal structure investigation regarding rotational and radii manipulations at up and down figures of (a), respectively. (b) Schematic of the self-collimation region with the unit cell projection representation. (c) Chiral-like/chiral band representation of the 3rd–6th/3rd–7th bands. (d), (e) The TM band diagrams of the ideal structure along Γ− X − M − Γ direction for r = 0.25a and r = 0.23a, respectively. Shaded parts show the intersection regions. Γ− X oriented 3D band representations are positioned nearby each diagram.
Figure 2. (a), (b) Calculated GVD characteristics along the direction of Γ− X, for r = 0.25a and r = 0.23a, respectively. B3–B7depict the calculated bands. (c) The full-range transmission
spectrum of the structure, shaded SC1 and SC2 parts indicate self-collimation regions of r = 0.25a and r = 0.23a, respectively.
and a0.23/λ = 0.491, 0.691 while beginning and ending
fre-quencies are a0.25/λ = 0.429, a0.23/λ = 0.481 and a0.25/λ =
0.607, a0.23/λ = 0.701. First, the light arrives at the
self-collimation region at the beginning frequencies then it demon-strates a reasonable self-collimation at adjacent frequencies. After that, light reaches the strongest self-collimation in the vicinity of center frequency a0.25/λ = 0.500, a0.23/λ =
0.601. Finally, it completes its propagation at the band edge by reaching the ending frequencies. At a0.23/λ = 0.691 and
Figure 3. E-field intensity profiles at the selected normalized frequencies with intersection region representations for (a) r = 0.25 and (b) r = 0.23a.
a0.23/λ = 0.701 frequencies, it undergoes localizations due
to the slow-light effect. Thereby, a peculiar self-collimated slow-light effect is observed for these frequencies which cor-respond to more flat parts of the band diagram. The results in figures3(a) and (b) prove our claim by supporting a self-collimator propagation with the widest BW range, including intersection frequencies such as a0.25/λ = 0.472, 0.575 and a0.23/λ = 0.508, 0.604, 0.647.
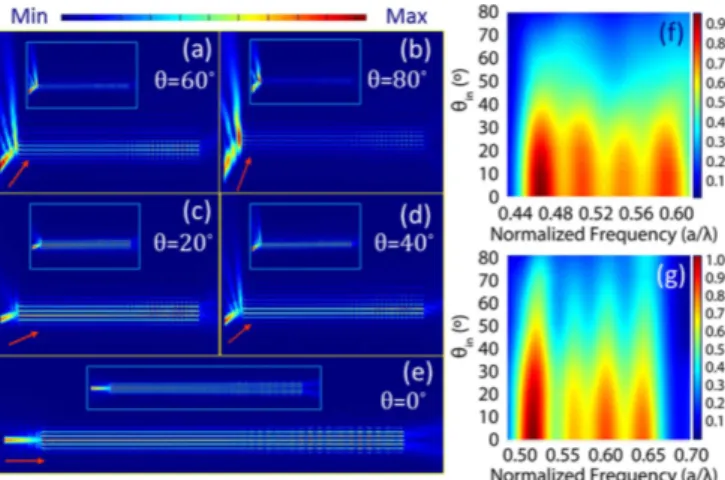
2.4. WBW focused time domain analysis for all-angle self-collimation phenomenon
Incident angle investigations can be useful to overcome source-structure alignment problems. The all-angle perform-ance gives an idea about the sensitivity of the structure to the tilted sources. In this case, the all-angle performance can be used as a supportive tool for device application idea [14]. In the study, the field intensities are performed for
Figure 4. E-field intensity profiles for tilted source at a0.25/λ = 0.500 and a0.23/λ = 0.601(inset) normalized
frequencies. (a)–(e) Sources at θsource= 0◦, 20◦, 40◦, 60◦, 80◦tilt
angles, respectively. Transmission maps of the structures in terms of the incident angles θsource= 0◦, 20◦, 40◦, 60◦, 80◦and normalized
frequencies which indicate the intervals of their self-collimation regions for the cases of (f) r = 0.25a and (g) r = 0.23a.
θsource= 0◦, 20◦, 40◦, 60◦, 80◦sources, and results have veri-fied the self-collimation, see figures 4(a)–(e), respectively. According to the achieved results, the self-collimation beha-vior is valid even for huge source angles for both structures. Here, a0.25/λ = 0.500 and a0.23/λ = 0.601, each of which
is the center frequencies for their frequency intervals, have been chosen as the operating frequencies for all-angle self-collimation investigations. The results are quite similar for both structures at each tilted angle illustration. Even though coupling performance decreases proportionally with increas-ing tilt angles, our structure provides good couplincreas-ing and maintains collimation ability. Nevertheless, the coupling per-formance of light to the structure can be improved by using anti-reflection elements such as smaller dielectric rods [22]. When the transmissions of the tilted sources are investigated, it can be claimed that some coupling issues become more apparent. The transmission results for all-angle are given in figures4(f) and (g). The transmission maps indicate their max-imum values of 92% and 95% for r = 0.25a and r = 0.23a, respectively at θsource= 0◦. These values decrease to T0.25a=
26% and T0.23a= 12% for a minimum transmission.
Addi-tionally, the minimum values emerge at θsource= 80◦as
expec-ted for both structures due to the strong back-reflections at the interface of structures. For each frequency value, all trans-mission values ranging from 0◦ to 80◦ fall to approximately their 1/3rd value. Thereby, values are obtained as approxim-ately maximum T0.25a= 35% and minimum T0.23a= 3% for θsource= 80◦.
3. Conclusion
As a conclusion, a WBW approach has been emphasized by exploiting the self-collimation phenomenon in this study. The first optimization has been performed on rotation and radii of
the high-symmetric unit cell elements. Thus, the most con-venient band tendency has been obtained by band tailoring along the Γ− X direction. Then, two convenient configur-ations that show chiral-like and chiral behavior, have been selected due to comparable band characteristics. According to the GVD results, it has been estimated that band crossing parts may be problematic for the continuity of the self-collimation properly. Nevertheless, when FDTD analyses are conducted for the transmission and the field intensity profiles of both structure, it has been observed that the self-collimation effect has not been destroyed for intersection regions. After that, by determining the self-collimation according to the E-field pro-files the collimation interval has been identified as a0.25/λ =
0.429− 0.607 and a0.23/λ = 0.481− 0.701. According to the
reasonable transmission results, which fluctuate in the vicin-ity of 70% for both configurations, the self-collimation region has ~0.36 FBW value and they have been supported by E-field intensity profiles. To show the all-angle ability, sources with the following tilted angles, θsource= 0◦, 20◦, 40◦, 60◦, 80◦
have been chosen and the results indicated the validity of the self-collimation also for large tilted sources. It means that the designed structures have sufficient transmission values for the annihilation of the alignment problem. Thereby, one can claim for our design that the collimation is independent of the incidence angle. Analysis proves that the designed structures provide the widest bandwidth self-collimation by protecting its high transmission in a big portion of the full operation range due to its chiral property in spite of the band-crossing. Consid-ering the features of the presented photonic crystal structures, one can claim that they can be useful for optical interconnects, bends/splitters, optical-switches, and logic gates.
Acknowledgments
The authors M A Gumus and H Kurt acknowledge funding of the Scientific and Technological Research Council of Turkey (TUBITAK) with Project No. 115R036. H Kurt also acknow-ledges the partial support of the Turkish Academy of Sciences (TUBA).
ORCID iD
Melike A Gumushttps://orcid.org/0000-0003-2675-5893
References
[1] Yablonovitch E 1987 Inhibited spontaneous emission in solid-state physics and electronics Phys. Rev. Lett.58 2059 [2] John S 1987 Strong localization of photons in certain
disordered dielectric superlattices Phys. Rev. Lett.58 2486 [3] Kosaka H, Kawashima T, Tomita A, Notomi M, Tamamura T,
Sato T and Kawakami S 1998 Superprism phenomena in photonic crystals Phys. Rev. B58 R10096
[4] Akahane Y, Asano T, Song B S and Noda S 2003 High-Q photonic nanocavity in a two-dimensional photonic crystal Nature425 944
[5] Kosaka H, Kawashima T, Tomita A, Notomi M, Tamamura T, Sato T and Kawakami S 1999 Self-collimating phenomena in photonic crystals Appl. Phys. Lett.74 1212
[6] Zhang L, Zhang W, Wang G, Li Z, Du S, Wang W, Wang L, Sun Q and Zhao W 2018 Broadband self-collimating phenomenon in a low-loss hybrid plasmonic photonic crystal Appl. Opt.57 829
[7] Myoung N, Park H C, Ramachandran A, Lidorikis E and Ryu J W 2019 Flat-band localization and self-collimation of light in photonic crystals Sci. Rep.9 2862
[8] Garanovich I L, Sukhorukov A A and Kivshar Y S 2006 Broadband diffraction management and self-collimation of white light in photonic lattices Phys. Rev. E74 066609 [9] Yu X and Fan S 2003 Bends and splitters for self-collimated
beams in photonic crystals Appl. Phys. Lett.83 3251 [10] Prather D W, Shi S, Murakowski J, Schneider G J,
Sharkawy A, Chen C, Miao B and Martin R 2007 Self-collimation in photonic crystal structures: a new paradigm for applications and device development J. Phys. D: Appl. Phys.40 2635
[11] Zhao D, Zhou C, Gong Q and Jiang X 2008 Lasing cavities and ultra-fast switch based on self-collimation of photonic crystal J. Phys. D: Appl. Phys.41 115108
[12] Wu Z H, Xie K, Yang H J, Jiang P and He X J 2012 All-angle self-collimation in two-dimensional rhombic-lattice photonic crystals J. Opt.14 015002
[13] Giden I H, Turduev M and Kurt H 2013 Broadband super-collimation with low-symmetric photonic crystal Photonics Nanostruct. Fundam. Appl.11 132
[14] Hamam R E, Ibanescu M, Johnson S G, Joannopoulos J D and Soljaci´c M 2009 Broadband super-collimation in a hybrid photonic crystal structure Opt. Express17 8109
[15] Gumus M, Giden I H and Kurt H 2018 Broadband self-collimation in C2 symmetric photonic crystals Opt. Lett.43 2555
[16] MATLAB 2010 version 7.10.0 (R2010a) (Natick, MA: The MathWorks) (https://www.mathworks.com/ products/matlab.html)
[17] Gumus M, Giden I H, Akcaalan O, Turduev M and Kurt H 2018 Enhanced superprism effect in symmetry reduced photonic crystals Appl. Phys. Lett.113 131103 [18] Chung K B 2011 Propagation of self-collimated ultrashort
pulses in a hybrid photonic crystal Opt. Express 19 15705
[19] Herrero R, Botey M and Staliunas K 2014
Nondiffractive-nondiffusive beams in complex crystals Phys. Rev. A89 063811
[20] Zhou W and Huang X G 2013 Long-range air-hole assisted subwavelength waveguides Nanotechnology24 235203 [21] Lumerical Solutions, Inc. software (http://www.lumerical.
com/tcad-products/fdtd/)
[22] Li M, Li W, Huang H, Wang J, Li Y, Wu A, Sheng Z, Wang X, Zou S and Gan F 2015 All-angle quasi-self-collimation effect in a rod-type silicon photonic crystal IEEE Photonics J. 7 1