CONTRIBUTION OF TOLL-LIKE RECEPTORS TO MESENCHYMAL STEM CELL DIFFERENTIATION AND IMMUNOMODULATION
A THESIS SUBMITTED TO
THE DEPARTMENT OF MOLECULAR BIOLOGY AND GENETICS AND THE INSTITUTE OF ENGINEERING AND SCIENCE OF
BILKENT UNIVERSITY
IN PARTIAL FULFILLMENT OF THE REQUIREMENTS FOR THE DEGREE OF MASTER OF SCIENCE
By
İBRAHİM FIRAT TAŞ AUGUST 2010
I certify that I have read this thesis and that in my opinion it is fully adequate, in scope and in quality, as a thesis for the degree of Master of Science.
Assoc. Prof. Dr. İhsan Gürsel
I certify that I have read this thesis and that in my opinion it is fully adequate, in scope and in quality, as a thesis for the degree of Master of Science.
Prof. Dr. Duygu Uçkan
I certify that I have read this thesis and that in my opinion it is fully adequate, in scope and in quality, as a thesis for the degree of Master of Science.
Prof. Dr. Mehmet Öztürk
Approved for the Institute of Engineering and Science
Director of Institute of Engineering and Science
ii
ABSTRACT
CONTRIBUTION OF TOLL-LIKE RECEPTORS TO MESENCHYMAL STEM CELL DIFFERENTIATION AND IMMUNOMODULATION
İBRAHİM FIRAT TAŞ
M.Sc. in Molecular Biology and Genetics
Supervisors: Assoc. Prof. Dr. İhsan Gürsel & Assoc. Prof. Dr. K. Can Akçalı August 2010, 96 Pages
Mesenchymal stem cells (MSC) are pluripotent progenitor cells harboring unique characteristics along with several stem cell features such as lineage dependent differentiation and self-renewal capacity. MSCs are known to induce immunomodulatory activity and homing capacity to damaged tissue sites. Such diverse capabilities of MSCs make them distinct from adult stem cells and can be harnessed in several therapeutic applications.
Toll-like receptors (TLR) can recognize conserved microbial byproducts and are mainly expressed by innate immune system cells as well as epithelial or endothelial cells. Recent findings suggest that in vitro generated MSCs express some of these pathogen recognition receptors. In our view, to broaden the breath of the therapeutic potential, TLR mediated activation of MSCs and demonstrate its impact on differentiation and immunomodulatory activity is critical.
First, bone marrow-derived MSCs were generated and characterized via their surface marker expression by FACS (CD90, CD106 and CD45) at protein level and their message transcripts by RT-PCR (CD11b, CD29, CD34, CD45, CD71, CD73, CD90 and CD166). The most abundant marker was found to be CD90 over several passages. Following determination of TLR expression profile by RT-PCR, contribution of TLR ligands addition (TLR2, TLR3, TLR7 and TLR9) to MSCs during adipogenic or osteogenic differentiation was studied. TLR3 was found to be the most abundant type over several passages. The adipogenic differentiation of rMSCs was found to be facilitated in the presence of TLR2 TLR3 and TLR7 ligands. Additionally, changes in the adipogenic and osteogenic markers (LPL, PPAR-g for adipogenesis, and ALP, OC-1, RUNX for osteogenesis) were analyzed by RT-PCR. While adipogenic markers upregulated osteogenic markers were downregulated in response to TLR ligand treatment.
The final part of this study was performed with mouse mesenchymal stem cells. In order to define the immunostimulatory/immunosuppressive potential of mouse MSCs, immunomodulatory character of MSCs were examined in the presence or absence of mouse spleen cells. Our data suggested that when mMSCs are primed with TLRL, a pro-inflammatory cascade as evidenced by increased IL-6 and IFN-γ secretion is initiated either alone or in co-culture with splenocytes.
In conclusion, TLR priming of MSCs augments their differentiation primarily into adipogenesis, and mainly these cells are immunostimulatory.
Keywords: Mesenchymal stem cells, Toll-like receptors, differentiation, immunomodulation.
iii
ÖZET
TOLL BENZERİ RESEPTÖRLERİN MEZENKİMAL KÖK HÜCRE FARKLILAŞMASINA VE İMMÜNMODÜLASYONUNA KATKILARI
İBRAHİM FIRAT TAŞ
Moleküler Biyoloji ve Genetik Yüksek Lisans
Danışmanlar: Doç. Dr. İhsan Gürsel & Doç Dr. K. Can Akçalı Ağustos 2010, 96 Sayfa
Mezenkimal kök hücreler (MKH) değişik doku tiplerine ait hücrelere farklılaşabilen ve kendini yenileme gibi çeşitli kök hücre özelliklerinin yanı sıra özgün karakteristiklere sahip çok potansiyelli öncül hücrelerdir. MKH, immün düzenleyici aktiviteyi uyarma ve yaralı dokuya göç etme özellikleri ile bilinmektedir. Bu tür farklı kapasiteleri, MKH’yi, diğer yetişkin kök hücrelerden farklı kılmakta ve terapötik uygulamalarda kullanılabilinir hale getirmektedir.
Toll-benzeri reseptörler (TBR), korunmuş mikrobiyal yan ürünleri tanımakta ve başlıca doğal bağışıklık sistemi hücreleri yanı sıra endotel veya epitel hücreleri tarafından da ifade edilmektedirler. Son bulgular, in vitro ortamda geliştirilen MKH’nin bu patojen tanıyıcı reseptörlerden bazılarını ifade ettiğini ileri sürmektedir. Görüşümüze göre, terapötik uygulamalarını genişletmek için TLR aracılıklı MKH aktivasyonu ile bu durumun hücre farklılaşma ve immün düzenleyici potansiyeli üzerine olan etkilerini araştırmak kritiktir.
İlk olarak, kemik iliği kökenli MKH geliştirildi ve yüzey işaretçilerinin ifadesi (CD45, CD90 ve CD106) FACS ile protein seviyesinde; mesaj transkriptleri (CD11b, CD34, CD45, CD71, CD73, CD90 ve CD166) RT-PCR ile karakterize edilmiştir. Hücre pasajları boyunca CD90 en bol işaretçi olarak bulunmuştur. TBR ifade profillerinin RT-PCR ile belirlenmesinden sonra; TBR ulaklarının (TBR2, 3, 7 ve 9) MKH’nin adipojenik ve osteojenik farklılaşmasına katkısı çalışılmıştır. Farklı hücre pasajlarında TBR3 en yoğun bulunan tip olarak bulunmuştur. Sıçan MKH’lerin adipojenik farklılaşmasının TBR2, TBR3 ve TBR7 ulaklarının varlığında hızlandığı bulunmuştur. Ayrıca, adipojenik ve osteojenik değişimlere özgün işaretçilerin (adipojenez için LPL, PPAR-g ile osteojenez için ALP, OC–1 ve RUNX) mesaj düzeyleri RT-PCR ile analiz edilmiştir. TBR ulaklarının muamelesine karşılık olarak adipojenik işaretçilerin ifadesi artarken osteojenik işaretçilerin ifadesi azalmıştır.
Bu çalışmanın son kısmı fare MKH’leri ile gerçekleştirilmiştir. Fare MKH’sinin immün uyarıcı/baskılayıcı potansiyelini belirlemek için fare MKH’sinin immün düzenleyici karakteri fare dalak hücreleri varlığında ve yokluğunda araştırılmıştır. Verilerimiz, fare MKH’sinin TBR işlemesiyle, yalnız olarak veya dalak hücreleriyle ko-kültür ortamında, IL-6 ve IFN-γ salınımının tanıklığında pro-inflamatuvar bir akışın başlatıldığını önermektedir.
Sonuç olarak, MKH’nin TBR işlemesi öncelikle adipojenez olmak üzere hücrelerin farklılaşmasını artırmaktadır ve temelde bu hücreler immün uyarıcıdır.
Anahtar kelimeler: Mezenkimal kök hücre, Toll-benzeri reseptör, farklılaşma, immün modülasyon
iv
v
ACKNOWLEDGEMENTS
First and foremost, I would like to thank and express my deepest appreciation to my advisors, Assoc. Prof. Dr. İhsan Gürsel and Assoc. Prof. Dr. K. Can Akçalı for giving me the opportunity to work with them during my harsh times and being excellent mentors with their intellectual and humanity manners. I am “privileged” in terms of working with such compatible and friendly scientists at the same time.
I would like to thank to my laboratory mates Gizem, Fuat and especially Tamer in Gürsel Lab for their guidance, patience and support during my experiments and providing a warm working environment in the laboratory.
Moreover, I would like to thank to Zeynep, Sumru and Fatma in Akcali Lab for their support during my studies, precious friendships and patience to my endless questions.
I would like to thank to my senior student, Fatma, for her assistance and accompany during my intensive times with my experiments.
I would like to thank to my dearest friends Gökhan and Şerif for their invaluable friendships throughout my master education and support whenever I need help with my experiments or personal issues.
I would like to thank to our department technicians, Abdullah Amca and Bilge Hanım, and animal facility employees, veterinary surgeons Burcu and Emre, who has never hesitated helping me whenever I needed a hand in the laboratory and my experiments.
I would like to thank to The Scientific and Technological Research Council of Turkey (TÜBİTAK) for their financial support throughout my thesis studies.
Without my family, their encouragement and endless love, none of these exceptional successes would have been possible. I would like to express my deepest love and gratitude for their everlasting support and faith in me throughout my entire life.
vi
TABLE OF CONTENTS
ABSTRACT...ii
ÖZET... iii
ACKNOWLEDGEMENTS ...v
TABLE OF CONTENTS ...vi
LIST OF TABLES ...x
LIST OF FIGURES ...xi
ABBREVIATIONS ...xiv
1. INTRODUCTION ...1
1.1. Mesenchymal Stem Cells ...1
1.1.1. Characterization of Mesenchymal Stem Cells ...1
1.1.2. The Mesenchymal Stem Cell Niches in Body ...2
1.1.3. Differentiation Capacity of Mesenchymal Stem Cells...3
1.1.4. Immunomodulatory Effects of Mesenchymal Stem Cells ...4
1.1.5. Potential Subpopulations of Mesenchymal Stem Cells ...5
1.1.6. Clinical Applications of Mesenchymal Stem Cells ...6
1.2. Mesenchymal Stem Cells and Toll-Like Receptors...6
1.3. The Immune System ...7
1.3.1. The Innate Immune System ...8
1.3.1.1. Pattern Recognition Receptors ...9
1.3.1.1.1. Toll-like Receptors as Pattern Recognition Receptors...9
1.3.1.1.2. Toll-Like Receptors in Innate and Adaptive Immunity ...10
1.3.1.1.2.1. The Toll-Like Receptor Family Members ...10
1.3.1.1.2.1.1. TLR1, 2 and 6 ...12
1.3.1.1.2.1.2. TLR3 ...12
vii
1.3.1.1.2.1.4. TLR5 ...14
1.3.1.1.2.1.5. TLR7 and 8 ...14
1.3.1.1.2.1.6. TLR9 ...14
1.3.1.1.2.2. Toll-Like Receptor Signaling Pathways ...16
2. AIM ...18
3. MATERIAL and METHODS...19
3.1. MATERIALS ...19
3.1.1. Reagents ...19
3.1.2. Toll-Like Receptor Ligands and Oligodeoxynucleotides ...19
3.1.3. Standart Solutions, Buffers and Culture Media ...20
3.2. METHODS ...20
3.2.1. Maintenance of animals ...20
3.2.2. Isolation and culture of Rat & Mouse Mesenchymal Stem Cells ...20
3.2.3. Cell Culture ...21
3.2.3.1. Preparation of Single Cell Suspension of Mouse Spleen Cells ...21
3.2.3.3. Adjusting the Cells Following Counting ...21
3.2.3.3. Stimulation with Toll-Like Receptor Ligands ...22
3.2.4. Quantification of Gene Expression at Transcript Level...23
3.2.4.1. Total RNA Isolation and Quantification...23
3.2.4.2. cDNA Synthesis...24
3.2.4.3. Primers Designed for RT-PCR Studies...24
3.2.4.3.1. PCR Studies for Rat and Mouse...26
3.2.4.4. Agarose Gel Electrophoresis and Quantification of Band Intensities ...27
3.2.5. Flow Cytometry ...28
3.2.5.1. Fixation of Cells...28
3.2.5.2. Cell Surface Marker Staining...28
viii
3.2.5.4. Carboxyfluorescein Diacetate Succinimidyl Ester (CFSE) Assay...29
3.2.6. Differentiation of rat Mesenchymal Stem Cells with or without Toll-Like Receptor Ligands ...30
3.2.6.1. Adipogenic Differentiation Alone or in the Presence of Toll-Like Receptor Ligands...30
3.2.6.1.1 Oil Red O Staining for Adipogenic Differentiation Assessment ...30
3.2.6.2. Osteogenic Differentiation Alone or in the Presence of Toll-Like Receptor Ligands...31
3.2.6.2.1 Alizarin Red Staining for Osteogenic Differentiation Assessment...31
3.2.7. Wound Healing ...31
3.2.8. Co-culturing of Splenocytes and mouse Mesenchymal Stem Cells with or without Toll-Like Receptor Ligands...32
3.2.9. Enzyme Linked Immunosorbent Assay (ELISA) ...33
3.2.9.1. Collection and Storage of Cell Supernatants Following Treatment with Toll-Like Receptor Ligands ...33
3.2.9.2. Cytokine ELISA...33
3.2.9.10. Statistical Analysis...34
4. RESULTS ...35
4.1. Rat Mesenchymal Stem Cells ...35
4.1.1. Characterization of Rat Mesenchymal Stem Cells ...35
4.1.1.1. Transition from Bone Marrow to Mesenchymal Stem Cells During Culturing ...35
4.1.1.2. PCR Results and Gel Images Over Passages ...37
4.1.1.2.1. CD Marker Expression Panels ...37
4.1.1.2.2. Toll-Like Receptor Expression Panels...38
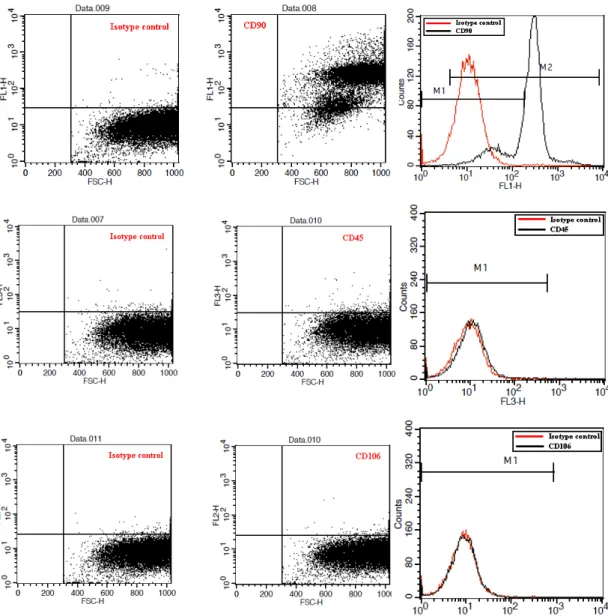
4.1.1.3. Flow Cytometry Analysis ...39
4.2. Differentiation of Rat Mesenchymal Stem Cells in the Presence or Absence of Toll-Like Receptor Ligands ...42
4.2.1. Adipogenic Differentiation Studies with rat Mesenchymal Stem Cells at Passage 0 ...42
ix
4.2.2. Adipogenic Differentiation Studies with rat Mesenchymal Stem Cells at
Passage 3 ...45
4.2.3. Adipogenic Differentiation Studies with rat Mesenchymal Stem Cells at Passage 6 and Passage 9...47
4.3. RT-PCR Analysis of Differentiation Experiments ...51
4.3.1. RT-PCR Analysis of Lineage-Specific Genes ...51
4.3.2. RT-PCR Analysis of Toll-Like Receptor Panels ...53
4.4. Migration Assay...59
4.5. Mouse Mesenchymal Stem Cells...60
4.5.1. Characterization of Mouse Mesenchymal Stem Cells ...61
4.5.1.1. PCR Results and Gel Images ...61
4.5.1.1.1. Toll-Like Receptor Expression Panels ...61
4.6. Ability of mouse Mesenchymal Stem Cells to Secrete Cytokine following Toll-Like Receptor Ligand Stimulation...62
4.7. Co-culture Studies of mouse Mesenchymal Stem Cells with mouse Splenocytes ...63 5. DISCUSSION ...66 6. FUTURE PERSPECTIVES ...71 7. REFERENCES ...73 8. APPENDICES ...88 8.1. Appendix A ...88 8.2. Appendix B-1...91 8.3. Appendix B-2 ...93 8.4. Appendix C ...96
x
LIST OF TABLES
Table 1.1: Toll-like receptors and their ligands (Adopted from Takeda and Akira,
2007 with permission)...16 Table 3.1: The final concentrations of TLR ligands and ODNs used...22 Table 3.2: Rat and mouse primer set sequences and their expected product sizes ....24
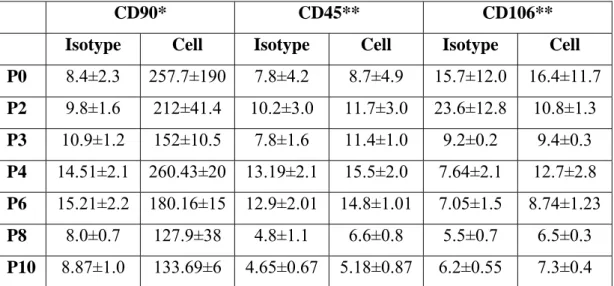
Table 3.3: Rat CD marker primer set sequences and their expected product sizes ...26 Table 3.4: PCR Reaction Ingredients and Amounts ...27 Table 3.5: PCR conditions ...27 Table 4.1: % positive of CD marker expressions at different passages...41 Table 4.2: MFI values of CD markers obtained by FACS analysis at different
passages...41 Table 4.3: Overview of the adipogenesis from MSCs treated with different TLR ligand containing adipose differentiation medium...50 Table 4.4: Effect of ligand treatment during P0 or P3 MSC differentiation into
adipocytes...56 Table 4.5: Effect of ligand treatment during P0 or P3 MSC differentiation into
osteocyte...59 Table 8.1. MSC proliferation rates after TLR ligand treatment expressing
proliferation assessed by CFSE assay...96
xi
LIST OF FIGURES
Figure 1.1: Multipotency of MSC and differentiation pathways (Adopted from
Caplan and Bruder, 2001 with permission)...3
Figure 1.2: Immunomodulatory effects of MSCs on immune system cells (Adopted from Rasmusson, 2006 with permission)...4
Figure 1.3: Localizations of Toll-like receptors and related ligands for each TLR (Adopted from Rakoff-Nahoum and Medzhitov, 2009 with permission) ...11
Figure 1.4: TLR signaling pathways (Adopted from Akira and Takeda, 2004 with permission)...17
Figure 3.1: Neubaer cell counting chamber ...22
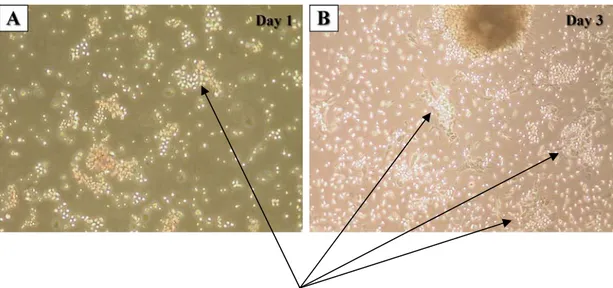
Figure 4.1A-D: Photomicrographic investigations of rat bone marrow in isolation phases (Mag = 10X)...36
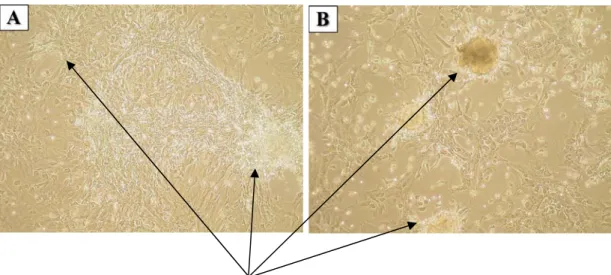
Figure 4.2A-B: Appearance of MSC colonies at different passages; left picture shows P1 MSCs, right one P2 MSCs. (Mag = 10X)...37
Figure 4.3: CD marker expression panel over passages for characterization ...38
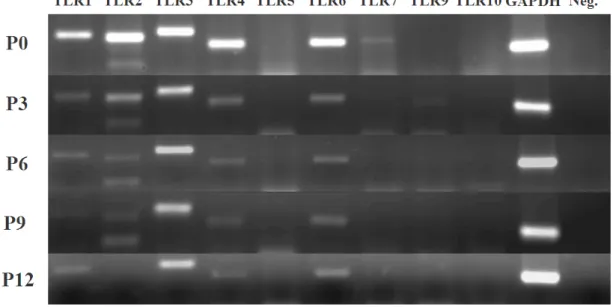
Figure 4.4: TLR expression panel over different MSC passages ...39
Figure 4.5: Representative analysis plots of CD markers for P4 ...40
Figure 4.6: P0 rMSC Oil Red O staining at the end of 1st week (Mag = 20X)...43
Figure 4.7: P0 rMSC Oil Red O staining at the end of 2nd week (Mag = 20X)...44
Figure 4.8: MSC differentiation (@P=0) in the presence or absence of TLR ligands. Culture media replenishment in two days intervals was conducted and adipogenesis was monitored by counting the cells positive for Oil Red O ...45
Figure 4.9: Kinetics of rMSC differentiation (@P3) into adipocytes in the presence or absence of TLR ligands ...45
Figure 4.10: Photomicrographs of rMSC (@P3) differentiated to adipocytes at D8 (Mag = 20X)...46
Figure 4.11: Photomicrographs of rMSC (@P3) differentiated to adipocytes at week 2 (Mag = 20X)...46
Figure 4.12: Kinetics of MSC differentiation into adipocytes at P6 in the presence or absence of TLR ligands...48
Figure 4.13: Photomicrographs of rMSC at P6 differentiating into adipocytes at week 2 (Mag = 20X)...48
xii
Figure 4.14: Kinetics of MSC differentiation into adipocytes at P9 in the presence or
absence of TLR ligands...49
Figure 4.15: Photomicrographs of rMSC at P9 differentiating into adipocytes at week 3 (Mag = 20X)...50
Figure 4.16: Adipocyte specific gene expression panels of P0 and P3 rMSCs supplemented with different TLR ligands ...51
Figure 4.17: Osteocyte specific gene expressions for P0 MSCs...52
Figure 4.18: Osteocyte specific gene expression panels of P3 rMSCs...53
Figure 4.19: TLR panels of P0 rMSCs during adipogenic differentiation...54
Figure 4.20: TLR panels of P3 rMSCs during adipogenic differentiation...55
Figure 4.21: TLR panels of P0 rMSCs during osteogenic differentiation ...57
Figure 4.22: TLR panels of P3 rMSCs during osteogenic differentiation ...58
Figure 4.23: Migration capacity of MSCs relative to MesenCult media and control group after 24 h ...60
Figure 4.24: Microscopic appearance of mouse mesenchymal stem cells at the end of 14 days of isolation period (Mag = 10X)...61
Figure 4.25: TLR panels of P0 and P1 mMSCs...62
Figure 4.26: IL-6 release results at different cell numbers for OD readings at 405 nm ...63
Figure 4.27: IL-6 production profiles of MSC-Spleen cell co-culture at different ratio ...64
Figure 4.28: IFNg production profiles of MSC-Spleen cell co-culture at different ratio ...65
Figure 8.1: CD marker expression panels over passages for characterization...90
Figure 8.2: TLR expression panels over rMSC passages ...91
Figure 8.3: Photomicrographs of rMSC (@P3) differentiated to adipocytes at D5 (Mag = 20X)...92
Figure 8.4: Photomicrographs of rMSC (@P3) differentiated to adipocytes at D11 (Mag = 20X)...92
Figure 8.5: Photomicrographs of rMSC (@P6) differentiated to adipocytes at D5 (Mag = 20X)...93
xiii
Figure 8.6: Photomicrographs of rMSC (@P6) differentiated to adipocytes at D8 (Mag = 20X)...93 Figure 8.7: Photomicrographs of rMSC (@P6) differentiated to adipocytes at D10 (Mag = 20X)...94 Figure 8.8: Photomicrographs of rMSC (@P9) differentiated to adipocytes at the end of 1st week (Mag = 20X) ...94 Figure 8.9: Photomicrographs of rMSC (@P9) differentiated to adipocytes at the end of 2nd week (Mag = 20X) ...95 Figure 8.10: Representative histograms and analysis of proliferation rate by CFSE assay. A) Naïve and B) p(I:C) treated MSCs...96
xiv
ABBREVIATIONS
ALP Alkaline phosphatase
APC Antigen presenting cell
bp Base pairs
BCR B-cell receptor
CD Cluster of differentiation
cDNA Complementary Deoxyribonucleic Acid
CpG Unmethylated cytosine-phosphate-guaniosine motifs
DC Dendritic cell
ddH2O Double distilled water
DMEM Dulbecco’s Modified Eagle Medium
DNA Deoxyribonucleic acid
dsRNA Double-stranded RNA
ELISA Enzyme Linked-Immunosorbent Assay
FACS Fluorescence Activated Cell Sorter
FBS Fetal Bovine Serum
g Grams
GvHD Graft-versus-host Disease
HSC Hematopoietic Stem Cell
ICAM Intracellular Adhesion Molecule
Ig Immunoglobulin
IL Interleukin
iNOS Inducible Nitric Oxide Synthase
IFN Interferon µg Microgram µl Microliter LBP LPS-binding protein LPL Lipoprotein LPS Lipopolysaccharide LRR Leucine-rich repeats
LTA Lipotheicoic Acid
M Molar
xv
MAP Mitogen-activated protein
MCP Monocyte Chemoattractant Protein
MDP Muramyl dipeptide
MHC Major Histocompatibility Complex mDC Myeloid dendritic cells
MSC Mesenchymal stem cell
MyD88 Myeloid Differentiation Primary Response gene 88 NaCl Sodium Chloride
NF-κB Nuclear factor-kappa B
NK Natural killer
NLR NOD-like receptors
NOD Nucleotide binding oligomerization domain OC-1 Osteocalcin-1
OD Optical Density
ODN Oligodeoxynucleotide
PAMP Pathogen associated molecular patterns
PBS Phosphate buffered saline
PCR Polymerase chain reaction pDC Plasmacytoid dendritic cells
PGN Peptidoglycan
p(I:C) polyinosinic acid:cytidylic acid PNPP Para-nitrophenyl pyro phosphate
PPAR-γ Peroxisome proliferator-activated receptor gamma PRR Pattern recognition receptors
RIG Retinoic acid-inducible gene
RLH Retinoic acid-inducible gene-like helicases RNA Ribonucleic acid
RPMI Roswell Park Memorial Institute
RT Room Temperature
RT-PCR Reverse-Transcriptase Polymerase Chain Reaction RUNX Runt-related transcription factor
SA-AKP Streptavidin Alkaline-phosphatase
ssRNA Single-stranded RNA
xvi
TGF-β Transforming Growth Factor beta
TIR Toll/IL-1 receptor
TIRAP Toll/IL1 receptor-associated protein TLR Toll-like Receptor
TNF Tumor Necrosis Factor TRAF TNF-associated factor
1
1. INTRODUCTION
1.1. Mesenchymal Stem Cells
The history of mesenchymal stem cells (MSCs) can go back to mid 60’s. The first efforts for describing a stem cell population in bone marrow brought to attention after observation of osteogenic differentiation of fully and partially transplanted bone marrow into mice (Friedenstein et al., 1966). The discovery of MSCs was done by Friedenstein and colleagues in 1966. However, at that time it was not possible to fully describe this cell type. Later intensive studies revealed that there is a fibroblast-like cell population in bone marrow able to form colonies in culture (Friedenstein et al., 1970). As the studies concentrated on establishing the possible cell population present in bone marrow with osteogenic differentiation capacity, information on the MSCs has continued to accumulate up to now. Despite all the studies performed about MSC biology, several issues are still unresolved and inconsistencies present in the literature.
1.1.1. Characterization of Mesenchymal Stem Cells
For any given cell type, characterization of that particular cell is an essential and first step for studying this cell population. In MSC case, unfortunately due to variations in common practice while culturing BM cells to yield MSC common “gold standard” markers are not available. Today, with every paper published, there is a different statement claimed for MSC characterization. These discrepancies preclude an acceptable consensus on the establishment of standard method for MSC characterization. Among many, one approach used in common to characterize MSC generation is to demonstrate their capacity to differentiate tissue-specific cells. MSCs are now accepted as multipotent cell populations that can differentiate into three main mesenchymal lineages; adipocytes, osteocytes and chondrocytes (Pittenger et al., 1999). With their unique multipotential ability, at least these stem cells are distinguished from other stem cell types co-existing in the bone marrow niche. However, one method would not be sufficient to fully annotate a cell as MSC. Other methods applied to characterize is the surface marker expression profiles. Since there are controversial views about rate and type and level of expression of certain genes
2
as markers of MSCs among the species, still a handful of CD markers do present on MSCs regardless of the type of the host. These are CD90, CD73, CD105 according to International Society for Cellular Therapy, ISCT (Dominici et al., 2006). In addition to these positive markers, CD11b, CD34, CD45 or CD14 and HLA-DR surface molecules were regarded as negative markers of MSCs. The third and the most convenient method is the plastic adherence property of these cells. This method is a “gold standard” nearly for 40 years beginning with the first identification of MSCs (Friedenstein et al., 1966). Since, hematopoietic stem cells and erythrocytes do not attach to plastic surfaces; MSCs can be easily isolated from the rest of the cells with this primitive feature during bone marrow culturing. Today, these three main methods are widely used and accepted for MSC isolation and characterization. Nevertheless, the scientists are still investing considerable effort in order to describe more common, universally acceptable MSC markers.
1.1.2. The Mesenchymal Stem Cell Niches in Body
The main and the most abundant niche of MSC is bone marrow. Besides MSCs, bone marrow consists of a variety of other cell types including progenitors for blood cells, and other stromal cells (Dorshkind, 1990). Within this microenvironment, MSCs makes up the 0.001%-0.01% of the whole cell population. This ratio was determined with Percoll density gradient centrifugation (Pittenger et al., 1999). The efforts for isolation of MSCs from tissues other than bone marrow are due to the need for finding better non-invasive sites. In the search for such an alternative source of MSC, there are a number of other tissues/sites where MSCs were successfully isolated. These include but not limited to umbilical cord blood (Romanov et al., 2003), adipose tissues (da Silva Meirelles et al., 2009; De Ugarte et al., 2003; Nathan et al., 2003) and umbilical cord matrix (Zeddou et al., 2010). In addition to these tissues, trabecular bone (Noth et al., 2002), synovium (Fickert et al., 2003), vascular wall (Abedin et al., 2004) and periosteum (Nathan et al., 2003) are found to be consisting MSCs in adults. What’s more, during development processes, MSCs were also isolated from liver (Anker et al., 2003;Paniushina et al., 2004), heart (Warejcka et al., 1996), spleen and lung (Anker et al., 2003), derma (Chunmeng and Tianmin, 2004) and pancreas (Hu et al., 2003).
3
1.1.3. Differentiation Capacity of Mesenchymal Stem Cells
The first defined potential of MSC was in the direction of differentiation into osteocytes (Friedenstein et al., 1966). Within years, standardization was brought for characterization of MSCs in terms of differentiation capacity. Recently, MSCs are accepted as having capacity to differentiate at least into three lineages; adipocytes, osteocytes and chondrocytes (Pittenger et al., 1999). However, studies revealed that MSCs have much more capacity than previously stated. For instance, these stem cells have potential to develop into ligaments and tendons when embedded in collagen and subjected to mechanical force (Altman et al., 2002). MSCs were also reported to differentiate into endotheliocytes both in vitro (Campioni et al., 2003) and in vivo (Silva et al., 2005). In addition to these observations, it is also reported that these stem cells could be differentiated into cardiomyocytes (Xu et al., 2004). It is expectable that MSCs could differentiate into cells of mesenchyme origin. However, there are studies also illuminating that MSCs have capacity to differentiate into cells of endodermal and ectodermal lineages such as neuron-like cells (Hermann et al., 2004) and hepatocytes (Wang et al., 2004). The most widely studied differentiation processes of MSCs would be investigated in Figure 1.1.
Figure 1.1 - Multipotency of MSC and differentiation pathways (Adopted from Caplan and Bruder,
4
1.1.4. Immunomodulatory Effects of Mesenchymal Stem Cells
For the characterization of mesenchymal stem cells, functional studies were carried out with these cells both in vitro and in vivo. During animal studies, MSCs were discovered to be suppressing immune system. Further studies demonstrated that these cells have immunosuppressive capacity. Moreover, these cells were observed to escape from immune system resulting in no immune response even interspecies engraftment of these cells (Nauta and Fibbe, 2007; Rasmusson, 2006). The immunosuppressive property of these cells was related to the expressed receptors and ligands for specific receptors. MSCs express growth factor receptors like TGF-β and Wnt (Mishra et al., 2005), adhesion proteins like vascular cell adhesion molecule (VCAM), intracellular adhesion molecule (ICAM) and CD166 (Ruster et al., 2006), several cytokine and chemokine receptors such as IL-6R, IFN-γR, TNF-α1R, CXCR4R, CXCR9 (Honczarenko et al., 2006; Ji et al., 2004), toll-like receptors like TLR2 (Pevsner-Fischer et al., 2007), TLR3 and TLR4 (Liotta et al., 2008) and also these cells can secrete ligands for natural killer cell receptors (Spaggiari et al., 2006). A comprehensive view of immunosuppresion and how it is directed by MSCs for several immune cells is summarized in Figure 1.2 (Rasmusson, 2006).
Figure 1.2 - Immunomodulatory effects of MSCs on immune system cells (Adopted from Rasmusson,
5
Especially, immunosuppresion is mediated via these singular interactions. At this point, interactions of MSCs with specific immune cells play the key role for inhibiting the stimulatory effects of immune system. Since MSCs show the expression of several receptors and ligands, it is inevitable that these cells are interacting with other cells individually. As a specific point for immunosuppresion, MSCs can inhibit the T lymphocytes. The inhibitory action is delivered by hampering the maturation of T lymphocytes via a soluble factor, indoleamine 2, 3-dioxygenase (IDO), which converts the tryptophan required for T lymphocyte maturation into kynurenine (Meisel et al., 2004). As in the suppression of T lymphocytes, other immune system cells are controlled by MSC with a different mechanism or a similar one with T lymphocyte case.
1.1.5. Potential subpopulations of Mesenchymal Stem Cells
It is a well-known fact that bone marrow microenvironment consists of various cell types forming a heterogeneous residing place for many cell populations. Considering this heterogeneous environment, without no doubt, any cell population removed from this tissue would be “contaminated” with neighboring cell types. To get a more homogeneous cell group, special isolation processes are performed following the bone marrow extraction. However, such isolation procedures would not be sufficient to obtain a pure cell population. Recent studies demonstrated that even at the end of 14 day isolation procedure, mesenchymal stem cells do not display a homogeneous cell population (Harting et al., 2008). Moreover, stimulation of these cells with different ligands gives different cell profiles (Waterman et al., 2010). It is even possible to classify two distinct populations of MSCs according to immuno-phenotyping (Battula et al., 2009; Buhring et al., 2009). What is more important is, these two studies revealed that subpopulations have very different characteristics in terms of immunosuppresion. The former study has clearly stated that upon priming with different TLR ligands, MSCs were directed into two distinct phenotypes: an immunosuppressive and other pro-inflammatory phenotype (Battula et al., 2009). Such a pro-inflammatory MSC phenotype was reported previously with IFN-γ priming studies of MSCs (Chan et al., 2006; Romieu-Mourez et al., 2009; Stagg et al., 2006). These and other studies establish the immune plasticity concept for MSCs.
6
Recent reports also stated the presence of a subpopulation defined by high osteogenic properties (Leonardi et al., 2009; Liu et al., 2009; Tormin et al., 2009).
1.1.6. Clinical Applications of Mesenchymal Stem Cells
As stated in previous sections, the versatile potentials of MSCs in terms of differentiation and migration capacity to the injury site make these cells a valuable tool for regenerative medicine and delivery vehicle. The idea of using MSCs in the regenerative medicine developed with the discovery of multilineage differentiation potential of these cells. These cells were administered following hematopoietic stem cell (HSC) transplantation in order to enhance the engraftment of HSCs in patients who has hematological disorders (Koc et al., 2000; Lazarus et al., 2005). In addition to such benefits of MSCs, these cells are used in tissue repair with patients suffering bone and cartilage disorders (Horwitz et al., 2002; Horwitz et al., 1999; Turgeman et al., 2002). In addition to these applications, MSCs were also administered to patients who had myocardial infarction and significant improvements with the heart function were recorded (Stamm et al., 2003). Beside such studies, MSCs were also used for their immunosuppressive properties. In order to prevent the engrafted tissue rejection, MSCs were also administered along with or following the tissue transplantation. Such studies demonstrated that graft-versus-host disease (GvHD) which results following tissue transplantation was prevented via immunosuppressive feature of MSCs. (Le Blanc et al., 2008; Le Blanc et al., 2004). Additionally, MSCs were benefited as a delivery vehicle to desired tissue using their migration capacity. Such studies generally include the cancer therapy and in these studies MSCs were loaded with anti-cancer drugs (Nakamizo et al., 2005; Studeny et al., 2004).
1.2. Mesenchymal Stem Cells and Toll-Like Receptors
Recently, therapeutic applications of mesenchymal stem cells had a broad range in different disease states. These applications do not include only regenerative medicine but also in cancer therapy. MSCs provide a safe biological delivery tool. However, these stem cells have some unique properties that put them in a different position than only being multipotent stem cell. These cells express several cytokine (Honczarenko et al., 2006; Ji et al., 2004) and other immune system receptors,
7
especially TLRs (Pevsner-Fischer et al., 2007). What’s more, MSCs can behave differently under unfavorable conditions such as hypoxia (Cho et al., 2006) and inflammation (Raicevic et al., 2010). Defining the behavioral changes in MSCs under these conditions carries significant information in terms of suitable and reliable administration of these cells.
In the recent years, it is proposed that, TLRs can mediate the immunomodulatory potential of MSCs, yet there are several unresolved and contradicting issues on this topic. These modulations are in the way of stimulating down-stream signaling of TLRs and thus providing MSCs a more immunostimulatory character ( Romieu-Mourez et al., 2009). Additionally, stimulation of TLR with the proper ligands causes an increase in the migratory capacity of MSCs (Tomchuck et al., 2008). Moreover, some studies have shown that TLR ligand priming had resulted in changes with the differentiation capacity of MSCs. For instance, MSCs stimulated with TLR3 and TLR4 ligands had an increased osteogenic differentiation capacity (Lombardo et al., 2009). Parallel to the stated effects of TLR3 and TLR4, these receptors have been shown to inhibit the modulatory activity of T lymphocytes by means of hampering Notch signaling (Liotta et al., 2008). Along with these studies, in a recent study it is stated that lipopolysaccharide which is a ligand for TLR4 had increased the proliferation rate of MSCs (Wang et al., 2009). Like in the characterization problem of MSCs, today there are a number of papers stating inconsistent results in similar experimental systems. Such controversial findings raise a new concept about MSCs. Do they possess opposing suppopulations? A recent paper claimed that stimulation with two different TLR ligands has resulted two converse MSC types (Waterman et al., 2010). Without doubt, in the near future there will be more findings supporting this view of differential contribution of TLR engagement and its involvement on MSC immunobiology.
1.3. The Immune System
The main goal of immune system of an organism is to distinguish the foreign particles from the self-particles. This “self vs non-self” distinguishment of immune system is the first strategy in the way of protection mechanism. It is crucial to perform this distinguishment properly. For a proper distinguishment, the immune
8
system is “trained” from the first development stages of an organism. For instance, human immune system is “educated” in the womb against the foreign particles, antigens, of mother. Any mistake made in the defining of self and non-self antigens would result in problems with the immune system like autoimmune diseases, chronic diseases or even with death. Thus, this process has a pivotal importance in the immune system. In addition to “training” process of immune system, this system has also other strategies to recognize foreign particles. The immune system can be categorized into two different subtypes; innate and acquired (adaptive) immune system. The innate immune system has evolutionarily conserved universal mechanisms to recognize foreign particles whereas adaptive immune system has unique property to “learn” and “remember” previously encountered antigens with specificity (Akira et al., 2001). Beside adaptation and memory of adaptive immune system has also some disadvantages like allergy and rejection of tissues following transplantation (Medzhitov and Janeway, 1998).
1.3.1. The Innate Immune System
The innate immune system has been universally found in a very wide range of organisms from different levels. The innate system is composed of mucosal epithelia, being the first line of host defense, and several cell types, like natural killer cells, phagocytes, expressing similar receptor profiles. Since the innate system is an ancient way of pathogen recognition, this system has limited germline-encoded receptors in number. Corresponding with the receptor limitation, this system has such a limit in the particle recognition. Only the universally conserved structures are recognized by this system (Janeway and Medzhitov, 2002). Conversely to this system, adaptive immune system has an unlimited antigen recognition system. However, without the innate immune system, the adaptive immune system cannot provide the protection against foreign particles since these two systems function in harmony. Actually, the innate immune system takes part in the first branch of recognition and with the response given by innate immune system, adaptive immune system settles a more vigorous further response (Medzhitov et al., 1997). Such situations take place when the innate immune system is unable to challenge the pathogen or recognize the pathogen. At this point, adaptive immune system gets into action and “generate” receptors for the recognition of pathogen. These receptors are
9
expressed with the somatic recombination of the gene segments which provides a variety of receptor types (Schatz et al., 1992). However, the innate immune system, as previously mentioned, has a limited number of receptors for fighting off the pathogens. These receptors are called pattern recognition receptors (PRRs) and recognize the pathogen associated molecular patterns (PAMPs) (Akira et al., 2006).
1.3.1.1. Pattern Recognition Receptors
These receptors are found on innate immune system cells and implement their functions through recognizing the non-self pathogen-associated molecular structures that build up the main structures of microorganisms. These receptors are germ-line encoded meaning that in any given cell type of innate immune system, all cells express these receptors. Contrary to adaptive immune cells, T and B-lymphocytes, the cells expressing these receptors do not have immunological memory or specificity. What’s more, each PRR can recognize a specific PAMP regardless of the development stage of related microorganism (Akira et al., 2006). PRRs have distinct mechanisms of serving their functions. The most prevalent one is the activation of proinflammatory signaling pathways. Again the widely activated proinflammatory pathway is the nuclear factor-kappa B (NF-κB) pathway and to a lesser extent mitogen activated protein (MAP) kinase pathway (Clemens and Elia, 1997). Other mechanisms include the induction of apoptosis, phagocytosis and opsonization.
There are three main classes of PRRs: nucleotide binding oligomerization domain (NOD)-like receptors (NLRs), retinoic acid-inducible gene I (RIG)-like helicases (RLHs) and Toll-like receptors (TLRs) (Kawai and Akira, 2006).
1.3.1.1.1. Toll-Like Receptors as Pattern Recognition Receptors
The Toll-like receptor name was given after the discovery of a homologue Toll protein in human that was first defined in Drosophila melanogaster. Just like the function in D. melanogaster, human homologue of Toll protein was inducing the innate immune system through the NF-κB signaling pathway as well. By cloning and characterization studies, TLRs were defined as type I transmembrane receptors with leucine-rich repeats (LRR) containing extracellular domains and an intracellular
10
Toll/IL-1 receptor (TIR) homology domain (Medzhitov et al., 1997). As TLRs are found to be a part of innate immune system, they were also characterized with the evolutionary conservation from Caenorhabditis elegans to higher vertebrates, humans (Roach et al., 2005). From the identification of TLRs for the first time, up to now, 10 TLRs in humans and 13 in murines have been identified. There are a number of differences among the TLRs such as ligand specificities, expression profiles, target genes that are induced by these receptors and the signaling pathways as well (Kumagai et al., 2008).
1.3.1.1.2. Toll-Like Receptors in Innate and Adaptive Immunity
Defined as one of the main functioning units for innate immune system, TLRs are expressed on a variety of innate immune system cells such as dendritic cells and macrophages. Although, TLRs are characterized as PRRs of innate immune system cells, these receptors are also expressed on B cells and some specific types of T cells from adaptive immune system. Moreover, the expression profiles of these receptors can include the fibroblasts and epithelial cells (Kumagai et al., 2008). Interestingly stem cells are also found to be expressing these receptors (Pevsner-Fischer et al., 2007; Scumpia et al., 2010). Besides their wide expression range, these receptors are also found to be taking role in directing the innate immune system response and linking innate immune responses with adaptive immune system (Majewska and Szczepanik, 2006; Takeda et al., 2003). Most of the time, flow of information from innate immunity to adaptive immunity is provided by dendritic cells. Recognition of pathogens by DCs via TLRs causes the expression of co-stimulatory molecules, like CD80/CD86. This induction is crucial for activation and survival of T cells. Along with this action, pathogen recognition by DCs ends up in the induction of inflammatory signals and as a result of this induction, inflammatory cytokines are produced (Akira et al., 2001).
1.3.1.1.2.1. The Toll-Like Receptor Family Members
In mammals, 10 members of TLRs are identified up to now (Rakoff-Nahoum and Medzhitov, 2009) and in mice 13 TLRs are identified (Takeda and Akira, 2007). Among these TLRs, the first characterized one was the human TLR4 (Poltorak et al.,
11
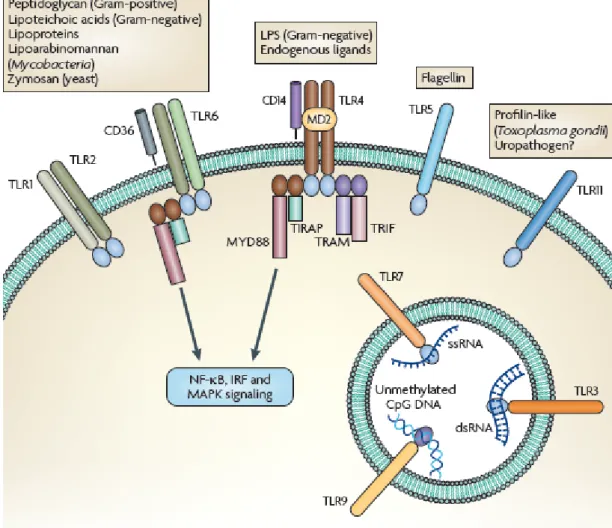
1998). Within such diverse TLR member family, it is possible to classify these receptors according to different properties possessing. However, the localization of these receptors in a cell supplies the most convenient way of categorizing. Thus, TLR1, 2, 4, 5, 6 and 11 make a TLR subtype located on the cell membrane while TLR3, 7, 8 and 9 forms another subtype existing in the intracellular endosomal and/or endoplasmic reticulum parts (Iwasaki and Medzhitov, 2004). Moreover, the former subtype presumably specialized in the recognition of main bacterial structures whereas the latter subtype recognizes the viral and bacterial nucleic acids specific to these microorganisms (Rakoff-Nahoum and Medzhitov, 2009) (Figure 1.3).
Figure 1.3 - Localizations of Toll-like receptors and related ligands for each TLR (Adopted from
Rakoff-Nahoum and Medzhitov, 2009 with permission).
As depicted in the Figure 1.3, TLRs can function alone or in dimers with another TLR or self. The dimerization is necessary for the induction of proper signaling pathways. Another reason for dimerization is to recognize specific pathogen particles,
12
which will be explained in detail in each TLR section. For such a recognizing pattern, TLR2 forms heterodimer with TLR1 and TLR6. That’s why, these three TLRs will be investigated under one topic.
1.3.1.1.2.1.1. TLR1,2 and 6
TLR2 is the most extensively studied among these three TLRs. Since TLR2 is known to recognize a wide range of microbial particles such as peptidoglycan (PGN) and lipoteichoic acid (LTA) from Gram-positive bacteria, lipoproteins from various microorganisms, glycosylphosphatidylinositol anchors of protozoans like Trypanosoma cruzi, zymosan from fungi, a phenol-soluble modulin from Staphylococcus epidermis and glycolipids from Treponema maltophilum (Takeda et al., 2003). Beyond these pathogen particles, TLR2 can recognize the lipopolysaccharide (LPS) preparations of Helicobacter pylori (Smith et al., 2003). However, wide spread function of TLR2 cannot be attributed to only TLR2. Dimerization of TLR2 with TLR1 and 6 provides its multiple pathogen particle recognizing talents. For instance, TLR2 cannot distinguish diacyl or triacyl lipopeptides by itself. Dimerization of TLR2 with TLR1 provides the diacyl lipopeptides recognition whereas dimerization with TLR6 ensures the triacyl lipopeptides recognition (Takeuchi et al., 2001; Takeuchi et al., 2002). Beyond dimerization with TLRs, TLR2 can also function with other kind of receptors. For fungal-derived component recognitions like β-glucan, TLR2 collaborate with lectin receptor family, herein dectin-1 (Gantner et al., 2003).
The expression level of TLR2 is regulated positively by pro-inflammatory signals like TNF-α and negatively by anti-inflammatory signal molecules such as glucocorticoids (Hermoso et al., 2004). Correlated with its expression level, TLR2 activation is also regulated with respect to inflammatory signals.
1.3.1.1.2.1.2. TLR3
TLR3 recognizes the double-stranded (ds) RNA molecule of viruses. dsRNA is generated by a wide range of viruses during their life cycle. By finding out that dsRNA is recognized by TLR3, it was no doubt that TLRs have roles in host defense
13
against viral components as well as bacterial components (Alexopoulou et al., 2001). Upon dsRNA recognition, antiviral and immunostimulatory signals are activated. For antiviral alerts, type I interferons, IFN-α/IFN-β, are induced and synthesized. Besides, NF-κB signaling pathway is also activated in order to enhance immune response. TLR3 is found to be expressed by various immune system cells. For instance, dendritic cells, macrophages and even some epithelial cells are known to be expressing TLR3. However, as the most important director of antiviral responses, natural killer (NK) cells are the number one expressing TLR3. In addition to dsRNA, NK cells are responsive to polyriboinosinic polyribocytidylic acid (poly(I:C)) which is a synthetic dsRNA and induces the production of IL-6 and IL-8 as proinflammatory cytokines, IFN-γ as antiviral cytokine (Schmidt et al., 2004).
1.3.1.1.2.1.3. TLR4
Lipopolysaccharide (LPS), the major part of Gram-negative bacteria outer membrane, is the ligand for TLR4, the first defined human TLRs. The ligand for TLR4 is revealed out by the hyposensitivity studies to LPS when point mutations were introduced to this receptor (Hoshino et al., 1999). Within the last decade, it was found out that like TLR2, TLR4 has more ligands than one. For instance, taxol from Taxus brevifolia (Kawasaki et al., 2000) and respiratory syncytial virus fusion protein (Kurt-Jones et al., 2000) are other ligands for TLR4. What’s more, endogenous ligands, like heat shock proteins (HSP60, HSP70) at high concentrations were also activating TLR4 signaling pathways (Cohen-Sfady et al., 2005; Takeda and Akira, 2005).
Just like TLR2 functioning, TLR4 has to cooperate with some accessory molecules in order to recognize LPS. LPS cannot directly bind to TLR4. First, it has to bind LPS-binding protein (LBP) which is found in the serum. Then, this serum protein transfers the subunits of LPS to CD14, which functions as a co-receptor of TLR4. Finally, TLR4 comes next to CD14 to recognize LPS particles and start down-stream signaling with the help of MD-2 (Shimazu et al., 1999; Wright et al., 1989).
14 1.3.1.1.2.1.4. TLR5
Besides cell wall or genetic elements of bacterial organisms, some kinds of bacteria require flagellum for mobility. Therefore, subunits of flagellum, flagellin, provide a good recognizing agents for host defense. TLR5 does the flagellin recognizing duty of the innate immune system (Smith et al., 2003). The flagellin recognition induces inflammatory cytokine production such as TNF-α and IL-8.
1.3.1.1.2.1.5. TLR7 and 8
TLR7 and TLR8 have a close relativity since they are structurally conserved relative to each other. The discovery of ligands for these TLRs came during the approved treatment of viral infections. The synthetic compounds imidazoquinolines were the first to be defined as causing anti-viral activity upon administration (Hemmi et al., 2002). It was shown that both TLRs were expressed; however, TLR8 was unresponsive to ssRNA in mice (Akira et al., 2006). Upon induction of TLR7 and 8 with imidazoquinolines and ssRNA, antiviral cytokines was found to be produced. These cytokines are synthesized upon activation of interferon regulatory pathways like IRF3 and IRF6 (Ito et al., 2005; Kawai et al., 2004).
In the last decades, it was discovered that host cells also produces ssRNA. However, these ssRNAs, miRNA and siRNA, did not possess any danger signal for the host cells. This may explain why nucleic acid recognizing TLRs are localized inside the cell, on the endosomal membranes since self-derived ssRNAs are not delivered to endosomes (Lund et al., 2004; Takeda and Akira, 2007).
1.3.1.1.2.1.6. TLR9
One pivotal difference between bacterial genetic elements and mammalian genetic elements is the CpG dinucleotides. Although two groups have these sequences, bacterial DNA contains these CpG motifs in unmethylated form, which provides a basis for self/non-self discrimination of the immune system. TLR9 takes advantage of this difference and recognizes unmethylated bacterial CpG motifs. In vertebrates, the methylation of CpG motifs at cytosine residues ensures the self recognition and
15
does not lead to an immunostimulatory effect (Krieg et al., 1995). In TLR9-KO mice, CpG motifs from bacterial DNA do not cause any immunostimulatory response supporting the function of TLR9 in recognizing unmethylated CpG DNA (Hemmi et al., 2000). TLR9 expression has been found on B cells, natural killer cells and dendritic cells mostly. The expression of TLR9 is seen during the maturation, proliferation and cytokine secretion of related cell types (Krieg, 2000). In nature, two types of CpG DNA was discovered: CpG-B type and CpG-A type. Two types have differential effects and immunostimulatory potential on plasmacytoid dendritic cells (pDC) and B cells. The first identified CpG type is conventional CpG-B type which has the ability to induce pro-inflammatory cytokines like IL-12 and TNF-α. Differently from A type of CpG, conventional CpG type has phosphorothioate backbone without a poly (G) tail. Conversely, CpG-A type has its 3’ and 5’ ends linked to a poly (G) tail and build up with a phosphodiester/phosphorothioate mixed backbone. Another difference of these two types is the potential ability to induce IFN-α and IL-12 from pDCs. CpG-A type has a greater IFN-α induction potential, however it cannot induce as much IL-12 as CpG-B type could induce. In addition to this, CpG-A type cannot stimulate B cells (Gursel et al., 2002; Honda et al., 2005; Verthelyi et al., 2001). The potentiality differences between CpG types are due to the characteristics of target cells. Recently, pDCs are found to be expressing CXCL16 which serves as a co-receptor along with the TLR9 in recognition of CpG-A type. On the contrary to pDCs, B cells do not express CXCL16 which results in no stimulation upon CpG-A type induction (Gursel et al., 2006).
16
Table 1.1 – Toll-like receptors and their ligands (Adopted from Takeda and Akira, 2007 with
permission)
1.3.1.1.2.2. Toll-Like Receptor Signaling Pathways
TLRs bind specific ligands and signaling pathways are triggered. Through these signaling pathways, genes that are related with the inflammatory machinery starts to be expressed. Between ligand recognition and gene expression, there is an adaptor protein, myeloid differentiation primary response gene (88)-MyD88, which takes part in the TLR signaling. After ligand binding, intracellular domain of TLRs, called as TIR, associates with MyD88 and signals are transduced. The interaction of MyD88 is provided by the TIR domain of this molecule (Hemmi et al., 2002; Takeuchi et al., 2000). However, the signal transductions of TLRs are not always MyD88-dependent. For instance, TLR4 signaling can also occur via an alternative pathway; TRIF-dependent pathway. TIR-domain containing adaptor inducing IFN-β, TRIF, protein takes the role of MyD88 in this pathway (Youn et al., 2005). TLR3
17
and TLR4 can alternatively use this MyD88-independent/TRIF dependent pathway (Brint et al., 2002).
As demonstrated in Figure 1.4, regardless of MyD88 dependency, stimulation of each TLR results in activation of NF-κB pathway, which in turn starts an inflammatory signaling cascade.
18 2. AIM
Mesenchymal stem cells (MSC) are special progenitor cells and are distinct from adult stem cells in many ways. It was suggested by many studies that these cells undergoes lineage dependent differentiation depending on their micro-niche as well as self-renewal and homing capacity to damaged tissue sites. MSCs are also known to induce immunomodulatory effects and were indicated as a suitable therapeutic cell in GVHD capacity. Such diverse properties make MSCs a powerful tool in several therapeutic applications.
Toll-like receptors (TLR) are expressed by the cells of the immune system that are evolutionarily selected to recognize conserved microbial byproducts. Recent findings suggest that in vitro generated MSCs express some of these pathogen recognition receptors raising the debate with regard to their immunosuppressive character. We reasoned that in order to broaden the therapeutic potential in addition to better understand MSCs biology, there is a need to describe the interplay between MSC and TLR interaction.
In this context, present study was designed to pursue TLR mediated activation of MSCs and understand its impact on differentiation and immunomodulatory potential.
This study is planned to be conducted in three main parts: In the first part, our goal was to determine the expression levels of TLRs by MSCs. Next the effect of TLR ligand addition on the adipogenesis was assessed. In the second part, migration capacity of these stem cells in the presence or absence of TLR ligands as well as their proliferation was investigated. Finally, immunomodulatory potential of MSCs either alone or in combination with spleen cell co-cultures in the presence or absence of different ligand was investigated.
19
3. MATERIALS AND METHODS
3.1. MATERIALS
3.1.1. Reagents
MesenCult® (STEMCELL Technologies, Canada) was the main culture media used during the mesenchymal stem cell isolation procedure and culturing. In addition to this, RPMI1640 and low glucose DMEM and supplementary solutions of these media were all from Hyclone (USA).
TRI Reagent (Trizol®), used for manual RNA isolation, was from Invitrogen (USA). DyNAmoTM cDNA Synthesis kit, DyNAzyme™ II PCR Master Mix for PCR was obtained from Finnzymes (Finland). All primers for PCR (designed), were purchased from Αlpha DNA (Canada). 50 bp DNA ladder was purchased from Jena Bioscience (Germany).
Unlabeled or biotinylated monoclonal antibodies against IL-6 or IFN-γ were purchased from Thermo Scientific (previously known as Endogen, Pierce (USA). Recombinant cytokines used for standard curve preparations during cytokine quantitation and streptavidine-alkaline phosphatase (SA-AKP) were purchased from Endogen, Pierce (USA). Substrate for alkaline phosphatase p-nitrophenyl phosphate disodium salt (PNPP) was purchased from Thermo Scientific (USA).
3.1.2. Toll-Like Receptor Ligands and Oligodeoxynucleotides
Throughout this study, during the stimulation assays of co-cultured splenocytes or induction of MSCs to undergone differentiation following TLR ligands were used. Their sources and specifications were listed below: i) peptidoglycan (PGN, TLR2L or TLR2/6L) isolated from B. subtilis were from Fluka, (Switzerland), ii) lipopolysaccharide (LPS; TLR4L) isolated from E. coli were from Sigma, (USA), iii) poly inosinic acid:cytidylic acid (p(I:C), TLR3L) were received from Amersham, (UK), iv) a modified adenine base, R848, known as imiquimod that was developed by 3M company (TLR7/8L) was purchased from Invivogen (USA) and v)
20
immunostimulatory CpG motif expressing single stranded short ODNs (TLR9L), immunosuppressive telomeric repeat unit expressing ODNs (as a TLR antagonists) or control ODNs (flip CpG dinucleotides) were purchased from Alpha DNA (Canada), and some sequences (i.e. A151) were kindly provided by Dennis M. Klinman (NCI/NIH, USA).
3.1.3. Standard Solutions, Buffers, and Culture Media
The detailed information about the ingredients and preparations of common laboratory used buffers, sterile standard solutions and several other culture media used in the present work is presented in Appendix A (please refer to get further details).
3.2. METHODS
3.2.1. Maintenance of animals
This M.Sc. thesis work was carried out using two different experimental animals, namely, rat and mice. Throughout the animal experiments, different organs of adult male Sprague-Dawley rats (6-9 months old) and adult male C57BL/6 mice (3-6 months old) were used. These animals were sustained under controlled ambient conditions (22±2°C) with a cycle of 12 hrs light/dark cycles. They were fed ad libitum. Animal procedures employed throughout this thesis were approved by Bilkent University Animal Ethical Committee (Bil-AEC).
3.2.2. Isolation and culture of Rat & Mouse Mesenchymal Stem Cells
For bone marrow (BM) isolation, the animals were sacrificed by cervical dislocation. Next, the femur and tibia bones of both legs were removed and cleaned off muscles and adipose tissues. The ends of bones were cut with a bone cutting forceps and BM was flushed with pre-warmed DMEM media supplemented with 5-10 % FBS and 1% penicillin/streptomycin (Hyclone, USA). The flushing of BMs was done using a 10 ml syringe in the case of rat bone marrow and a 5 ml syringe during mouse BM isolation. After collecting BM cells in a 50 ml falcon, they were centrifuged at 1500
21
rpm for 8-10 mins at RT. Then, the supernatant was sucked with glass pasteur pipette travelling the inner wall of falcon tube in order to remove any connective or adipose tissue. The pellet was mildly dislodged with the help of a pin rack and washed 3x with warm DMEM. At the end of washing steps, BM cells were counted and seeded into T75 flasks with a concentration of not more than 25x106 cells/flask (2-2.5x10⁶/ml).
3.2.3. Cell Culture
3.2.3.1. Preparation of Single Cell Suspension of Mouse Spleen Cells
Male C57BL/6 were sacrificed by cervical dislocation and spleens were removed in aseptic conditions and the whole organ was transferred into 2-3 ml warm DMEM (or in some cases RPMI media) containing 5-10% FBS in 6-well plates. In order to obtain single cell suspension, under lamin-air hood, spleens were first smashed with a sterile syringe plunger back moving in circular directions. They were then collected in 15 ml falcon tubes. The cells were centrifuged at 1500 rpm for 8-10 mins, washed twice with warm media and were resuspended in 5% oligo FBS supplemented RPMI-1640 medium (Hyclone, USA). Single cell suspensions of splenocytes were counted and used for further assays.
3.2.3.2. Adjusting the Cells Following Counting
A sample of 10 µl volume of single cell suspension of any intended cell source was transferred on a Neubaer cell counting chamber and covered by the help of a cover slip (please see figure 1 for the counting and cell number estimation strategy). Cells were counted, and the total cell number was computed. Based on the total cell number extracted after each procedure, cell populations were adjusted to required cell concentrations. Normally, for proliferation or of cytokine secretion detection assays 2x10⁶/ml cells were harvested.
22
Figure 3.1 - Neubaer cell counting chamber
Since 1 mm2 area of this chamber has a volume of 0.1 mm3, the total number of cells in 1 ml was calculated as follows.
(Cell number in 4 little square x 4) x 104 x Dilution factor = Total cell number/ml
Cell number in 0.1 mm3 volume
3.2.3.3. Stimulation with Toll-Like Receptor Ligands
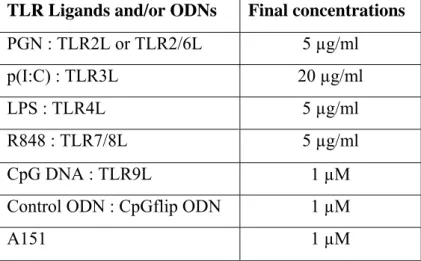
The final concentrations of TLR ligands for stimulation assays were presented in Table 3.1.
Table 3.1 - The final concentrations of TLR ligands and ODNs used TLR Ligands and/or ODNs Final concentrations PGN : TLR2L or TLR2/6L 5 µg/ml
p(I:C) : TLR3L 20 µg/ml
LPS : TLR4L 5 µg/ml
R848 : TLR7/8L 5 µg/ml
CpG DNA : TLR9L 1 µM
Control ODN : CpGflip ODN 1 µM
A151 1 µM
23
3.2.4. Quantification of Gene Expression at Transcript Level
3.2.4.1. Total RNA Isolation and Quantification
In cell culture if adherent, cells were trysinized, collected and centrifuged at 1500 rpm for 5 mins. After sucking supernatant, 1 ml TriZol® reagent (approx. over 107 cells) was added onto the cell pellet, gently pipetted until viscous, pink milkish homogenous solution appears. It was immediately transferred into an eppendorf tube. At this step, dissolved cell pellet in TriZol® reagent could be stored up to a month at -80°C if immediate RNA isolation was not necessary. Alternatively, RNA isolation could be continued by the of 0.2 ml chloroform. At this stage the tube must be hand-shaken vigorously for 15 secs. Following incubation at RT for 3 mins it was centrifuged at 13200 rpm for 17 mins at 4°C. At the end of centrifugation, the mixture was separated into three different layers. RNA presents at the top transparent liquid phase. With great care, this phase (>600 µl) was transferred into a new tube and 500 µl isopropanol was added and the solution was mixed by gentle up/down movements. It was incubated at RT for 10 mins and centrifuged again at 13200 rpm for 17 mins at 4°C. Supernatant of this mixture was sucked and 1 ml 75 % ethanol was added, gently mixed to dislodge RNA pellet and spin down at 8000 rpm for 7 mins. After removal of the supernatant, second washing was performed with 1 ml of 99.9 % ethanol. Centrifugation was repeated as done for the first wash and the liquid was discarded. The RNA pellet was left for drying at under lamin-air flow hood. Air-dried pellets were dissolved in 40 µl nuclease-free ddH2O (Hyclone). The dissolving
process should be done by pipetting for several times in order to obtain a homogenous RNA solution. The OD measurement of RNA was done with the spectrophotometer NanoDrop® ND-1000 (NanoDrop Technologies, USA) with 1 µl of RNA solution. The quality of RNA was determined using OD260/OD280 ratio that
should be between 1.8 and 2.0. RNA solution outside of this OD measurement range indicates contamination (possibly coming from DNA, protein or phenol) these samples must be either re-purified or discarded. The isolated RNA samples were stored at -80°C until for further use.
24 3.2.4.2. cDNA Synthesis
cDNAs were synthesized from isolated RNA samples with the cDNA synthesis kit according to the manufacturer’s protocol. 1 µg of total RNA and 1 µl Oligo (dT) primer was completed to 8 µl with ddH2O. This mixture was pre-denatured at 65°C
for 5 mins in order to get rid of the secondary RNA structures. After pre-denaturation the mixture was incubated on ice for 3 mins. Then, i) 10 µl RT Buffer (supplemented with dNTP mix and 10 mM MgCl2) and ii) 2 µl M-MuLV RNaseH RT (it also contains RNase inhibitor) were added. The reaction mixture, in 0.2 ml PCR tube was placed in MJ Mini Thermocycler, (BIORAD, USA) and incubated at 25°C for 10 mins, 40°C for 45 mins, 85°C for 5 mins and 4°C for 10 mins. The synthesized cDNA samples were stored at -20°C for further use.
3.2.4.3. Primers Designed for RT-PCR Studies
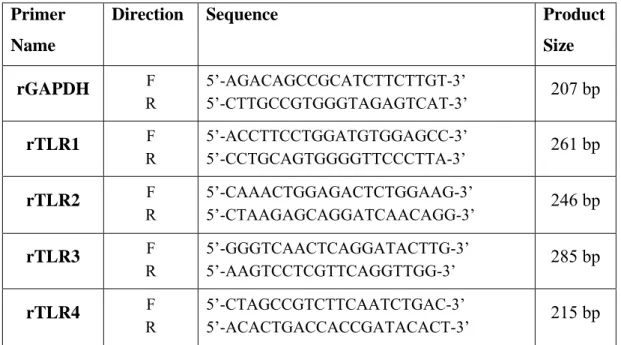
All the primers used in this study were designed using Primer3 Input v.0.4.0 program (http://frodo.wi.mit.edu/primer3/) and the related gene sequences of rat and mouse were retrieved from Ensembl™ and Pubmed databases. In Table 3.2, rat, and mouse primer sequence details of TLRs and their PCR product sizes are presented.
Table 3.2 - Rat* and mouse* primer set sequences and their expected product sizes Primer
Name
Direction Sequence Product
Size rGAPDH F R 5’-AGACAGCCGCATCTTCTTGT-3’ 5’-CTTGCCGTGGGTAGAGTCAT-3’ 207 bp rTLR1 F R 5’-ACCTTCCTGGATGTGGAGCC-3’ 5’-CCTGCAGTGGGGTTCCCTTA-3’ 261 bp rTLR2 F R 5’-CAAACTGGAGACTCTGGAAG-3’ 5’-CTAAGAGCAGGATCAACAGG-3’ 246 bp rTLR3 F R 5’-GGGTCAACTCAGGATACTTG-3’ 5’-AAGTCCTCGTTCAGGTTGG-3’ 285 bp rTLR4 F R 5’-CTAGCCGTCTTCAATCTGAC-3’ 5’-ACACTGACCACCGATACACT-3’ 215 bp
25 rTLR5 F R 5’-AGAGGCTCCTACTCAGCTTC-3’ 5’-AGAGTCCACAGTCAAACAGC-3’ 249 bp rTLR6 F R 5’-GAGCCTTCAGTAGCCTTTCT-3’ 5’-GCTGTCTGGGTAATCACATC-3’ 224 bp rTLR7 F R 5’-CCCTTGAGAGAGCTGCGGTA-3’ 5’-CTTTCCATGGTCCTGCTGGC-3’ 236 bp rTLR9 F R 5’-CATGGTCAGGTGTAAGAACC-3’ 5’-CAGGTCCAGCTTGTTATAGG-3’ 208 bp rTLR10 F R 5’-GGCTGCTAACTTCTGGGTGC-3’ 5’-TGTGGTCCCGACTAGCCATC-3’ 272 bp mGAPDH F R 5’-GTATGCCTCGGTCGTACCA-3’ 5’-CTTCTGCATCCTGTCAGCAA-3’ 450 bp mTLR1 F R 5’-TTTGGGGGAAGCTGAAGACATC-3’ 5’-CTTCGGCACGTTAGCACTGAGAC-3’ 410 bp mTLR2 F R 5’-TCTCTGGGCAGTCTTGAACATTTG-3’ 5’-CGCGCATCGACTTTAGACTTTG-3’ 320 bp mTLR3 F R 5’-GGGGCTGTCTCACCTCCAC-3’ 5’-GCGGGCCCGAAAACATCCTT-3’ 250 bp mTLR4 F R 5’-TGCCGTTTCTTGTTCTTCCTCT-3’ 5’-CTGGCATCATCTTCATTGTCCTT-3’ 240 bp mTLR5 F R 5’-TGGGGCAGCAGGAAGACG-3’ 5’-AGCGGCTGTGCGGATAAA-3’ 380 bp mTLR6 F R 5’-GCCCGCAGCTTGTGGTATC-3’ 5’-GGGCTGGCCTGACTCTTA-3’ 650 bp mTLR7 F R 5’-TTAACCCACCAGACAAACCACAC-3’ 5’-TAACAGCCACTATTTTCAAGCAGA-3’ 700 bp mTLR9 F R 5’-GATGCCCACCGCTCCCGCTATGT-3’ 5’-TGGGGTGGAGGGGCAGAGAATGAA-3’ 430 bp
* “r” stands for rat and “m” stands for mouse primers.
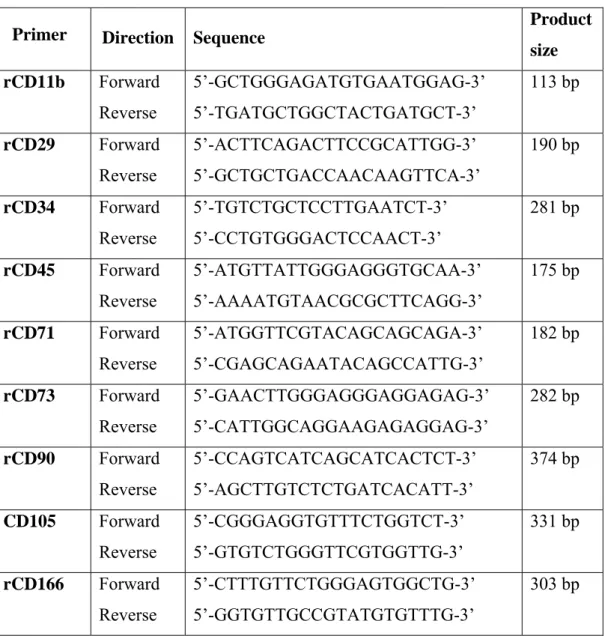
For rat characterization of MSCs, PCR products of several CD markers were studied. The primer sequences of CD markers for and their PCR product sizes are given in Table 3.3.
26
Table 3.3 - Rat CD marker primer set sequences and their expected product sizes
3.2.4.3.1. PCR Studies for Rat and Mouse
Throughout this work, in order to assess the changes in the gene levels of several related procedures, PCR analyses were extensively used. These PCR set-up conditions and reactions were summarized in Tables 3.4 and 3.5 (please review for details).
Primer Direction Sequence Product
size rCD11b Forward Reverse 5’-GCTGGGAGATGTGAATGGAG-3’ 5’-TGATGCTGGCTACTGATGCT-3’ 113 bp rCD29 Forward Reverse 5’-ACTTCAGACTTCCGCATTGG-3’ 5’-GCTGCTGACCAACAAGTTCA-3’ 190 bp rCD34 Forward Reverse 5’-TGTCTGCTCCTTGAATCT-3’ 5’-CCTGTGGGACTCCAACT-3’ 281 bp rCD45 Forward Reverse 5’-ATGTTATTGGGAGGGTGCAA-3’ 5’-AAAATGTAACGCGCTTCAGG-3’ 175 bp rCD71 Forward Reverse 5’-ATGGTTCGTACAGCAGCAGA-3’ 5’-CGAGCAGAATACAGCCATTG-3’ 182 bp rCD73 Forward Reverse 5’-GAACTTGGGAGGGAGGAGAG-3’ 5’-CATTGGCAGGAAGAGAGGAG-3’ 282 bp rCD90 Forward Reverse 5’-CCAGTCATCAGCATCACTCT-3’ 5’-AGCTTGTCTCTGATCACATT-3’ 374 bp CD105 Forward Reverse 5’-CGGGAGGTGTTTCTGGTCT-3’ 5’-GTGTCTGGGTTCGTGGTTG-3’ 331 bp rCD166 Forward Reverse 5’-CTTTGTTCTGGGAGTGGCTG-3’ 5’-GGTGTTGCCGTATGTGTTTG-3’ 303 bp
27
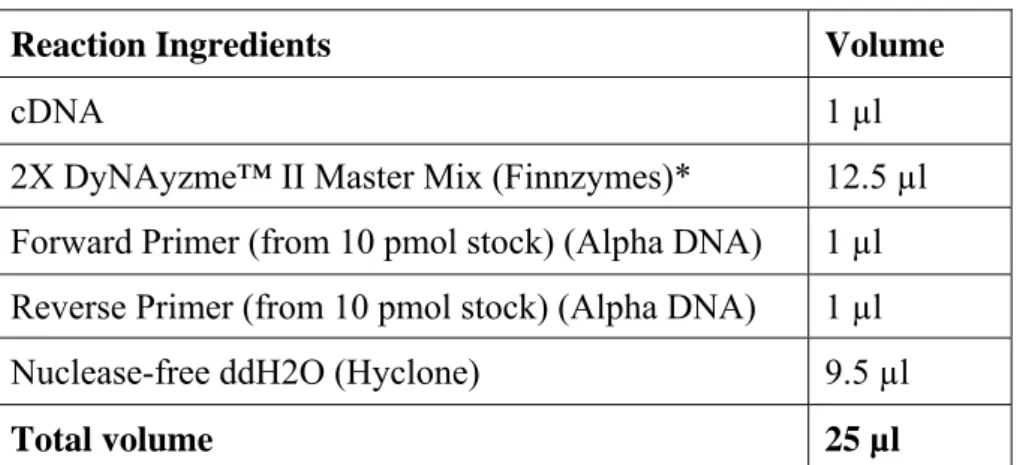
Table 3.4 - PCR Reaction Ingredients and Amounts
Reaction Ingredients Volume
cDNA 1 µl
2X DyNAyzme™ II Master Mix (Finnzymes)* 12.5 µl Forward Primer (from 10 pmol stock) (Αlpha DNA) 1 µl Reverse Primer (from 10 pmol stock) (Αlpha DNA) 1 µl Nuclease-free ddH2O (Hyclone) 9.5 µl
Total volume 25 µl
* 2x DyNAzyme™ II PCR Master Mix includes 0.04 U/μl DyNAzyme™ II DNA Polymerase, 20 mM Tris-HCI (pH 8.8 at 25°C), 3 mM MgCl2, 100 mM KCl, stabilizers and 400 μM of each dNTP. Table 3.5 - PCR conditions PCR step Rat TLR primers Rat CD marker primers Mouse TLR primers Initial Denaturation 95°C, 5’ 95°C, 10’ 95°C, 5’ Denaturation 94°C, 30’’ 94°C, 40’’ 94°C, 30’’ Annealing 55°C, 30’’ 60°C, 30’’ 60°C, 30’’ Extension 72°C, 30’’ 72°C, 40’’ 72°C, 1’ Final Extension 72°C, 5’ 72°C, 10’ 72°C, 10’ Number of cycles 30 cycle 23 cycle 30 cycle
3.2.4.4. Agarose Gel Electrophoresis and Quantification of Band Intensities
1.5% agarose gel was prepared during gel electrophoresis with 1x TAE buffer and 1 mg/ml ethidium bromide solution was used. 25 µl of PCR samples were mixed with 5 µl loading dye and 10 µl of this mixture were loaded to each well. To serve as a marker, 2 µl of low range DNA ladder (50-500 bp, Jena Biosciences, Germany) was loaded along with the gene products. Running conditions were set at 90 V power for a duration of 45 mins. Gel band intensities were visualized under UV