Quantitative Assessment of Left Ventricular Function
and Myocardial Mass: A Comparison of Coronary CT
Angiography with Cardiac MRI and Echocardiography
Bedia Kara
1ABC, Alaaddin Nayman
2DEF, Ibrahim Guler
2DF, Enes Elvin Gul
3D,
Mustafa Koplay
2CF, Yahya Paksoy
2AD
1
Department of Radiology, Buyuksehir Hospital, Konya, Turkey
2
Department of Radiology, Selcuk University, Faculty of Medicine, Konya, Turkey
3Department of Cardiology, Medipol Mega University, Istanbul, Turkey
Author’s address: Alaaddin Nayman, Department of Radiology, Selcuk University Faculty of Medicine, Konya, Turkey,
e-mail: [email protected]
Summary
Background:
The purpose of this study was to compare the left ventricular parameters obtained frommulti-detector row computed tomography (MDCT) studies with two-dimensional echocardiography (2DE), and magnetic resonance imaging (MRI), which is accepted as the gold standard in the evaluation of left ventricular functions. The study also aimed to evaluate whether or not there is a relationship between the MR-Argus and CMR tools software programs which are used in post-process calculations of data obtained by MRI.
Material/Methods:
Forty patients with an average age of 51.4±14.9 years who had been scanned with cardiac MDCTwere evaluated with cardiac MRI and 2DE. End-diastolic volume (EDV), end-systolic volume (ESV), stroke volume (SV), ejection fraction (EF), cardiac output (CO), and myocardial mass values calculated by MDCT, MRI, and 2DE were compared with each other. Two different MR software programs were used to compare left ventricular functions. The CMR tools LV tutorials method is accepted as the gold standard because it can be used in three-dimensional functional evaluation. The Pearson Correlation and Bland-Altman analysis were performed to compare the results from the two MR methods (MR-Argus and CMR tools) and the results from both the MDCT and the 2DE with the CMR tools results.
Results:
Strong positive correlations for EF values were found between the MDCT and CMR tools (r=0.702p<0.001), and between the MR-Argus and CMR tools (r=0.746 p<0.001). The correlation between the 2DE and CMR tools (r=0.449 p<0.004), however, was only moderate. Similar results were obtained for the other parameters. The strongest correlation for ESV, EDV, and EF was between the two MR software programs. The correlation coefficient between the MDCT and CMR tools is close to the correlation coefficient between the two software programs. While the correlation between 2DE and CMR tools was satisfactory for ESV, EDV, and CO values, it was at a moderate level for the other parameters.
Conclusions:
Left ventricular functional analysis can be performed easily and reliably with cardiac MDCT usedfor coronary artery evaluation and it also gives more accurate results than 2DE.
MeSH
Keywords: Echocardiography • Magnetic Resonance Imaging • Multidetector Computed Tomography •
Ventricular Function, Left
PDF fi le: http://www.polradiol.com/abstract/index/idArt/895843
Received: 2015.09.01 Accepted: 2015.09.11 Published: 2016.03.09 Authors’ Contribution: A Study Design B Data Collection C Statistical Analysis D Data Interpretation E Manuscript Preparation F Literature Search G Funds CollectionDOI: 10.12659/PJR.895843
O R I G I N A L A R T I C L EBackground
Cardiovascular disease, including coronary artery disease (CAD) and cerebrovascular disease, is the primary cause of death globally, even when including low-income and mid-dle-income countries [1–3]. Correct assessment of the left ventricular (LV) function and mass is important for diag-nostic, therapeutic, and prognostic evaluation and risk assessment of patients with CAD [4]. CAD and left ventricu-lar (LV) hypertrophy have been indicated as independent risk factors for premature death [5–8].
There are several non-invasive diagnostic methods for the evaluation of left ventricular function. Although 2DE is a widely used, inexpensive, and noninvasive method, it is operator-dependent and the acoustic window is restricted in some patients [9]. In the last decade, alternative imag-ing modalities have significantly improved in the evalua-tion of LV mass and funcevalua-tion through technological devel-opments [5]. Cardiac magnetic resonance imaging (CMRI) is a noninvasive imaging modality which does not expose the patient to ionizing radiation. Because of its high temporal and spatial resolution and consistency in the assessment of LV function and myocardial mass, it is considered the ref-erence standard for these applications [5,10,11]. However, CMRI can be difficult to obtain compared to alternative imaging modalities, such as two-dimensional echocardi-ography (2DE) and multi-detector computed tomechocardi-ography (MDCT), in acutely ill or uncooperative patients. Moreover, contraindications to CMRI, such as pacemakers, claus-trophobia, or clinical conditions that disallow long MRI examinations, can pose challenges in some patients [12,13]. Coronary CT angiography (CCTA) with MDCT is a new, noninvasive coronary artery imaging technique which is widespread and whose use has been increasing in recent years [8,14,15]. The evaluation of LV function, including end-diastolic volume (EDV), end-systolic volume (ESV), stroke volume (SV), ejection fraction (EF), and cardiac out-put, as well as myocardial mass with MDCT utilizes ret-rospective ECG-gating, which can be examined using only single-step breath holding [16,17].
The aim of this study was to compare the accuracy of measurements of LV function and myocardial mass using 64-Slice Coronary CT, 2DE, and CMRI with two different software programs, while using the CMR tools LV tutorials software, with three-dimensional results, as the reference standard.
Material and Methods
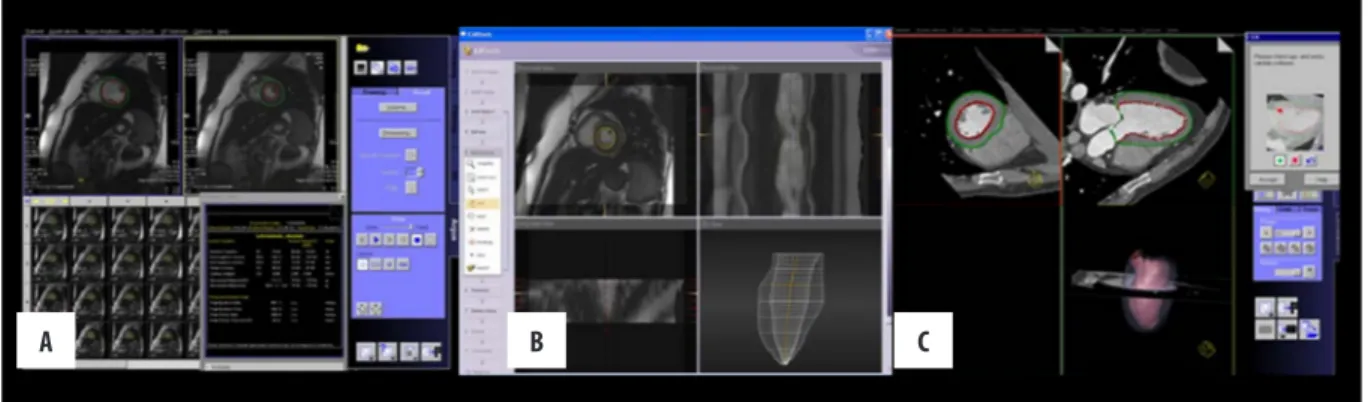
Study populationForty patients (25 male and 15 female) with a mean age of 51.4±14.9 years and an age range of 16–80 years, with known or suspected CAD, were included in this study. The age, weight, and height of the patients were recorded. All patients underwent CCTA, CMRI (Figure 1), and 2DE on the same day. The exclusion criteria for the CCTA studies were a history of contrast medium allergy, renal failure (defined as serum creatinine >1.5 mg/dL), severe arrhyth-mia, pregnancy, acute hypotension (<100 mm Hg systol-ic), and clinically unstable disease. The exclusion criteria for CMRI were cardiac pacemaker, ferromagnetic objects or implants unsafe for MRI, and claustrophobia. The study was approved by the institutional review board, and writ-ten informed consent was obtained from each patient prior to the examinations.
CT image acquisition protocol
All CCTA studies were performed on a 64-Slice MDCT scanner (Somatom Sensation, Siemens Medical Systems, Erlangen, Germany). The MDCT acquisition parameters were as follows: detector configuration 64×0.6 mm; gan-try rotation time 330 ms; and matrix 512×512, effective mAs: 870–900, kVp: 120. The pitch was set automatically by MDCT. Images were reconstructed with 0.6 mm slice thickness and 0.6 mm increments using a medium smooth tissue iterative reconstruction kernel (I26f).
Three days before the procedure, the patients’ heart rates were measured. In the case of a heart rate greater than 75 beats/min, oral beta-blocker therapy (Beloc 50–100 mg) was routinely administered. Before the procedure, heart rates and rhythms were checked again using ECG. Patients with heart rates above 75 beats/min were treated with up to three ascending doses of 5 mg/5 mL of a beta-blocker (5, 10, and 15 mg) as needed.. The scanning area was determined to be between the level of the carina and the diaphragmat-ic surface of the heart. A total of 90–100 mL of non-iondiaphragmat-ic contrast matter, containing 400 mg of iodine (Iomeron®,
Bracco, Italy), was given at a rate of 4.5–6 mL/s through an 18 G intravenous antecubital catheter using an automatic injector system (Ulrich, Medizintechnik, Germany). After the contrast was administered, flushing was carried out with 40 mL of NaCl at a rate of 6 mL/s using the automatic
Figure 1. Left ventricular analysis with (A) MR Argus, (B) CMR tools, and (C) MDCT.
injector. After performing a scenogram, one slice was taken at the level of the aortic root and bolus tracking (CARE Bolus, Siemens Medical Systems, Erlangen, Germany) was placed at that level. The scan trigger was adjusted to 100 HU (Hounsfield Unit). All patients were scanned in a crani-ocaudal direction. No complications occurred during the CT examinations.
CT data analysis
The CT images with retrospectively ECG-triggered acquisi-tion windows were applied across an adjustable poracquisi-tion of the cardiac cycle (0–100% in this investigation). For analy-sis, a series of images in the axial plane was reconstructed from the raw data in 10% steps throughout 0–100% of the cardiac cycle interval with a slice thickness of 0.75 mm and an interval of 1.0 mm. Following that, all of the data were evaluated with Circulation software on a Leonardo work-station (Siemens Medical Solutions, Erlangen, Germany). Three-dimensional reformatted images and cardiac planes were obtained with the axial plane images. The end-systol-ic and end-diastolend-systol-ic phases, interventrend-systol-icular septum, and level of the mitral valve were detected at all of the three basic cardiac planes (horizontal long axis, vertical long axis, and short axis) with Left Ventricular Analysis (LVA) software. Then, the diastolic and systolic levels of the mitral and aortic valves and the apex of the heart were detected visually and marked manually. The endocardial and epicardial borders were traced semiautomatically in both series of images. The contours were checked visually for accuracy and, if necessary, manually adjusted using a software tool (“nudge tool”). The papillary muscles were included in the LV cavity. The images obtained were also reviewed visually and corrected manually if necessary. The ESV, EDV, SV, EF, and LV myocardial masses were deter-mined. The elapsed time from inputting the data to obtain-ing the results was calculated for each patient. MDCT images were evaluated by one radiologist (Y.P) with 10 years of experience in CCTA.
MR image acquisition protocol
All CMRI studies were performed on a 1.5-T MRI system (Magnetom Symphony, Siemens, Erlangen, Germany). Patients were examined with a combination of spine and body coils in the supine position. Following scout images in the axial, coronal, and sagittal plans, functional analysis was performed with cardiac-gated, multi-segmented, cine steady-state free precession (SSFP) sequence. The CMRI acquisition parameters were as follows: 10-mm slice-thick-ness with 2-mm slice gap, TR: 60.2 ms, TE: 1.89 ms, flip angle: 80°, field of view: 320×320 mm, matrix: 192×256. To improve the quality of the images, patients were asked to hold their breath at the end of expiration. First, lower resolution scout images in the axial, coronal, and sagittal orientations were obtained. Then, long and short axis pseu-doventricular images were created from the scout images. Horizontal long axis (HLA/four-chamber) images were planned according to the long and short axis pseudoven-tricular images. Vertical long axis (VLA/two-chamber) images were planned according to the horizontal long and
short axis images. Short axis images were obtained from the mitral valve to the apex of the heart, and were planned parallel to the mitral valve. A total of 7–13 slice imag-es were obtained for all patients including all of the left ventricle. The average examination time was 20–25 min-utes. The obtained images were transferred to the work-station (Leonardo, Siemens Medical Solutions, Erlangen, Germany). For the functional analysis, two different com-mercially available software programs, Argus (Siemens Healthcare, Erlangen, Germany) and CMR tools LV tutorials (Cardiovascular Imaging Solutions, London, UK) were used.
CMRI data analysis
The endocardial and epicardial borders were traced manu-ally using both software systems and functional analysis was performed.
Analysis using Argus (Siemens Healthcare, Erlangen, Germany) Software
For each study, the end-diastolic and end-systolic phases were determined. For the detection of each phase, the larg-est and narrowlarg-est diameters of the ventricular cavity at the middle of the ventricle were used. The endocardial and epicardial borders were traced manually in short axis images in both phases. The borders of the endocardium were traced by using the intensity difference between the chamber when filled with blood and the moderate intensity of the myocardium. The papillary muscles were included in the LV volumetric analysis. While the epicardial border was being detected, the interventricular septum was included in the LV volume. The most basal slice that was surrounded by at least 50% of the myocardium with filled blood was defined as the basal segment of the left ventricle. This was included in the LV chamber volume. The apex was defined as the last slice with a visible lumen throughout the entire cardiac cycle. The ESV, EDV, SV, EF, and LV myocardial masses were determined according to the Simpson’s rule. The elapsed time from inputting of the data to obtaining the results was calculated for each patient.
Analysis using CMR tools LV tutorials (Cardiovascular Imaging Solutions, London, UK) Software
The largest and narrowest volumes for each end-diastolic and end-systolic phases were determined in the same way as the MR Argus technique. Atrioventricular valve levels were detected at the end of the sytolic and diastolic phases. All of the endocardial and epicardial borders were checked and corrected by checking the levels of the valves for all phases. Three-dimensional modeling was used and three-dimensional and movie images were obtained. The ESV, EDV, SV, EF, and LV myocardial masses were determined. The papillary muscles were included in the LV volumetric analysis. The elapsed time from inputting of the data to obtaining the results was calculated for each patient. To eliminate all operator-related differences, all image analysis procedures were performed by the same experi-enced radiologist (Y.P.) using both the Argus and CMR tools programs.
Two-dimensional echocardiography (2DE) imaging acquisition protocol
All 2DE examinations were performed using an ultra-sonography machine (Philips Ultrasound M2540A, Philips Medical Systems, Bothell, WA, USA) with a linear trans-ducer of 2.5 MHz by the same cardiologist (E.E.G.) with 5 years of experience. Patients were evaluated with two-dimensional and M-mode Doppler echocardiographic exam-inations in the left lateral decubitus position. Conventional views were as follows: parasternal long and short axis, apical four- and two-chamber. The 2DE measurements were performed based on the recommended criteria of the American Society of Echocardiography. The M-mode was used for the assessment of LV dimensions (in systole and diastole), interventricular septum thickness at the level of the mitral valve, and posterior wall thickness with parasternal long axis images. Following that, the EF and LV myocardial masses were calculated using those data. Considering the 2DE data sets, contours were manually traced around the endocardial borders using apical four-chamber and two-four-chamber images. The papillary muscles were included in the myocardial mass. The ESV and EDV for the four-chamber and two-chamber images and the SV, CO, and EF were calculated according to the Simpson’s method.
Statistical analysis
For statistical analysis, the mean values of ESV, EDV, SV, and EF were used. LV functional values were obtained from three modalities with four different calculation systems (MDCT, 2DE, and MRI with the use of the two different software systems). The data of ESV, EDV, EF, SV, CO, and myocardial mass were obtained for evaluation.
Minimum, maximum, and mean values with standard devi-ation were obtained from cardiac MDCT, CMR tools, MR Argus, and 2DE for determining the LV functional parame-ters. Continuous variables are presented as mean±standard deviation (SD).
For a linear correlation analysis, the Pearson correlation coefficient (r) and the Intraclass Correlation Coefficient (ICC) were determined. To assess the degree of agree-ment between each parameter, the Bland-Altman analysis (including 95% confidence intervals) was performed. All statistical analyses were performed using SPSS 17.0 soft-ware (SPSS; Chicago, Ilinois, USA), with a p-value of <0.05 considered statistically significant.
Results
Patients’ characteristics
Data were collected for all of the 40 patients (25 males and 15 females) enrolled in the study. The mean age of the patients was 51.4±14.9 years with a range of 16-80 years. The mean height and weight of the patients was 167.9±10.7 cm and 78.2±15.1 kg, respectively. The demo-graphic characteristics of the patients are shown in Table 1. The preliminary diagnoses of patients were as follows: coronary artery anomaly in two patients, evaluation of the bypass graft in one patient, coronary stent patency con-trol in one patient, aortic aneurysm in one patient, atypic chest pain in five patients, and CAD in the patients. All the patients were evaluated with CCTA. The definitive diagno-ses of the patients were as follows: myocardial bridge in eight patients, coronary artery anomaly in five patients, aortic aneurysm in one patient, atheromatous plaques in a significantly stenotic coronary vessel in seven patients,
N
Minimum
Maximum
Mean ±SD
Age (year)
40
16.0
80.0
51.4±14.9
Weight (kg)
40
47.0
105.0
78.2±15.12
Height (cm)
40
150.0
186.0
167.9±10.68
Table 1. The demographic characteristics of the patients.
90 80 70 60 50 40 30 20 10 0 20 30 40 50 60 70 80 90 EF (MDC T) [%] EF (CMR tools) [%] 30 20 10 0 –10 –20 –30 20 40 60 80 100 EF (MDC T) [%]
Mean EF [%] (CMR tools and MDCT)
15.65
–2.05
–19.75
Figure 2. The Pearson correlations with Bland-Altman analysis between the MDCT and CMR tools measurements of LV EF were excellent (r=0.702,
p<0.001). The ICC was R
1=0.773. LV, left ventricle; r,
Pearson correlation coefficient; and ICC – intraclass correlation coefficient.
atheromatous plaques in a not significantly stenotic coro-nary vessel in seven patients, dysfunction in the left ven-tricle in seven patients, and normal coronary arteries in eleven patients.
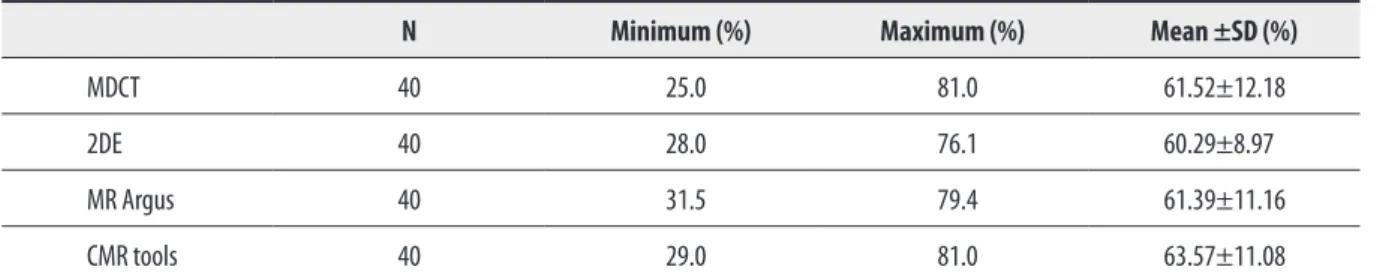
Ejection fraction
The Pearson correlation coefficients between the MDCT and CMR tools measurements of LV EF were strong (r=0.702, p<0.001) and the ICC was R1=0.773 (Figure 2).
The Pearson correlation coefficients between the 2DE and CMR tools measurements of EF were moderate (r=0.449, p<0.004) and the ICC was R1=0.611. The Pearson
corre-lation coefficients between the MR Argus and CMR tools measurements of LV EF were excellent (r=0.746, p<0.001). The best correlation and reliability was between the MR Argus and CMR tools results (Figure 3) with an ICC of R1=0.854. The EF values for MDCT, 2DE, MR Argus, and
CMR tools are listed in Table 2.
End-systolic volume and end-diastolic volume (ESV, EDV)
The Pearson correlation coefficients between the MDCT and CMR tools measurements of LV ESV were very strong (r=0.881, p<0.001) and the ICC was R1=0.935. The Pearson
correlation coefficients between 2DE and CMR tools measurements of LV ESV were also very strong (r=0.792, p<0.001) and the ICC was R1=0.854. The Pearson
correla-tion coefficients between the MDCT and CMR tools meas-urements of LV EDV were excellent (r=0.915, p<0.001) and the ICC was R1=0.948. The Pearson correlation coefficients
between the 2DE and CMR tools measurements of LV EDV were also very strong (r=0.783, p<0.001) and the ICC was R1=0.849. The Pearson correlation coefficients between
the MR Argus and CMR tools measurements of LV ESV and EDV were excellent (r=0.961, p<0.001; r=0.961, p<0.001, respectively). The ICC were R1=0.927 and R1=0.927,
respectively. Although the papillary muscles were included in the blood pool in the MR Argus analysis and the myo-cardial mass was included in the CMR tools analysis, the best correlation and reliability was found between the MR Argus and CMR tools.
Stroke volume (SV) and cardiac output (CO)
The Pearson correlation coefficients between the MDCT and CMR tools measurements of SV were good to excellent (r=0.828, p<0.001) and the ICC was R1=0.901. The Pearson
correlation coefficients between the 2DE and CMR tools measurements of SV were moderate (r=0.435, p<0.005) and the ICC was R1=0.559. The Pearson correlation
coef-ficients between the MDCT and CMR tools measurements of CO were good to excellent (r=0.796, p<0.001) and the ICC was R1=0.869. The Pearson correlation coefficients
between the 2DE and CMR tools measurements of CO were good (r=0.608, p<0.001) and the ICC was R1=0.673. The
Pearson correlation coefficients between the MR Argus and CMR tools measurements of SV and CO were good (r=0.608, p<0.001; r=0.619, p<0.001, respectively). The ICCs were R1=0.727 and R1=0.734, respectively.
90 80 70 60 50 40 30 20 10 20 30 40 50 60 70 80 90 EF (MR Ar gus) [%] EF (CMR tools) [%] 25 20 15 10 5 0 –5 –10 –15 –20 –25 20 40 60 80 100 EF [%] (C MR tools) – (MR Ar gus)
Mean EF [%] (CMR tools and MR Argus)
13.38
–2.18
–17.73
Figure 3. The Pearson correlations with Bland-Altman analysis between the MR Argus and CMR tools measurements of LV EF were excellent
(r=0.746, p<0.001). The ICC was R
1=0.854. LV, left ventricle; EF, Ejection fraction; r, Pearson correlation coefficient; and ICC – intraclass
correlation coefficient.
N
Minimum (%)
Maximum (%)
Mean ±SD (%)
MDCT
40
25.0
81.0
61.52±12.18
2DE
40
28.0
76.1
60.29±8.97
MR Argus
40
31.5
79.4
61.39±11.16
CMR tools
40
29.0
81.0
63.57±11.08
Table 2. Values of LV EF in MDCT, 2DE, MR Argus, and CMR tools.
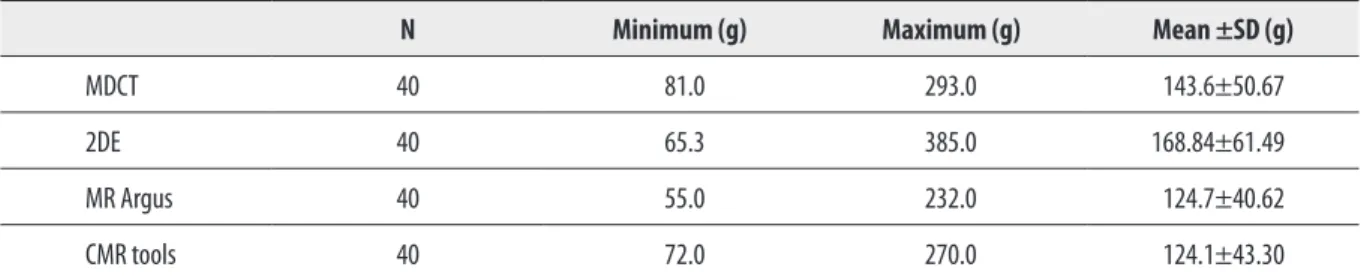
Myocardial mass
The Pearson correlation coefficients between the MDCT and CMR tools measurements of myocardial mass were excellent (r=0.884, p<0.001) and the ICC was R1=0.932
(Figure 4). The Pearson correlation coefficients between the 2DE and CMR tools measurements of myocardial mass were moderate (r=0.414, p<0.008) and the ICC was R1=0.559. The Pearson correlation coefficients between
the MR Argus and CMR tools measurements of myocar-dial mass were excellent (r=0.885, p<0.001) and the ICC
was R1=0.938 (Figure 5). The myocardial mass values for
MDCT, 2DE, MR Argus, and CMR tools are listed in Table 3. In the Bland-Altman analysis, systemic error and correla-tion of all funccorrela-tional parameters were determined for each modality with CMR tools and they were demonstrated graphically. The difference of each method from the CMR tools results and their means were calculated. The X±2SS interval of the differences were accepted as the correlation limits. The methods in which the differences were close to zero, in which the correlation limits were narrowest,
350 300 250 200 150 100 50 0 0 50 150 200 250 300 350 0 50 150 200 250 300 300 My ocar dial mass [g] (MDC T)
Myocardial mass [g] (CMR tools)
80 60 40 20 0 –20 –40 –60 My ocar dial mass [g] (C MR tools) – (MDC T)
Mean EF [%] (CMR tools and MDCT)
66.05
19.50
–27.05
Figure 4. The Pearson correlations with Bland-Altman analysis between the MDCT and CMR tools measurements of LV myocardial mass were
excellent (r=0.884, p<0.001). The ICC was R
1=0.938. LV, left ventricle; r, Pearson correlation coefficient; and ICC – intraclass correlation
coefficient.
300 250 200 150 100 50 0 0 50 150 200 250 300 350 0 50 150 200 250 300 300 My ocar dial mass (MR Ar gus)Myocardial mass (CMR tools)
80 60 40 20 0 –20 –40 –60 My ocar dial mass ( CMR tools) – (MR Ar gus)
Mean EF [%] (CMR tools and MR Argus)
40.4
0.60
–39.21
Figure 5. The Pearson correlations with Bland-Altman analysis between the MR Argus and CMR tools measurements of LV myocardial mass were
excellent (r=0.885, p<0.001). The ICC was R
1=0.932. LV, left ventricle; r, Pearson correlation coefficient; and ICC – intraclass correlation
coefficient.
N
Minimum (g)
Maximum (g)
Mean ±SD (g)
MDCT
40
81.0
293.0
143.6±50.67
2DE
40
65.3
385.0
168.84±61.49
MR Argus
40
55.0
232.0
124.7±40.62
CMR tools
40
72.0
270.0
124.1±43.30
Table 3. LV Myocardial Mass Values of LV EF in MDCT, 2DE, MR Argus, and CMR tools.
and with homogenous distribution were accepted as the methods with high correlation and with the least errors. According to these parameters, the highest correlation and the least error was between the two MR analysis meth-ods. The correlation between the MDCT and CMR tools and the limits for error were at least as good as the cor-relation between the MR Argus and CMR tools values. The difference between the 2DE and CMR tools was far from zero and the correlation limits were wider. The correlation between the 2DE and CMR tools was at a lower level when compared to the correlation between the MDCT and CMR tools.
Left ventricular function computation time with MDCT and MRI
The mean postprocessing time was 206±45 s, 250±55 s and 492±72 s for MDCT, MR Argus and CMR tools, respec-tively. According to these results, the postprocessing time was much longer for the CMR tools software than for the MDCT and MR Argus software.
Discussion
In this study, the data related to left ventricle function, which were obtained with all three modalities and two dif-ferent MR software programs, were compared. The results of this study indicate three important findings. First, in the correlation and reliability analysis, the correlation between MR Argus and CMR tools’ data in EF, ESV, and myocardi-al mass vmyocardi-alues was excellent. The cmyocardi-alculation of the same data with similar methods in both techniques could have an effect on this finding. Second, the correlation of MDCT with CMR tools was at least as good as the MR Argus method. For SV, CO, and EDV data, MDCT-CMR tools’ cor-relation was better when compared to the MR Argus-CMR tool correlation. The common characteristic of MDCT and CMR tools’ analyses is the use of three-dimensional mod-elling. We also believe that the reason for this good cor-relation is three-dimensional modelling. The degree of end-diastolic imaging quality in MDCT was at the highest level, and depending on this, the endocardial borders were clearer so the MDCT-CMR tools’ correlation in EDV values was better. Similarly for ESV data, the end-systolic imag-ing quality decreased and errors developed in the deter-mination of endocardial borders. Depending on this, ESV MDCT-CMR tools’ correlation became lower according to MR Argus-CMR. Finally, 2DE-CMR tools’ correlations were worse than MDCT-CMR tools and MR Argus-CMR tools’ correlations. In particular, an intermediate degree of cor-relation was found in myocardial mass, SV, and CO values. The 2DE-CMR tools’ correlation was poorer and the rea-son for this was thought to be related to the sensitivity of 2DE and its dependency on the patient and user factors. Furthermore, it was thought that using the measurements that were obtained with M-mode 2DE in clinical practice might have had an effect on this.
In the study of Palazzuoli et al. [18], left ventricle func-tion and volume assessment were performed with an MDCT segmental reconstruction algorithm in 93 patients and the results were compared with the 2DE results that were obtained within the last two months. The 2DE and MDCT results were evaluated with a double-blind study.
As a result, the data obtained from MDCT, which is used to assess left ventricle function and size, were better in terms of repeatability and validity when compared to 2DE. In this study, although a good correlation was detected in ESV and EDV values between 2DE and MDCT data, an inter-mediate correlation was detected in EF, CO, SV, and myo-cardial mass values; 2DE-MR correlations were similar. In the study of Yamamuro et al. [19], MDCT and MR were conducted on 50 patients. Out of those patients, 2DE was conducted on 41 patients and SPECT was conducted on 27 patients. The EDV, ESV, EF, and left ventricle mass were calculated and the obtained values were compared to the MR results, which were accepted as standard. As a result, it was observed that the left ventricle parameters calcu-lated with MDCT were well-correcalcu-lated with MR results. Furthermore, it was found that the functional analysis that was done with MDCT was more accurate than 2D-2DE or SPECT. In the study of Juergens et al. [20], the results of left ventricle volumetric and functional analyses, which were obtained by using MDCT semi-automatic analysis software, were compared with MR findings in 30 patients with coronary artery disease. It was found that the results of left ventricle volumetric and functional analyses, which were carried out with MDCT, had a good correlation with MR findings.
In the current study, the best correlation values were found between MDCT and CMR tools, and between MR Argus and CMR tools. It was observed that MDCT had more accurate and reliable results when compared with 2DE.
Finally, in the study of Akram et al. [21], left ventricle functions that were calculated with CMR and MDCT were compared in 20 patients and good and perfect degree cor-relations were obtained in all values. Furthermore, they reported that the duration of post-process procedures in calculations that were done with MDCT were 50% lower according to CMR. In that study, less time was expended for function assessment with MDCT, as well. Analysis with the CMR tools method was conducted over the long-est period of time. As a result, when all three modalities were compared, it was observed that the best correlation was between the two MR softwares. However, the correla-tion of the MDCT results with CMR was better than 2DE, whereas 2DE-CMR correlations were lower than expected. Although the gold-standard noninvasive technique to eval-uate left ventricle functions is MR, its use in clinical prac-tice for this purpose is limited, as it is an expensive and long-lasting procedure. On the other hand, CCTA examina-tion is a newer and rapidly developing noninvasive cardiac and coronary artery imaging method. As there is radiation exposure and contrast material used in this method, it is not rational to perform cardiac CCTA to assess only cardiac function. However, coronary CCTA, which is a noninva-sive coronary artery imaging method, could be also used to evaluate left ventricle functions. Thus, by using the avail-able raw data, anatomical and functional assessment could be done without leading to any increase in cost and dose of contrast material and radiation. Furthermore, it provides more reliable information compared to 2DE, which is the most commonly used method in routine practice.
Conclusions
In conclusion, with CCTA, it is possible to determine left ventricle functions together with the condition of coronary arteries in patients with coronary artery diseases more easily, and important information related to the prognosis could be obtained.
1. Nabel EG, Braunwald E: A tale of coronary artery disease and myocardial infarction. N Engl J Med, 2012; 366: 54–63 2. Meschia JF, Bushnell C, Boden-Albala B et al: Guidelines for
the primary prevention of stroke: a statement for healthcare professionals from the American Heart Association/American Stroke Association. Stroke, 2014; 45: 3754–832
3. Goldstein LB, Bushnell CD, Adams RJ et al: Guidelines for the primary prevention of stroke: a guideline for healthcare professionals from the American Heart Association/American Stroke Association. Stroke, 2011; 42: 517–84
4. Palumbo A, Maffei E, Martini C et al: Functional parameters of the left ventricle: comparison of cardiac MRI and cardiac CT in a large population. Radiol Med, 2010; 115: 702–13
5. Takx RA, Moscariello A, Schoepf UJ et al: Quantification of left and right ventricular function and myocardial mass: comparison of low-radiation dose 2nd generation dual-source CT and cardiac MRI. Eur J Radiol, 2012; 81: 598–604
6. Maron BJ, Maron MS: Hypertrophic cardiomyopathy. Lancet, 2013; 381: 242–55
7. Spirito P, Maron BJ: Sudden death and hypertrophic cardiomyopathy. Lancet, 2001; 357: 1975–76
8. Yang QH, Chen YJ, Liu QQ et al: Comparison of 320-row computed tomography coronary angiography with conventional angiography for the assessment of coronary artery disease with different atherosclerotic plaque characteristics. J Comput Assist Tomogr, 2012; 36: 646–53
9. Hazirolan T, Tasbas B, Dagoglu MG et al: Comparison of short and long axis methods in cardiac MR imaging and echocardiography for left ventricular function. Diagn Interv Radiol, 2007; 13: 33–38 10. Annuar BR, Liew CK, Chin SP et al: Assessment of global and
regional left ventricular function using 64-slice multislice computed tomography and 2D echocardiography: a comparison with cardiac magnetic resonance. Eur J Radiol, 2008; 65: 112–19
11. Beygui F, Furber A, Delepine S et al: Routine breath-hold gradient echo MRI-derived right ventricular mass, volumes and function: accuracy, reproducibility and coherence study. Int J Cardiovasc Imaging, 2004; 20: 509–16
Conflicts of interest
The authors declare that they have no conflicts of interest.
References:
12. Albers GW: Expanding the window for thrombolytic therapy in acute stroke the potential role of acute MRI for patient selection. Stroke, 1999; 30: 2230–37
13. Seneviratne SK, Truong QA, Bamberg F et al: Incremental diagnostic value of regional left ventricular function over coronary assessment by cardiac computed tomography for the detection of acute coronary syndrome in patients with acute chest pain: from the ROMICAT trial. Circ Cardiovasc Imaging, 2010; 3: 375–83
14. Ahn SJ, Kang DK, Sun JS et al: Accuracy and predictive value of coronary computed tomography angiography for the detection of obstructive coronary heart disease in patients with an Agatston calcium score above 400. J Comput Assist Tomogr, 2013; 37: 387–94 15. Williams MC, Weir NW, Mirsadraee S et al: Image quality with
single-heartbeat 320-multidetector computed tomographic coronary angiography. J Comput Assist Tomogr, 2014; 38: 444–50
16. Liew GY, Feneley MP, Worthley SG: Appropriate indications for computed tomography coronary angiography. Med J Aust, 2012; 196: 246–49
17. Liew GY, Feneley M, Worthley SG: Noninvasive coronary artery imaging: current clinical applications: Cardiac Society of Australia and New Zealand guidelines. Heart Lung Circ, 2011; 20: 425–37 18. Palazzuoli A, Cademartiri F, Geleijnse ML et al: Left ventricular
remodelling and systolic function measurement with 64 multi-slice computed tomography versus second harmonic echocardiography in patients with coronary artery disease: a double blind study. Eur J Radiol, 2010; 73: 82–88
19. Yamamuro M, Tadamura E, Kubo S et al: Cardiac functional analysis with multi-detector row CT and segmental reconstruction algorithm: comparison with echocardiography, SPECT, and MR imaging. Radiology, 2005; 234: 381–90
20. Juergens KU, Grude M, Maintz D et al: Multi-detector row CT of left ventricular function with dedicated analysis software versus MR imaging: initial experience. Radiology, 2004; 230: 403–10 21. Akram K, Anderson HD, Voros S: Quantification of left ventricular
parameters obtained by automated software for 64-slice
multidetector computed tomography and comparison with magnetic resonance imaging. Cardiovasc Intervent Radiol, 2009; 32: 1154–60