TURKISH REPUBLIC
ANKARA YILDIRIM BEYAZIT UNIVERSITY
GRADUATE SCHOOL OF SOCIAL SCIENCES
ANALYSIS OF FACTORS AFFECTING PROFITABILITY
OF INSURANCE COMPANIES IN TURKEY: PANEL DATA
APPROACH
Ph. D. DISSERTATION
Abdurrahman ÖZEN
DEPARTMENT OF BANKING AND FINANCE
Asst. Prof. Erhan ÇANKAL
ADVISOR
ONAY SAYFASI
Abdurrahman ÖZEN tarafından hazırlanan “Analysis of Factors Affecting Profitability of Insurance Companies In Turkey: Panel Data Approach” adlı tez çalışması aşağıdaki jüri tarafından oybirliği ile Ankara Yıldırım Beyazıt Üniversitesi Sosyal Bilimler Enstitüsü Bankacılık ve Finans Anabilim Dalı’nda Doktora tezi olarak kabul edilmiştir.
Ünvan Adı Soyadı Kurumu İmza
Dr. Öğr. Üyesi Erhan ÇANKAL Ankara Yıldırım Beyazıt Üniversitesi
Prof. Dr. Hakan ÇERMİKLİ Ankara Hacı Bayram Veli Üniversitesi
Doç. Dr. Atilla GÖKÇE Ankara Hacı Bayram Veli Üniversitesi
Dr. Öğr. Üyesi İklim GEDİK BALAY
Ankara Yıldırım Beyazıt Üniversitesi
Dr. Öğr. Üyesi Haroon MUZAFFAR
Ankara Yıldırım Beyazıt Üniversitesi
Tez Savunma Tarihi: 23.12.2019
Ankara Yıldırım Beyazıt Üniversitesi Sosyal Bilimler Enstitüsü Bankacılık ve Finans Anabilim Dalı’nda Doktora tezi olması için şartları yerine getirdiğini onaylıyorum.
iii
PLAGIARISM PAGE
I hereby declare that all information in this thesis has been obtained and presented in accordance with academic rules and ethical conduct. I also declare that, as required by these rules and conduct, I have fully cited and referenced all materials and results that are not original to this work; otherwise I accept all legal responsibility. 23.12.2019
iv
ACKNOWLEDGEMENTS
I would like to express my deepest gratitude to my supervisor Dr. Erhan ÇANKAL for his endless support and guidance during my study. I also would like to thank Doç. Dr. Atilla GÖKÇE for his support.
Besides, I am appreciative to the members of my thesis committee, Prof. Dr. Affan Hakan ÇERMİKLİ, Dr. İklim GEDİK BALAY ve Dr. Haroon MUZAFFAR, for their contribution to my thesis.
I also specially thank my colleague Treasury Expert Ercan GÜLEÇ for his support in insurance industry analysis and data provision.
v
ABSTRACT
Analysis of Factors Affecting Profitability of Insurance Companies in Turkey: Panel Data Approach
Profitability is important for insurance companies as it is indicator of whether they are able to continue their activities and fulfill their obligations to policyholders. In recent years, economic conditions all over the world and the market conditions peculiar to Turkey has been causing volatility in profitability of insurance companies.
The aim of this study is to find out most important firm-specific and macroeconomic variables affecting profitability of insurance companies in Turkey considering the differences of life and non-life sectors.
The study for life insurance companies covers the period between 2006 and 2017 for 16 life insurance companies. ROA and ROE are used as measures of profitability. According to the dynamic panel data model results, lagged value of ROA and ROE, premium growth rate, age, GDP growth rate, interest rate and pension activity have positive impact on profitability while expense ratio, leverage ratio and liquidity have negative impact.
The study for non-life insurance companies covers the period between 2006 and 2017 for 21 companies. ROA is used as measure of profitability. According to the fixed effects panel data model results, size, liquidity, investment yield, age, GDP growth rate and interest rate have positive impact on profitability while premium growth rate, loss ratio, leverage ratio and solvency have negative impact.
vi
ÖZET
Türkiye’deki Sigorta Şirketlerinin Karlılığını Etkileyen Faktörlerin Analizi: Panel Veri Yaklaşımı
Sigorta şirketlerinin faaliyetlerini sürdürebilmesi ve sigortalılara karşı yükümlülüklerini yerine getirebilmesi açısından önemli bir ölçüt olan karlılık, ekonomik şartların ve iklim değişikliklerinin etkisiyle tüm dünyada sigorta şirketlerinin finansal performansının kötüleştiği ve Türkiye’de piyasaya özgü şartlar nedeniyle yüksek dalgalanmaların görüldüğü bir ortamda daha önemli bir hal almıştır.
Bu çalışmanın amacı Türkiye’deki sigorta şirketlerinin karlılığını etkileyen en önemli firmaya özgü ve makroekonomik değişkenleri bulmaktır. Çalışma hayat sektörü ve hayat-dışı sektör için ayrı ayrı yapılmıştır.
Hayat sektörü için yapılan çalışma 2006-2017 dönemini ve 16 hayat sigorta şirketini kapsamaktadır. Aktif karlılığı (ROA) ve özsermaye karlılığı (ROE) karlılık ölçütü olarak alınmıştır. Dinamik panel veri modeli sonuçlarına göre aktif karlılığı ile özsermaye karlılığının bir yıl gecikmeli değerleri, prim büyüme oranı, yaş, Gayrisafi Yurtiçi Hasıla (GSYİH) büyüme oranı, faiz oranı ve bireysel emeklilik faaliyeti ile karlılık arasında olumlu yönde ilişki tespit edilmiş, masraf oranı, kaldıraç oranı ve likidite ile karlılık arasında olumsuz yönde ilişki tespit edilmiştir.
Hayat-dışı sektörü için yapılan çalışma 2006-2017 dönemini ve 21 hayat-dışı sigorta şirketini kapsamaktadır. Aktif karlılığı karlılık ölçütü olarak kullanılmıştır. Sabit etkiler panel veri modeli sonuçlarına göre karlılık ile büyüklük, likidite oranı, yatırım getirisi, yaş, GSYİH ve faiz oranı arasında olumlu yönde; prim büyüme oranı, hasar prim oranı, sermaye yeterliliği oranı ve kaldıraç oranı arasında olumsuz yönde ilişki tespit edilmiştir.
vii
TABLE OF CONTENTS
ABSTRACT ... v
ÖZET ... vi
TABLE OF CONTENTS ... vii
LIST OF ABBREVIATIONS ... x
LIST OF TABLES ... xi
LIST OF FIGURES ... xii
1. INTRODUCTION ... 1
2. THEORETICAL AND CONCEPTUAL FRAMEWORK OF INSURANCE . 5 2.1. Definition of Insurance ... 5 2.2. Definition of Risk ... 6 2.3. Principles of Insurance ... 7 2.4. Functions of Insurance ... 8 2.5. Insurance Types ... 9 2.5.1. Life Insurance ... 10 2.5.2. Property Insurance... 11
2.5.3. Liability (Casualty) Insurance ... 11
2.6. Reinsurance ... 12
2.7. Coinsurance ... 12
3. THEORETICAL AND CONCEPTUAL FRAMEWORK OF PROFITABILITY 14 3.1. Definition of Profitability ... 14
3.2. Profitability Measures ... 16
3.2.1. Return on Equity ... 16
3.2.2. Return on Assets... 17
3.2.3. Technical Profitability Ratio ... 17
3.2.4. Profit Margin ... 18
3.2.5. Return on Invested Capital ... 18
3.2.6. Embedded Value Approach ... 18
3.3. Firm-Specific Drivers of Profitability ... 19
3.3.1. Loss Ratio ... 19
3.3.2. Expense Ratio ... 22
viii
3.3.4. Liquidity ... 23
3.3.5. Leverage Ratio ... 24
3.3.6. Size ... 26
3.3.7. Age ... 26
3.3.8. Other Firm-Specific Drivers... 26
3.4. Macroeconomic Drivers of Profitability ... 28
3.4.1. GDP Growth ... 28
3.4.2. Interest Rate... 28
3.4.3. Inflation ... 29
3.4.4. Stock Market Index ... 29
3.4.5. Exchange Rate ... 30
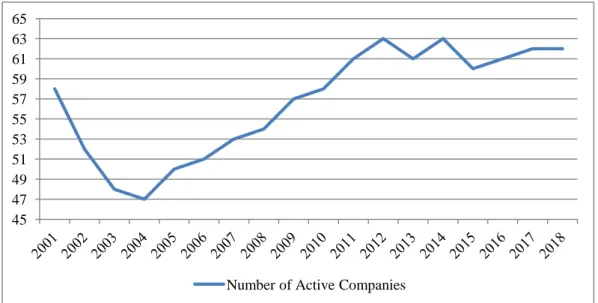
4. TURKISH INSURANCE INDUSTRY ... 31
4.1. General Assessment of Turkish Insurance Industry ... 31
4.2. Mandatory Motor Vehicle Third Party Liability (Traffic) Insurance ... 36
4.3. World Insurance Markets ... 40
4.4. Financial Assessment of Turkish Insurance Industry ... 41
4.5. Recent Developments Affecting Profitability of Insurance Companies ... 49
5. LITERATURE REVIEW ... 51
5.1. Studies Conducted About the Profitability of World Insurance Industry ... 51
5.2. Studies Conducted About the Profitability of Turkish Insurance Industry ... 58
6. EMPIRICAL ANALYSIS ... 61
6.1. Econometric Background ... 61
6.1.1. Panel Data ... 61
6.1.2. Fixed Effects Panel Data Model... 62
6.1.3. Random Effects Model... 63
6.1.4. The Choice of Fixed and Random Effects Regression ... 64
6.1.5. System Generalized Method of Moments (System GMM) ... 64
6.2. Empirical Analysis for Life Insurance Companies ... 65
6.2.1. Data and Descriptive Statistics ... 65
6.2.2. Specification of The Model ... 68
6.2.3. Panel GMM Estimation Results ... 68
6.3. Empirical Analysis for Non-Life Insurance Companies ... 73
ix
6.3.2. Specification of The Model ... 76
6.3.3. Regression Results ... 78
7. CONCLUSION ... 83
8. REFERENCES ... 90
9. APPENDIX ... 96
x
LIST OF ABBREVIATIONS
DASK: Mandatory Earthquake Insurance EVA: Embedded Value Approach
GMM: Generalized Method of Moments MM: Franco Modigliani and Merton Miller
OECD: Organization for Economic Co-operation and Development ROA: Return on Assets
ROE: Return on Equity ROI: Return on Investment ROIC: Return on Invested Capital VIF: Variance Inflation Factor
xi
LIST OF TABLES
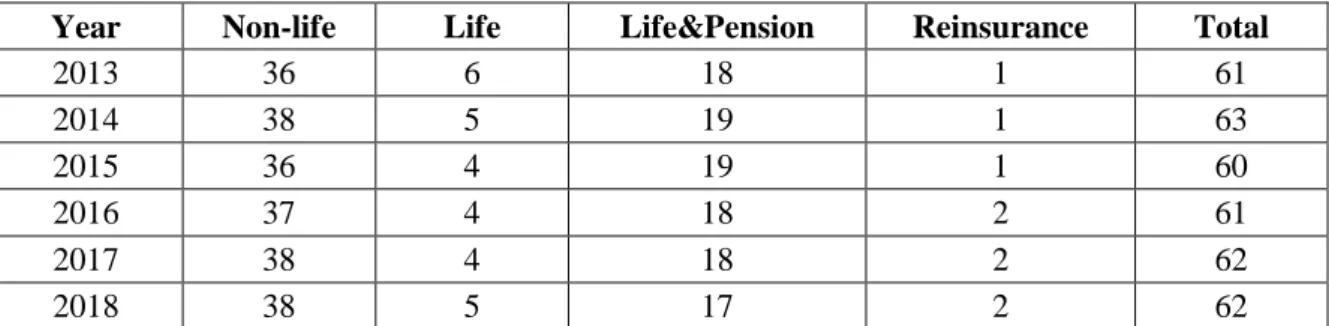
Table 1. Number of active companies in the industry ... 32
Table 2. Share of foreign capital ... 32
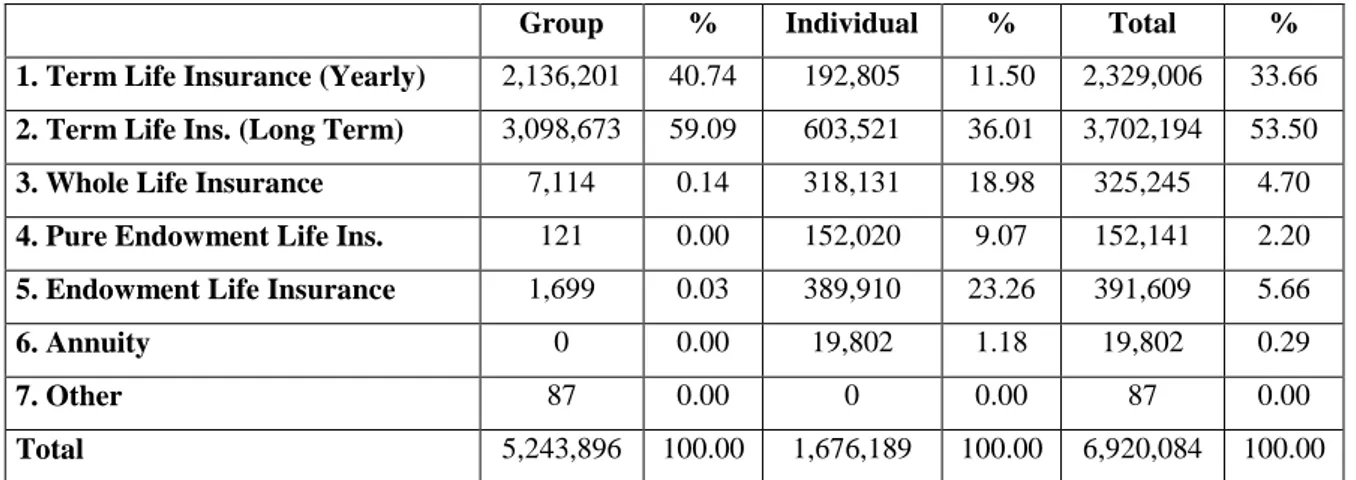
Table 3. Distribution of life insurance gross written premium in 2018 (TL) ... 35
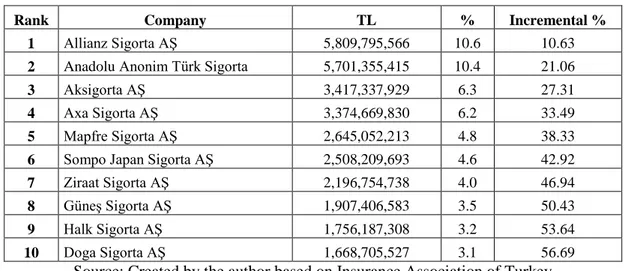
Table 4. Premium production of top ten insurance companies in 2018 ... 36
Table 5. Financial sector assets ... 36
Table 6. Some figures related to world insurance markets in 2017 ... 41
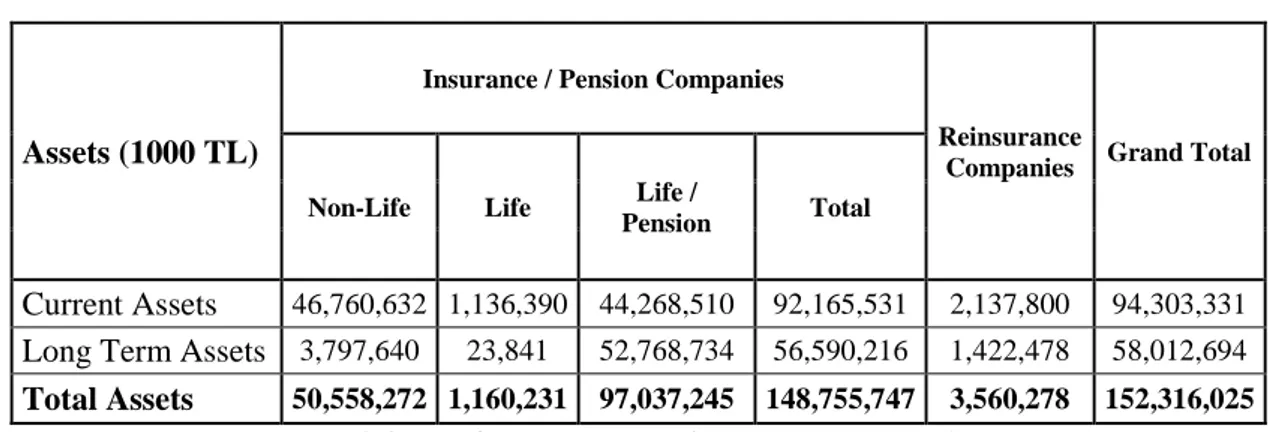
Table 7. Assets of companies in the industry in 2017 ... 41
Table 8. Assets of companies in the industry in 2017 ... 42
Table 9. Passive side of balance sheet of the companies in 2017 ... 44
Table 10: Portion of insurance technical profit in life/pension companies ... 48
Table 11. Review of studies abroad... 55
Table 12. Review of studies on Turkey ... 59
Table 13. Descriptive statistics ... 66
Table 14. Unit root test results ... 67
Table 15. Correlation matrix ... 67
Table 16. Definition of variables ... 69
Table 17. Panel GMM estimation results ... 70
Table 18. Ranking of regression coefficients ... 72
Table 19. VIF values ... 73
Table 20. Descriptive statistics ... 74
Table 21. Unit root test results ... 75
Table 22. Correlation matrix ... 76
Table 23. Definition of variables ... 77
Table 24. F test, Score test and Hausman test results ... 77
Table 25. Regression results for the dependant variable ROA ... 78
Table 26. Ranking of regression coefficients ... 81
Table 27. VIF values ... 82
Table 28. ROA model results for life insurance companies ... 96
Table 29. ROE model results for life ınsurance companies ... 97
Table 30. Regression results for non-life insurance companies ... 98
xii
LIST OF FIGURES
Figure 1. ROE formula ... 16
Figure 2. ROA formula ... 17
Figure 3. Technical profitability ratio formula ... 17
Figure 4. Profit margin formula ... 18
Figure 5. ROIC formula ... 18
Figure 6. Loss ratio formula ... 20
Figure 7. Expense ratio formula ... 22
Figure 8. Premium growth rate formula ... 23
Figure 9. Current ratio formula... 24
Figure 10. Leverage ratio formula ... 26
Figure 11. Premium retention ratio formula ... 27
Figure 12. Number of active companies in Turkish insurance industry ... 31
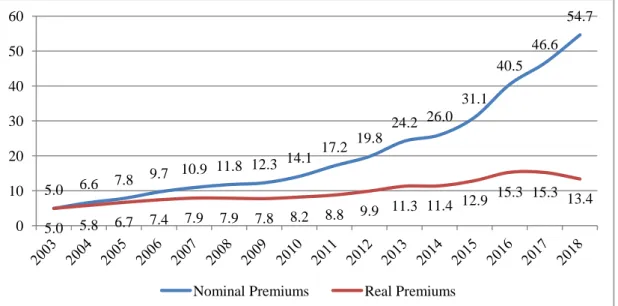
Figure 13. Gross written premium production (Billion TL) ... 33
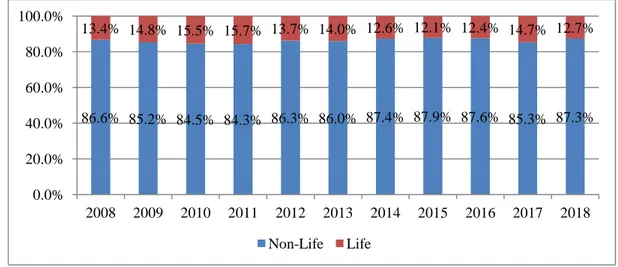
Figure 14. Distribution of gross written premium production ... 34
Figure 15. Share of branches in non-life premium production (%)... 34
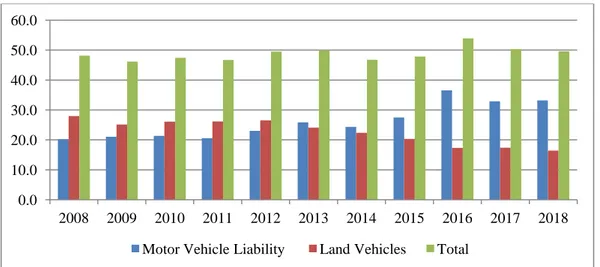
Figure 16. Share of motor insurance in total non-life premium (%) ... 37
Figure 17. Premium growth rates of motor vehicle liability branch and total non-life (%) 38 Figure 18. Technical profit data of motor vehicle liability branch and total non-life (TL). 38 Figure 19. Paid claims, outstanding loss reserves and technical profit of motor vehicle liability branch (TL) ... 40
Figure 20. Loss, expense and technical profitability ratios of non-life companies (%) ... 46
Figure 21. Loss, expense and technical profitability ratios of life&pension companies (%) ... 46
Figure 22. ROE, ROA and technical profitability ratios of non-life companies (%) ... 47
Figure 23. ROE, ROA and technical profitability ratios on life & pension companies (%) 47 Figure 24. Technical profits of the companies in the turkish insurance market (TL) ... 48
1
1. INTRODUCTION
Insurance have been providing protection for people against damages of unwanted events such as flood, car accident, earthquake or storms for years. People transfer the risks stemming from unwanted events to insurance companies in exchange for premiums. Insurance companies create pools through collected premiums and indemnify the people exposed to unwanted events from these pools.
Insurance has been very effective way of risk transfer because of its functions. By paying affordable premiums during comfortable times people mitigate negative effects of unwanted events via insurance. In this way, insurance makes people get rid of anxieties, make plans more bravely. Insurance helps entrepreneurs develop new businesses by giving security. By creating huge funds via premiums and channeling them through financial markets, insurance finances those who need funds for creating new businesses or expanding existing businesses. Insurance prevents socioeconomic losses via products such as unemployment insurance, reduces number of unwanted events by encouraging people to take precautions, generates employment, provides income in the form of tax for government, enhances international trade via product types such as export insurance. As a result, insurance sector contributes to economic growth and welfare (Öner Kaya, 2015).
Because of these benefits, insurance is given much importance by all parts of society. Insurance industry has reached an enormous size in the world in 2018 with the premium production of 5 trillion U.S. Dollars. Insurance industry in developed countries produced huge amounts of premium such as 1.4 trillion U.S. Dollars for United States which is ranked number one in total premium volume in 2018 (Swiss Re, 2019). Developing countries, on the other hand, work to produce strategies to develop insurance markets.
Premium production in Turkey reached to 54.6 billion TL in 2018. In an exchange, 126.9 trillion TL coverage that is 34 times GDP of Turkey was provided to insureds by insurers (Ministry of Treasury and Finance, 2019). The size of Turkish insurance market is rather small compared to that of the developed countries. Turkey is ranked 63 in insurance density (premium per capita) and 72 in penetration (premiums as of GDP) in 2017. Total written premium in 2017 was 12 billion dollars. Insurance industry in Turkey is also rather
2
small compared to banking industry, which is around 21 times greater than insurance industry in terms of assets. These figures tell us that the industry has great growth potential. The development of insurance in Turkey has passed troubled phases. Determination of premiums based on competition instead of statistical methods, inaccurate distribution of dividends, underdevelopment of actuary science and that intermediaries did not transfer the premiums they collected from policyholders to insurers in the 1990s caused bankruptcy of some insurers in the beginning of 2000s. The regulations related to financial sector due to the European Union accession process were beneficial to insurers.
Importance of Turkish insurance sector has been more viable recently because of the remarkable number of factors affecting the sector profitability. The analysis of the industry showed that traffic insurance has an important place. The global financial crisis in 2008, removal of government control in traffic insurance premium tariffs in 2008, considerable foreign capital injection, intense competition, the change of estimation method of technical reserves for IBNR (Incurred But Not Reported) required by regulation, the verdicts of Supreme Court about coverage of traffic insurance, the withdrawal of licenses of two insurance companies, the implementation of ceiling on traffic insurance premiums, the creation of Risky Insureds Pool at traffic insurance and the large increases in minimum wage set by the government (30% increase in 2016 and 26% increase in 2019) had great impact on insurance industry profitability.
So that insurers can keep providing coverage and meet their obligations to policyholders, they need sound financial performance. Profitability is constantly used as a measure of financial performance. It is among targets of financial managements. International institutions such as OECD, NGOs and companies such as Swiss Re give place to profitability in their reports because of its importance. Potential investors, lenders, current stockholders, clients, regulators and the management benefit profitability for different purposes. Potential investors utilize profitability in investment decision-making process and judge management. Lenders check profitability of companies to decide whether to extend credit for the company or not. Current stockholders try to understand how well the company is managed and whether it is rational to keep stocks of the company and try to decide how to allocate capital efficiently. Current and potential clients look at the probability of the company to see if it is able to meet its obligations and decide whether it is wise to buy the company’s products. The regulators evaluate the company’s financial
3
viability and capacity to meet its obligations. Managements make use of profitability measures in various business lines and markets for measuring efficiency and decision making process.
2008 global financial crisis and its ongoing effects, low interest rate environment and increasing natural disasters because of global warming have been negatively affecting insurance industry profitability in recent years. For those reasons and its importance, insurance company profitability has been attracting attention of scholars in recent years.
There are different measures as indicators of profitability. Return on Assets (ROA), Return on Equity (ROE), Technical Profitability Ratio, Profit Margin, Return on Invested Capital (ROIC) and Embedded Value Approach (EVA) are important profitability measures used by different stakeholders. ROA and ROE are frequently used as indicator of profitability in studies as the data needed to calculate these measures are easy to find and calculation of them is not difficult.
Literature review on the profitability of Turkish insurance sector has shown that there is no remarkable number of studies regarding the issue despite its importance. Three studies were come across regarding determinants of profitability of insurance industry in Turkey. (Doğan, 2013) examined the influence of firm-specific factors on the profitability of insurance companies listed on the Istanbul Stock Exchange for the period 2005-2011 by employing multiple regression and correlation methods. (Öner Kaya, 2015) investigated the firm-specific factors affecting the profitability of 24 non-life insurance companies operating in Turkey for the period 2006-2013 by using static panel data models. (Öner Kaya & Kaya, 2015) investigated the firm-specific factors affecting the profitability of 17 life insurance companies operating in Turkey for the period 2008-2013 by using static panel data models.
The aim of this thesis is to examine the factors affecting insurance company profitability in Turkey. We believe that detecting these factors will help managers of insurers, investors, regulators and potential policyholders in making their decisions. For this purpose, this thesis is seeking the answer of this question: Which factors affect profitability of insurance companies in Turkey?
4
1) H0: There are significant relationship between life insurer profitability and
firm-specific factors and macroeconomic factors.
2) H0: There are significant relationship between non-life insurer profitability and
firm-specific factors and macroeconomic factors.
This study differentiates from previous studies as it covers greater time span (2006-2017), includes macroeconomic variables in addition to firm-specific factors and employs both static and dynamic panel data models.
In the second chapter of this thesis we will discuss and try to understand insurance concept. In the third chapter, we will discuss the concept of profitability. The fourth chapter will cover the analysis of Turkish insurance industry in detail. The literature review will be covered in the fifth chapter. In chapter six, the empirical analysis will be performed employing the panel data models. The chapter seven will cover the conclusions and recommendations where the findings and the analysis are evaluated.
5
2. THEORETICAL AND CONCEPTUAL FRAMEWORK OF
INSURANCE
Insurance is very important for society in order to be protected against negative effects of undesired events and continue living comfortably. So that insurance exists insurers have to continue their activities. Profitability is a measure of insurance company financial performance to assess if it is able to survive. It is very important to understand the basics of insurance to delve into profitability concept. For this reason, theoretical and conceptual framework of insurance is examined in this chapter.
2.1. Definition of Insurance
There have been lots of unwanted events such as death, accident, flood etc. since the existence of human being. People have always been exposed to the risk of happening of these events. When these events happen, people could encounter irrevocable results. The possibility or thought of occurrence of these events cause anxiety in people and people try to take measures in order to avoid risks. The most common way of avoiding risks is insurance.
There are various definitions of insurance in literature. In general, those definitions focus on “risk transfer” and “pooling”.
Insurance is transfer of risk in return of a monetary value (Çipil, 2013). People pay small amounts of money called premium to an insurer and insurer undertakes the risk. When the risk happens, insurer indemnifies the insured. In this way, insured gets rid of risk.
“Insurance is a system of gathering homogeneous people and compensating from the pool those people paid into when a damage occurs” (Kırkbeşoğlu, 2014, p. 46). By paying small amounts of money to the system, funds are collected in a pool and a huge amount of money is created. When the risk happens, the losses are paid by the pool.
(Dror & Piesse, 2014, p. 24) define insurance as “a concept involving a contract under which an insurer shall pay specific pre-defined compensation when financial
6
damages are caused by pre-defined cost-generating events, in exchange for up-front payments of a premium by the insured.”
2.2. Definition of Risk
Risk is very important in defining insurance as insurance has emerged against risks. In other words, if there was no risk there was no insurance either.
Risk is generally defined as uncertainty of a danger. (Dumanoğlu & Gedikoğlu, 2004, p. 5) defines risk as “Occurrence probability of an undesired event”. To be able to mention about risk there has to be an undesired event that could cause loss and probability of that event. We cannot know happening time of some events and whether they will happen such as accident. Some events such as death has a probability of one which means it will happen certainly but the risk originating from death is caused by the time of death which is unknown.
The sources of risk are as follows (Pekiner, 1981, p. 3); - Social Risk Sources: Theft, sabotage, accidents etc. - Physical Risk Sources: Fire, natural events etc.
- Economical Risk Sources: Events emerging after capital activities.
Risks can be classified as speculative risks and pure risks. At speculative risks there is probability of loss when the event happens and there is also probability of gaining high profit if the event does not happen. Stock market investments and gambling can be stated as speculative risk examples. These events could cause both gain and loss. Pure risks, on the other hand, could cause only loss or zero gain. In other words, there is no probability of gain at pure risks. As insurance is a guarantee instrument and it is not an instrument of enrichment, speculative risks are generally out of insurance coverage.
Another discrimination of risk is whether it is diversifiable (particular) or non-diversifiable (fundamental) risk. Causes and results of losses generate the difference. Diversifiable risks affect only one or few people such as car accident. They can be alleviated or eliminated by diversification such as creating a portfolio of financial instruments having different risk characteristics. Non-diversifiable risks affect whole community, economy or a large number of people such as economic downturn, hurricane etc. Nondiversifiable risks cannot be eliminated or alleviated by diversification.
7
“Nondiversifiable risks such as floods and widespread unemployment are difficult to insure privately because the characteristics of an ideal insurable risk are not easily met” (Rejda & McNamara, 2014, p. 6). Coping with nondiversifiable risks are generally responsibility of governments such as social insurances, subsidies.
As it can be understood from above, not all the risks are in the scope of insurance. The following conditions must be met in order that insurance covers risks;
Loss must be random,
Risk must be justifiable and quantifiable,
Premium must be countable and met by insured,
Large number of people having similar characteristics have to come together (Law of large numbers),
Risk must be legal.
2.3. Principles of Insurance
There are 6 principles of insurance in literature. These principles are the main rules for an insurance contract to be made. They are explained below.
Insurable Interest: Because insurance contract covers the monetary interest on insured good, insured must be exposed to a legally valid monetary loss when subject matter of insurance is damaged or lost. It means there has to be a benefit for the insured to make an insurance contract.
Utmost Good Faith: Before and during the contract, both parties have to display utmost good faith towards each other. From insured’s perspective, this means giving all and correct information related to the subject matter. From insurer’s perspective, it means giving all and correct information about conditions of the contract and meeting responsibilities when risk happens.
Indemnity: Main target of an insurance contract is to restore the economic situation of policyholder to the situation before the event. It means compensation should not cause any gain or loss for the policyholder.
Subrogation: Subrogation means passing insured person’s right of ownership to insurer after insurer compensates insured for the loss. Hereby, insurer will be able to demand the compensation from third parties causing the damage.
8
There are 3 purposes of subrogation principle (Rejda, 2001, p. 89):
1. Preventing insured person to get compensation both from insurer and the people causing damage.
2. Ensuring insurer to claim compensation amount it paid to insured from the people causing the damage.
3. Decreasing indemnity amount in general.
Contribution to the loss (Double Insurance): When insured has more than one insurance contract on the same subject matter, he has the right to demand compensation from any insurance company. If an insurance company fully compensates the insured, then it has the right to demand the proportionate contribution from other insurance companies. Thereby, when an insured is fully compensated by one insurer, then the insured cannot apply to other insurers which will prevent the insured to make profit out of insurance contract. In order this principle to be valid, there are 3 conditions (Gupta, 2008, p. 24):
1. Contracts must cover the same danger
2. Contracts must cover the same subject matter
3. Affected person or property in contracts must be the same insured.
Principle of Causa Proxima (Nearest Cause): If sequential events bring about the loss and insurance policy does not cover all the causes, the nearest cause is needed to be find out to be able to pay the loss. If the proximate cause is one of the causes determined in the contract, then the insurance company is obliged to compensate the insured. For instance, if an insured has fire coverage but not earthquake and his office burns because of earthquake, then the insured cannot be compensated. Because earthquake coverage which is proximate cause of fire is not covered in the contract.
2.4. Functions of Insurance
Insurance mechanism provides funds to the ones exposed to risks by collecting premiums from the insured persons who want to be protected against risks. By doing this, it contributes to lots of people, entities or industries in different ways.
First; by reducing risks and uncertainty insurance provides predictability and safety. When one knows that he will be compensated when an undesired event happens, he gets
9
rid of anxieties and lives more comfortably. Then, when an undesired event happens, people can continue their life as if there was no negative event. From entities’ perspective, it ensures them to make decisions more bravely and contributes to establishment of new entities and development of current entities.
Second; by collecting small amounts of money which is called premium and creating huge funds, insurance becomes an important savings resource. These resources are channeled to financial markets by investing in stocks, bonds and other financial instruments. These funds are used by entities in different industries and become sources of investments. Thus, industries can develop by making new investments. Life insurance, especially investing in long-term financial instruments, is a great source of investments in developed countries. Moreover, insurance companies help capital markets to evolve by operating as financial intermediary (Genç, 2002).
Third; by insurance types such as unemployment, insurance mechanism prevents socioeconomic losses. Precautions that are taken and the features such as making discount if there was no accident in former contract term prevent undesired events to happen.
Fourth; actors, operating in insurance sector such as insurance companies or intermediaries, generate employment. These actors also pay tax to government.
Fifth, export credit insurance which serves as guarantee to the issuer of credit, eases issuing of export credits. Transportation insurance reduces risks in overseas transportation. All these help international relations and trade to develop.
2.5. Insurance Types
The first discrimination of insurance is whether it is social or private. The insurance applications provided by governments to a wide range of citizens such as health and unemployment are called social insurances. The coverage of this study is private insurances.
Private insurance is discriminated as life insurances, property insurances and liability insurances.
10
2.5.1. Life Insurance
“Life insurance provides protection in the event of untimely death, illnesses, and retirement” (Saunders & Cornett, 2012, p. 476). Originally, life insurance’s main value proposition was death protection. Today, life insurers offer products that cover many risks such as disability, illness, longevity. It also helps individuals finance retirement via pension and annuity products. Around 85% of global life insurance premiums in 2016 were underwritten through life insurance products combining both risk protection and wealth accumulation. This figure makes these products the most important source of income for life insurance sector (Swiss Re, 2017). Conversely, 91% of life insurance premium in Turkey was generated in life insurance products which do not include savings element (term life insurance). Life insurance products can be classified in accordance with the type of protection or benefit.
The first type of life insurance products is Term Life Insurance. Main function of Term Life Insurance which is the closest to pure life insurance is to pay beneficiary a certain amount of compensation fixed in the contract when insured dies during the coverage period. If the insured does not die in the term of the insurance policy, the insured losses all the rights attained with the insurance policy. It benefits the people who are deprived of dead person’s monetary support. Term Life Insurance does not include savings element.
Whole Life Insurance provides protection for the entire life of the insured contrary to Term Life Insurance providing protection for a certain period. In other words, coverage period in Whole Life Insurance is the entire life of the insured. Death time of the insured is not limited to a specified period and it is certain that the insurance company will pay the compensation as long as the beneficiary does not avoid paying periodic premiums. Premium payments in the early years are higher in Whole Life Insurance contrary to those in Term Life Insurance.
Endowment Life Insurance is an insurance which savings element is added to term life insurance. Insured person gets a certain amount (face amount) of payment after an endowment date (savings element of the insurance). If he dies before the endowment date beneficiaries get a certain payout (term life insurance part of the insurance).
11
Credit-Life Insurance protects the lender if the borrower dies before repaying the debt. In this case, insurer pays the lender unpaid balance of the debt.
Annuity products pay out a fixed stream of payments to individuals, primarily used as an income stream for retirees in exchange for a sole payment or payments done in several years in the accumulation phase. Annuities function in the opposite way of life insurance basics. “While life insurance involves different contractual methods to build up a fund and the eventual payout of a lump sum to the beneficiary, annuities involve different methods of liquidating a fund over a long period of time, such as paying out a fund’s proceeds to the beneficiary” (Saunders & Cornett, 2012, p. 480). Death benefit in the accumulation phase and periodical payments in the retirement phase can be guaranteed in annuity contracts, depending on their structure (Swiss Re, 2012).
Health Insurance covers sickness-related expenses, if the insured has health problems covered in the contract during the contract term.
Personal accident insurance pays the losses of the insured, if the insured is injured or gets sick in one of the circumstances covered in the contract during the contract term. If the insured is permanently injured, a fixed amount is paid to the insured. If the insured dies, a fixed amount is paid to the beneficiary.
2.5.2. Property Insurance
In this type of insurance, subject matter of insurance contract is a property and insurance protects insured persons against financial losses of property damage. Kasko, fire, earthquake, agriculture and transportation are some of the examples of property insurance. All types of property, right and receivable whose monetary value can be calculated and determined beforehand are subject matter of property insurance (SEGEM, 2009).
2.5.3. Liability (Casualty) Insurance
Liability insurance is a type of insurance in which liabilities of insured persons against third parties are covered in the contract. Insurer compensates losses of third parties caused by activities of insured. This type of insurance is quite important because third parties who do not have any responsibility or mistake in undesired event are compensated.
12
As the payment responsibility is transferred to a supervised insurer, whether the insured’s financial situation is good or bad is not important. For this reason, most of liability insurances are mandatory in many countries. Motor Vehicle Mandatory Third Party Liability Insurance (Traffic Insurance) is an example for this type of insurance which is made mandatory by Road Traffic Law in Turkey.
2.6. Reinsurance
(Insurance Information Institute, 2018) defines Reinsurance as “Reinsurance is insurance for insurance companies. It’s a way of transferring or ceding some of the financial risk insurance companies assume in insuring cars, homes and businesses to another insurance company, the reinsurer.”
Insurance companies transfer their risk via reinsurance when they have too much exposure to a potentially costly event. In this situation that event could cause the company to go bankrupt if it is unable to cover the losses and it was not protected via reinsurance.
Sometimes insurers make use of reinsurance mechanism when they want to lower their liability potential to reduce the amount of capital they are required to maintain in reserves. Regulation requires insurers to have sufficient capital in reserves to pay the possible claims associated with their issued policies. Even if their insurance company goes under, consumers' losses will be covered thanks to this regulation.
Reinsurer pays commission to insurance company in this mechanism. When insurer transfers the risk to reinsurer, insurer acts like an intermediary. When loss happens, customers apply to insurance company and gets compensation from it.
2.7. Coinsurance
Coinsurance generally means that same risks are insured by more than one company. More than one company take risks and are responsible for the losses. When the loss emerges, insurance companies participate in the expenses according to their share. Sometimes insurance risks are shared between insured and insurer. For example, when a loss happens, insurance company pays 80% of the expenses, 20% is paid by the insured. This implementation is also called coinsurance.
13
Insurance companies use this mechanism to insure huge risks which they cannot undertake alone. In this situation responsibility and premiums are shared among insurance companies proportionately. Thus, insurance company is not deprived of potential profit even if the risks are too high.
14
3. THEORETICAL AND CONCEPTUAL FRAMEWORK OF
PROFITABILITY
In this chapter, profitability will be defined, the ratios used to measure profitability and the drivers of profitability both firm-specific and macroeconomic will be examined in detail.
3.1. Definition of Profitability
It is very important for companies to perform financially well in order to continue their activities or grow. Companies having good financial performance can cope with difficulties, attract capital for growth opportunities and hence, maximize shareholder wealth.
Profitability measures financial performance of firms. It demonstrates how well a company has performed financially in previous periods and gives an insight about the company’s future outlook. Potential investors, lenders, current stockholders, clients, regulators and the management of company benefit profitability for different purposes. Potential investors utilize profitability in investment decision making process and to judge management. Lenders check profitability of companies to decide whether to extend credit for the company or not. Current stockholders try to understand how well the company is managed and if it is logical to keep stocks and they try to decide how to allocate capital efficiently. Current clients look at the probability of the company if it is able to meet its obligations. Potential clients decide whether it is wise to buy the company’s products. Regulators evaluate the company’s financial viability and capacity to meet its obligations. Managements make of use profitability measures in various business lines and markets for measuring efficiency and decision making process.
“A profitability measurement baseline is one of the most valued time-phased tools used by firms to determine their growth and overall financial health over a given period of time and can also be used to compare similar firms across the same industry or to compare industries or sectors in aggregation” (Nyairo, 2015, p. 3).
15
In order to create stable insurance markets which benefit and protect policyholders, proper financial performance is a must (Pavic Kramaric, Miletic, & Pavic, 2017). Insurers having favorable financial performance are the firms that have low risk of bankruptcy and the strength to meet their responsibilities. In areas where private life insurance substitutes or complements public social safety provisions steering, financial stability of insurers is more important (Swiss Re, 2012).
From accounting perspective, profitability means ability to create profit. Profit, also called net income, is an accounting measure calculated as subtracting expenses, taxes and preferred dividends from revenues. Generating profit is very important for companies. Policyholders and shareholders consider profit essentially in decision making process of supplying funds into insurance firms. “One of the objectives of management of insurance companies is to attain profit as an underlying requirement for conducting any insurance business” (Lee, 2014, p. 682).
In spite of being widely used, evaluating a company’s financial performance through profit has some disadvantages. According to accounting principles, the risks undertaken is not considered when generating profit as profit is accrual based instead of cash based (Sayılgan, 2010). In other words, it does not reflect the risks of generating profit. But, understanding the risks is very significant since it tells us whether the company will be able to continue to create profit in the future. If the company takes high risks, making a risky investment or taking too much loan etc., then its probability of bankruptcy will increase. Additionally, profit does not reflect how much cash company has in hand. For instance, company could sell too many goods in exchange for receivables and then it may not be able to get cash in short-term or forever. Moreover, profit is not able to display long-term outlook of a company. As the risks undertaken and value creation are not understood by evaluating only profit, it is not possible to interpret future of company.
Despite some disadvantages, profit from the accounting perspective is very important for firms. A firm generating loss in consecutive periods is hard to survive unless it is financially strong. A company has to generate profit in order to distribute dividend to shareholders. Profit is also easy to calculate from income statement of a company. Income statement is mandatory to prepare in almost all countries and it is published.
16
For those reasons stated above, other measures based not only on accounting data such as Embedded Value Approach are also used to grasp profitability in addition to the measures based solely on accounting data such as return on equity and operating margin.
Finally, researchers, administrators and regulatory authorities have had remarkable interest on the factors that determine firm profitability because of its importance (Nyairo, 2015).
3.2. Profitability Measures
In this part of the thesis the most common measures of profitability used in the literature will be studied.
3.2.1. Return on Equity
Return on Equity (ROE) is one of the widely used profitability ratios in international standards. It is calculated as dividing net income by common shareholder’s equity. Net income used in the formula is the income after preferred stock dividends have been paid.
Figure 1. ROE formula
It displays how much profit has been generated by one unit of equity and it is indicator of how efficiently equity is used. The greater the ROE, the better the company performs. It is utilized by comparing other companies’ ratios or industry average. It is easy to calculate and it enables investors to measure performance across different industries. For example, an investor can compare an insurance company’s ROE with returns from stocks, bonds or other financial instruments before deciding to invest his funds.
ROE of non-life insurance companies operating in the nine most developed markets in the last decade, accounting for 73% of world non-life insurance premiums and being home to most of the globally operating insurers, was relatively low at 6.5%. The global financial crisis and extraordinary high catastrophe losses in 2011 and 2017 happened in
17
this time span. Over the long run, insurers have performed similarly with firms in other sectors. ROE of global non-life insurance sector dropped to 6% from 7% in 2016 because of natural catastrophe losses in the US, soft underwriting conditions and low investment yields (Swiss Re, 2018a).
3.2.2. Return on Assets
Return on Assets (ROA) is another widely used performance ratio. It is calculated by dividing net income by total assets.
Figure 2. ROA formula
It shows how much profit has been generated by one unit of asset and it is indicator of how efficiently assets are used. The greater the ROA, the better the company performs. It is utilized by comparing other companies’ ratios or industry average and it is easy to calculate.
3.2.3. Technical Profitability Ratio
Technical Profitability is the profitability of an insurance company generated from its core insurance activities. It is calculated by dividing underwriting profit by gross written premiums.
Figure 3. Technical profitability ratio formula
Underwriting profit which is also called technical result or technical profit is calculated as subtracting claims and expenses related to core business from net insurance premiums acquired from insurance contracts. Net insurance premiums are calculated by subtracting premiums transferred to reinsurance companies from gross written premiums.
18
Technical profitability ratio is an accurate measure of efficiency of an insurer's underwriting activities. Underwriting income of an insurer may fluctuate within periods with natural and other disasters such as earthquakes, floods and fires leading to huge underwriting losses.
3.2.4. Profit Margin
Profit margin is the profit a company generates per unit of premiums. It is calculated as operating profit/loss divided by net written premiums.
Figure 4. Profit margin formula
It is commonly used in insurance industry and allows an easy comparison across products (Swiss Re, 2012).
3.2.5. Return on Invested Capital
ROIC is used to assess how efficient a company allocates the capital under its control to profitable investments. It shows us how well the company uses its funds to generate profit. It is calculated by dividing net income minus dividends to total capital. Total capital can be found by subtracting non-operating assets from the sum of book value of debt and equity.
Figure 5. ROIC formula
3.2.6. Embedded Value Approach
In order to give more detailed information regarding insurance value creation and profitability, various embedded value approaches have been developed supplementing
19
traditional accounting-based financial reporting. Long-term outlook of a company is reflected by Embedded Value (EV) concepts and it considers the relative riskiness of different business lines. EV aims to calculate net cash flows generated by the business written over the lifetime of contracts in-force (Swiss Re, 2012). “The idea of EV calculation originates from valuation literature and can be traced back to Anderson (1959)” (Diers et al., 2012, p. 4).
“The EV is the valuation of a company’s current in-force value without taking into account its capacity to generate new business” (Tremblay, 2006, p. 4). Value of in-force business is defined as future profits related to the business already sold (Willis Towers Watson, 2016). In other words, “The value of in-force business is the present value of the amounts generated by the in-force that will be distributable to the shareholders in the future” (Tremblay, 2006, p.4-5). Briefly, EV displays value of a company and future cash flows from existing insurance contracts are estimated to calculate EV without considering its capacity to generate new business.
“The change in EV shows whether value has been created or destroyed during the period” (Willis Towers Watson, 2016, p. 15). Assumptions have to be made such as future interest rates, mortality to calculate EV.
Being calculated based on assumptions and the difficulties in calculation are disadvantages of EV. However, taking into account risk and giving a long-term outlook are its advantages.
3.3. Firm-Specific Drivers of Profitability
In this part of the thesis, firm-specific drivers of profitability will be examined. Firm-specific drivers are expected to have significant impact on profitability as profitability changes over insurers.
3.3.1. Loss Ratio
“Loss ratio, which is also expressed as the underwriting risk in the relevant literature, demonstrates the effectiveness of the underwriting activities of insurance companies” (Öner Kaya, 2015, p. 517). Loss ratio is one of the most important determinants of insurers
20
since it includes both the claims payments expected to be the biggest source of cost and the insurance premiums expected to be the biggest source of income to the insurance company. It is calculated by diving incurred claims to net premiums (earned premiums).
Figure 6. Loss ratio formula
As seen from the formula above, increase in claims raises loss ratio which is not good for insurers. There are several factors that affect level of claims.
Probability/realization of risks the insurer has undertaken is one of the biggest important reasons of fluctuations in claims. If the insurer provides coverage for high risky events then the probability of claims payments increases. Catastrophes having huge negative effects to the society such as tornadoes, hurricanes in the U.S. or floods and hails in Turkey cause sudden huge increases in claims which could make insurer financially weak. Changes in insured behavior affect probability of risks. While driving more carefully or getting driving lessons diminishes car accidents, using mobile phone increases car accidents and hence, claims.
Technology usage in insurance such as telematics, a device which is mounted on insured’s vehicle and records the driving behavior of the driver, decreases claims. Knowing that premiums will increase in the next insurance contract if he drives fast and carelessly and does not obey driving rules, the insured person tries to enhance his driving behavior. Additionally, fraud risk has decreased with the usage of telematics devices (Swiss Re, 2018a).
Conversely, increasing healthcare and car repair costs because of advances in medicine and automotive technology have been causing rises in severity of claims (Swiss Re, 2018a).
Fluctuations in insurance product sales also affect claims level. When the sales increase, claims are also expected to increase which is stemmed from the rise in risks.
21
Moral hazard, adverse selection and fraud are other factors that affect claims. “Moral hazard occurs when people with insurance use more services then they would if they did not have coverage only because they know that they are protected” (Radermacher, et al., 2006, p. 68). For example, an insured having health insurance could go to hospital for the diseases he did not care before or the diseases whose importance level is low as the expenses are compensated by insurer or a farmer having agriculture insurance may not try to increase the productivity of his crops.
“Adverse selection occurs when the risk profile of the group insured is worse than what would be expected in the general population” (Radermacher et al., 2006, p. 68). As the insurer does not have enough information about target group (adverse selection) it insures high-risk-profile people unwillingly. Therefore, insured risks in the pool get higher than expected and costs exposed endanger insurer’s future. For example, that people having HIV/AIDS and cancer whose cure costs are high conceal their sickness will generate high costs for the insurer.
Fraud is that insured people cause undeserved compensation by giving wrong information to the insurer. According to (Radermacher et al., 2006, p. 69) “health insurance is particularly prone to fraud throughout the world, whatever the clients’ income levels” and fraud evolves in several forms:
– the client, for example, obtaining treatment for persons not covered by the insurance scheme through impersonation,
– the health service provider, who might, for example, submit false claims or inflate genuine claims by claiming for more expensive drugs than those actually issued,
– the scheme administrators, including the insurer’s own staff, who might, for example, process fake claims or process genuine claims twice, possibly operating in collusion with dishonest providers,
or any combination of the above.
In addition to claims, pricing of risks by actuaries of insurers is another factor affecting loss ratio. Insurers have to set premiums levels compatible with the probability of risks.
Loss ratio in the last 20 years has been volatile because of economic factors, catastrophic losses, claims trends and to a certain extent line-specific cycles. Global catastrophe claims reached to the highest level for a year because of the hurricanes in the North Atlantic and wildfire, thunderstorm and severe precipitation events across different regions (Swiss Re, 2018a).
22
3.3.2. Expense Ratio
Expense ratio gives us what percentage of premium is used by insurance companies for paying all the costs of acquiring, writing and servicing insurance and reinsurance. The expense ratio shows an insurance company's efficiency without considering its claims on its policies and investment gains or losses. It is calculated by dividing the expenses related to acquiring, underwriting and servicing premiums to the net premiums earned by the insurer. Advertising, loss adjustment expenses, employee wages, commissions for the sales force, taxes on the insurer’s earning are expenses which can be included in expense ratio.
Figure 7. Expense ratio formula
Expense ratio is a very strong indicator of operational efficiency. Insurers can reduce expense ratio, hence increase operational efficiency, by making adjustments in their business mix, distribution channels. For example, merging with or acquiring a company or using online channels for marketing standard products such as traffic insurance to eliminate intermediary commission could reduce expenses.
(Swiss Re, 2018a, p. 9) states that;
Changing traditional distribution networks (call centres and branch distribution networks) with online, mobile or digital platforms for personal lines (car, home, travel insurance products) has reduced costs. Compared to the loss ratio, the expense ratio has been relatively stable in the last 20 years, typically ranging from 25% to 35% of premiums.
3.3.3. Premium Growth Rate
Premiums are the most important source of income for insurers. Premiums are collected from clients after an insurance contract is made and invested in different kinds of instruments such as treasury and corporate bonds, stock markets, savings account. Premiums generate income for insurers till claims payments are made.
23
Figure 8. Premium growth rate formula
Premium growth depends on a lot of factors related to the society, economic conditions and company policies. Most important ones can be stated as:
Insurance awareness,
Trust of people in insurers because of former negative experiences,
The belief of some Islamic people who think that conventional insurance is haram because it contains uncertainty and interest,
Lack of Takaful insurers and products (insurance based on Islamic rules),
Income level and economic conditions,
Regulation,
Lack of competent man power employed in the sector,
Insurer willingness.
Premiums levels have to be determined in accordance with the risk levels of policyholders. Aggressive premium production which is not compatible with the risks taken could cause high loss payments, depletion of equity capital and thus financial distress costs.
Premium growth is expected to increase profitability as long as related costs are lower than generated income. For this reason, premium growth on profitability is unpredictable.
3.3.4. Liquidity
There are 2 must have conditions for a company to continue its economic activities (Sayılgan, 2010, p. 133):
To have enough cash flow level for repayment of the capital and interest of due liabilities. If the company does not have enough cash flow, it goes bankrupt.
To meet the benefit expectations of shareholders who put capital to the company. This condition is more flexible as shareholders could be more patient if
24
the future outlook is good. If the company cannot generate enough profit for shareholders and its possibility to generate in future is low, the company goes towards clearance.
For those reasons stated above, companies must hold enough cash or assets which could be quickly converted to cash without losing its value. Liquidity signifies a company’s power to repay its short-term liabilities.
Current Ratio is one of the measures of liquidity. It is calculated as dividing current assets to current liabilities. It shows the ability of a company to pay its liabilities that will be paid in one year with its cash that will be obtained in one year. Current ratio should be between 1.5 and 2. Current assets are used as representative of liquidity since liquid assets are stated in this section of balance sheet.
Figure 9. Current ratio formula
While high liquidity gives power to pay short-term liabilities and hence financial strength, it may also cause waste of sources and affect company’s profitability negatively. In normal economic circumstances, fixed assets generate more investment returns than current assets do (Sayılgan, 2010). Having high liquidity means surrendering more profitable investments. If a company misses more profitable investment opportunity, then it will generate less cash in the future meaning that its financial strength will be affected negatively. The balance should be established considering financial strength and profit opportunities.
3.3.5. Leverage Ratio
Capital structure is one of the most interesting issues in the financial literature. There are lots of valuable theories trying to explain which type of capital is the best for a company reducing its Weighted Average Cost of Capital (WACC). Capital structure refers to the combination of sources used in financing of a company.
25
Explanation of capital structure started with Irrelevance Theory introduced by Professors Franco Modigliani and Merton Miller (MM) who gained Nobel Price. “Modern Capital Structure Theory began in 1958, when MM published what has been called the most influential finance article ever written” (Brigham & Ehrhardt, 2011, p. 610). Based on some strong assumptions, MM concluded that when there is no tax, a firm’s value is not affected by its capital structure. Later MM relaxed the assumption of no tax in their follow-up paper published in 1963. The paper concluded that because of tax-shield effect of debt, WACC decreases as debt is added which means the optimal capital structure is 100% debt.
Pecking Order Theory states that because of the presence of floatation costs and asymmetric information a firm should raise capital internally by reinvesting its net income and selling its short-term marketable securities (Brigham & Ehrhardt, 2011). Then, it should sell proper assets, use debt and preferred stock. Common stock should be the last option.
Trade-off Theory states that the value of a levered firm is equal to the value of an unlevered firm plus the value of any side effects, which include the tax shield and the expected costs due to financial distress (Brigham & Ehrhardt, 2011). According to this theory there is a trade-off between tax advantage and increasing probability of financial hardship resulting from debt repayments.
Traditional Approach briefly states that company has only one optimal capital structure and the company can reduce its WACC by using debt to some degree. After a certain debt level, the liquidity risk of company will be too high and WACC will rise.
Capital structure of insurance companies differs from that of non-financial firms. While non-financial firms are financed by lenders and stockholders insurance companies are financed by lenders, stockholders and policyholders (customers). Insurance companies assign technical provisions for probability of paying claims resulting from policies sold. Liabilities of insurance companies mostly consist of technical provisions (82% for non-life insurers, 73% for life insurers in 2018 in Turkey). Non-financial firms are certain to repay interest and principle in exchange for using debt and the time of repayment is fixed. However, insurance companies pay back policyholders in the form of claims only if the risks covered in the policies happen and the time of payment is uncertain. Equity capital
26
plays buffer role in the event that net claims incurred exceed premiums plus investment return.
Thus, leverage ratio gives us the capital structure and financial soundness of a company. It is calculated by dividing liabilities to capital. It shows us what percentage of capital is acquired by liabilities. Total liabilities consist of short term liabilities and long term liabilities. Total capital consists of total liabilities and equity.
Figure 10. Leverage ratio formula
3.3.6. Size
There are different indicators measuring size of a company. Some of these indicators are number of employees, amount of its sales for a period or amount of its assets at a point in time. All of these are used as indicators of size in empirical research depending upon the researcher. Major insurance companies are expected to respond quickly to changes in the market conditions compared with small companies, diversify the risks they accept in an effective way, employ more qualified labor power in an easier way, and in particular, benefit from the economies of scale concerning labor cost (Shiu, 2004).
3.3.7. Age
Age of the company is expected to affect profitability in both positive and negative ways. Experience and corporate reputation increase with an increase in age of a company. Moreover, firms develop their capital and brand names as time passes (Kakani et al. 2001).
3.3.8. Other Firm-Specific Drivers
Other drivers of profitability which have been often taken into account in literature are solvency, premium retention ratio and diversification. It is possible to address and test other factors but we will limit them with those above.
27
As stated in the first chapter, insurance is a risk transfer mechanism. Insurers get premiums in return for the risks they undertake. However, if there is an unbalance between the premiums acquired and the risks undertaken insurers could not be able to meet their obligations. For this reason, regulators inspect insurance companies’ ability to meet their obligations regularly.
“The solvency of an insurance firm refers to its ability to pay claims” (Charumathi, 2013, p. 3). Greater solvency ratios are indicators of financial strength and greater ability to meet responsibilities. Regulators determine minimum solvency ratios for insurers to supervise financial soundness of insurers. Insurers have to keep higher equity capital in order to increase their solvency ratio.
Prospective policyholders are more interested in financially sound insurance companies (Reshid, 2015). Greater solvency enables good reputation for insurers and increases their sales which could raise profitability. However, greater solvency may be costly for insurers as holding sources in reserve funds could prevent productive use of sources.
As stated in the second chapter, insurers transfer some of their premiums to reinsurers for some reasons such as to reduce their exposure to potentially costly events or the amount of capital they are required to maintain in reserves, to stabilize their earnings and to increase underwriting capacities.
Premium retention ratio shows the amount of premiums insurer retains. It is calculated as dividing net written premium to gross written premiums.
Figure 11. Premium retention ratio formula
While transferring risks to a reinsurer has advantages such as reducing risk and earning commission, it prevents insurer’s potential to earn profit from its core business and to grow which would lead to numerous advantages to a company. “For this reason, insurance companies are required to determine an appropriate retention level and establish
28
a balance between decreasing insolvency risk and reducing potential profitability” (Shiu, 2004, p. 1101&1084).
Insurers should consider their underwriting risk and equity while determining this ratio. First, the level of underwriting risk should be assessed and then determine if there is enough equity for that risk level. “Insurers can keep premium retention ratio high if their equity is enough and there is no problem in terms of external sources” (Genç, 2002, p. 16).
3.4. Macroeconomic Drivers of Profitability
Macroeconomic indicators are expected to have impact on insurer profitability since they affect income of insurers. In this part of the thesis, they will be examined in detail.
3.4.1. GDP Growth
During high GDP growth periods, unemployment is expected to decrease and stock market is expected to perform well. In this way, demand for insurance products and stock market return for insurers rise. Therefore, GDP growth is expected to affect profitability positively.
(Christophersen & Jakubik, 2014) found that there is significant relationship between insurance companies’ premiums and economic growth. (Nissim, 2010) also asserts that the overall economic activity affects insurers’ growth, because available income affects the demand for insurance products. (Beck & Webb, 2003) stated that increasing income might be the reason why people assign some of income to retirement and buy insurance products related to investment.
3.4.2. Interest Rate
When interest rates increase, investment income of insurance companies also increases as they heavily invest in interest-bearing financial instruments. Conversely, the theoretical insurance pricing models promote the expectation of a negative relationship between risk-free interest rate and underwriting margin (Haley, 2007). Insurance pricing theory suggests that interest rates and insurance prices have a (theoretically) negative relationship. When interest rates are high, insurers reduce prices to collect more premiums