AN INVESTIGATION ON RELATIONSHIP BETWEEN LACTATION MILK YIELD,
SOMATIC CELL COUNT AND UDDER TRAITS IN FIRST LACTATION TURKISH
SAANEN GOAT USING DIFFERENT STATISTICAL TECHNIQUES
E. Eyduran, I. Yilmaz, A. Kaygisiz*and Z. M. Aktas**Igdir University, Faculty of Agriculture, Department of Animal Science,76000, Iğdır, Turkey.
*Kahramanmaras Sütcü Imam University, Faculty of Agriculture, Department of Animal Science ;**Graduate School of
Natural and Applied Sciences, Kahramanmaras, Turkey. Corresponding author mail: [email protected]
ABSTRACT
This study aimed to determine the relationship between lactation milk yield, (LMY), somatic cell count (SCC), and udder traits using some statistical techniques, viz. multiple linear regression, stepwise regression, use of factor analysis in multiple regression, and regression tree. Forty six Turkish Saanen Goat were used in the present investigations . These goats were milked with milking machine twice a day. The traits recorded were: daily milk yield (DMY), udder upper height (UUH), udder width (UW), udder length (UL), udder diameter (UD), teat angle (TA), udder volume (UV), somatic cell count (SCC), lactation length (LL), and lactation milk yield (LMY), Respectively. In the multiple linear regression analysis, significant effects of and LT (P<0.01) and TA (P<0.01) on LMY trait were observed. According to result of Stepwise Regression Analysis model (SRAM); TA, LL and UD had positively significant effect on the LMY trait without multicollinearity problem. Kaiser-Meyer-Olkin (KMO=0.6) and, Bartlett’s test of spherity (P<0.01) also confirmed that factor analysis was applicable for the data. Present results from using factor analysis scores with multiple regression analysis (FASMLRA) reflected that five factors, explained 87.7 % of variation and only UV, TA, UL, UD and LL could significantly increase LMY (P<0.01) for factors 2-4. FASMLRA with the lowest VIF values gave more advantageous results. Regression Tree (RT) Method illustrated that, the goats with TA > 500among all the goats (Node 2) had the highest LMY (297.357 lt) or Node 4 as a group of the goats with LL > 191 days among the goats with TA < 500provided higher LMY average except for Node 2. If there is a verification at genetic level, the relationship between lactation milk yield (LMY), somatic cell count (SCC), and udder traits might contribute to further goat breeding to increase milk yield in the future.
Key words: Factor Analysis Scores, Milk yield, Udder trait, Stepwise Regression, Regression Tree, Saanen Goat.
INTRODUCTION
In dairy industry, milk production provides a great contribution to countries’ economy and people nourishment throughout the world. In concern with milk production, milk yield as in other well-recognized quantitative traits in animal science is influenced by genetic and non-genetic factors.. Mastitis is a significant disease leading to the most economic losses in dairy industry. (Yalcin, 2000; Yalcin et al., 2000; Uzmay et al., 2003). To prevent mastitis, dairy breeders should take some precautions, viz. routine heath care, hygiene, and achievement of desirable genetic improvement through selection (Jouzaitiene et al., 2006).
Methods which are available for mastitis diagnosis are the strip-cup, the California Mastitis Test (CMT), Wisconsin Mastitis Test (WMT), and Somatic Cell Count (SCC). Among these mentioned tests, SCC as an indicator of udder health status (Juozaitiene et al., 2006) is the most well accepted method in diagnosis of Mastitis in a herd and SCC is influenced by many environmental factors (age, parity, season, temperature
and stress), barn conditions and milking machine and systems (Uzmay et al., 2003; Koc, 2007). These factors play a crucial role on milk yield, composition, hygiene-quality of milk, and animal’s udder health (Koc, 2007).
In dairy goat, investigation of the relationship between milk yield, SCC and udder traits enables breeders to obtain beneficial clues not only for accomplishing on the subject of selection of superior goats and but also for developing better selection strategies on milk yield per goat. In a study on Damascus Goat, Mavrogenis e al.,(1989) stated highly heritable traits of teat length (TL), diameter (TD), 90-d and total milk production, and positive-moderately high correlations among udder traits. Accordingly, Peris et al. (1999) reported significant correlations between udder traits, udder volume, body weight, milk yield, and milking traits in Murciano-Gradina dairy goat. Amao et.al.(2003) also reported in Red Skoto Goat, significant correlations between udder traits UL, UW, UC, TL, TW, TC, and UV etc. Keskin et al. (2005) reported positive effects of UC and UBH on DMY in the study on the relationships between several udder traits (UBH, UD,
UC, LTC, RTC, AND TA) and DMY of Akkeci Goat, by using Path Analysis and expecially significant positive correlations of DMY with UD, UC, LTC, RTC, and TA (P<0.01). Keskin et al. (2007a) investigated the relationship between daily milk yield (DMY) and 10 udder traits (upper height (UH), udder bottom height (UBH), udder depth (UD), udder width (UW), udder circumference (UC), left teat length (LTL), right teat length (RTL), left teat circumference (LTC) and right teat circumference (RTC), and teat angle (TA)) by using factor analysis scores in multiple linear regression model on Akkeci (Kilis x Saanen) crossbred goat. In a more detailed study, Cedden et al., (2008) emphasized the relationship between somatic cell count, milk yield, fat percent, and some udder traits in primiparous Saanen x Kilis Crossbred goat. In the literature, reports on the relationship among milk yield with somatic cell count and udder traits together in the goat were relatively limited. To date, there has been no published knowledge on relationship of lactation milk yield with somatic cell count and udder traits in first lactation Turkish Saanen goat by using different statistical analysis techniques. Hence, the aim of the present paper was to determine the relationship of lactation milk yield (LMY) with somatic cell count (SCC), and udder traits using various statistical analysis techniques, such as multiple linear regression, stepwise regression, jointly use of factor analysis in
multiple regression, and regression tree,
comprehensively.
MATERIALS AND METHODS
Data Collection: Data on Forty six Turkish Saanen Goats were collected from a private company in Kılılı town of central district registered to Kahramanmaras Breeding Sheep and Goat Association. These goats were milked with milking machine twice a day. The traits recorded were: udder upper height (UUH), udder width (UW), udder length (UL), udder diameter (UD), teat angle (TA), udder volume (UV), somatic cell count (SCC), lactation length (LL), daily milk yield (DMY), and lactation milk yield (LMY), all of which are quantitative (measurable) variables, respectively. Data from Aktas et al. (2012) were also used with the aim of evaluating different statistical techniques in the present study, which contained various new results.All udder measurements were recorded after morning milking at each measuring period. In addition, the udder traits at mid-lactation period were used for the present paper. As recommended before by Kaya (2005), measuring baston was used for udder traits, viz. udder lower height (ULH): udder upper height, udder width (UW) respectively. Teat angle (TA) was measured with goniometer and udder volume (UV) was measured with water immersion method on the basis of dripping water volume.
Determination of somatic cell count in milk sample: DCC (DeLaval Somatic Cell Measuring Device) was used to determine somatic cell count of the collected milk samples in Microbiology Laboratory of Agricultural Faculty of Kahramanmaras Sutcu Imam University. After dropping a few drops from milk samples into De Laval count kit, loaded cassette was put into Delaval cell counter. DCC counts somatic cells colored with DNA specific flourescent probe Propidium lodide. Amount of somatic cell count becomes numerically visible on its screen inside of one min. See Gonzalo et al. (2006) for more detailed information on the use of DCC device. Statistical Analysis
Variable Structure: In the present study, lactation milk yield (LMY) was considered as a dependent (target=response) variable. In addition, all the quantitative-independent (measurable) variables are given below: udder upper height (UUH), udder width (UW), udder length (UL), udder diameter (UD), teat angle (TA), udder volume (UV), somatic cell count (SCC), lactation length (LL), and LOGSCC, which is a logarithmic transformation of SCC trait.
Multiple Linear Regression Analysis Model: In order to predict LMY from UUH, UW, UL, UD, TA, UV, LOGSCC, and LL, prediction equation for LMY can be written as follows:
LMY= a + b1UUH + b2UW+ b3UL + b4UD+ b5TA+ b6
UV + b7LOGSCC+ b8LL + e
Where, a:intercept, b1, b2, b3 b4, b5, b6 ,b7, b8 are
regression coefficients, and e: error term.
Stepwise Regression Analysis Model: By Stepwise Regression Analysis Model, significant (independent) variables (UD, TA, and LL) among UUH, UW, UL, UD, TA, UV, LOGSCC, and LL, were included in multiple regression analysis model. Prediction equation for Stepwise Regression Analysis Model can be written as follows:
LMY= a + b1UD + b2TA+ b3LL + e
Where, a: intercept, b1 , b2 and b3 are regression
coefficients, and e: error term.:
Use of Factor Analysis Scores in MLRA: The appropriateness of factor analysis was tested with Kaiser-Meyer-Olkin (KMO) measure of sampling adequacy and Bartlett's test of sphericity (Sharma, 1996).
The basic factor analysis equation in matrix form can be written as:
Z = F +
Where Z is a px1 vector of variables, is a pxm matrix of factor loadings, F is an mx1 vector of factors and is a px1 vector of error or residual factors (Sharma, 1996). Due to the differences in the units of variables for factor analysis, the variables were standardized and eigen values were estimated by a correlation matrix of
variables. VARIMAX rotation was utilized to facilitate interpretation of factor loadings (Lik). Factor coefficients
(Cik) were used with the aim to obtain factor scores for
the selected factors in the factor analysis. Factors whose eigenvalues are greater than 1 were included in multiple regression analysis.
Score values obtained from the chosen factors were used as explanatory variables to predict LMY of the first lactation Turkish Saanen Goat. The multiple linear regression equation for fitting standardized body weight and the following factor score equation can be formulated as below:
LMY = a + b1FS1+ b2FS2+ b3FS3+ b4FS4+ b5FS5+ e
Where a, regression constant (the value of intercept is zero); b1, b2, b3 b4, and b5 are regression
coefficients of Factor Scores (FS). FS is factor score and e is the error term. The significance of regression coefficients was tested by using a t-statistic.
The efficiency of multiple regression analysis explaining total variation in LMY of the first lactation Turkish Saanen Goat was determined using determination coefficient (R2) and Root of Mean Square Error (RMSE), and Variance Inflation Factor (VIF), as an indicator of multicollinearity (Eyduran et al. 2009). For a trustworthy multiple linear regression or Stepwise Regression analysis, VIF for all the independent variables should be less than 10 (Karakus et al. 2010).
All the statistical computations except for RT analysis were performed with MINITAB (Trial Version: 15) statistical package program. (www.minitab.com). Regression tree method: As a tree based model, Regression Tree (RT) Method, a non-parametric method, assigns the most suitable cut-off values for independent variables that can significantly influence dependent variable. The purpose of RT method is to generalize prediction rules with regard to a dependent variable, with
respect to the values of independent variables (Hébert et al., 2006). Regression tree method changes continuous variables into discrete variables on the basis of proper cut-off values (Camdeviren et al., 2005; Tariq et al., 2012b). For Regression Tree Method, F test was employed for testing significance of a continuous dependent variable in the present paper (Hébert et al., 2006; Tariq et al., 2012b). RT analysis was performed using SPSS (Exhaustive CHAID) statistical package program (Analyze >Classify >Tree…in the SPSS).
RESULTS AND DISCUSSION
In the literature, this is the first study to investigate relationships of lactation milk yield (LMY) with somatic cell count (SCC), and udder traits using various statistical analysis techniques, such as multiple linear regression, stepwise regression, jointly use of factor analysis in multiple regression, and regression tree in goats, comprehensively.
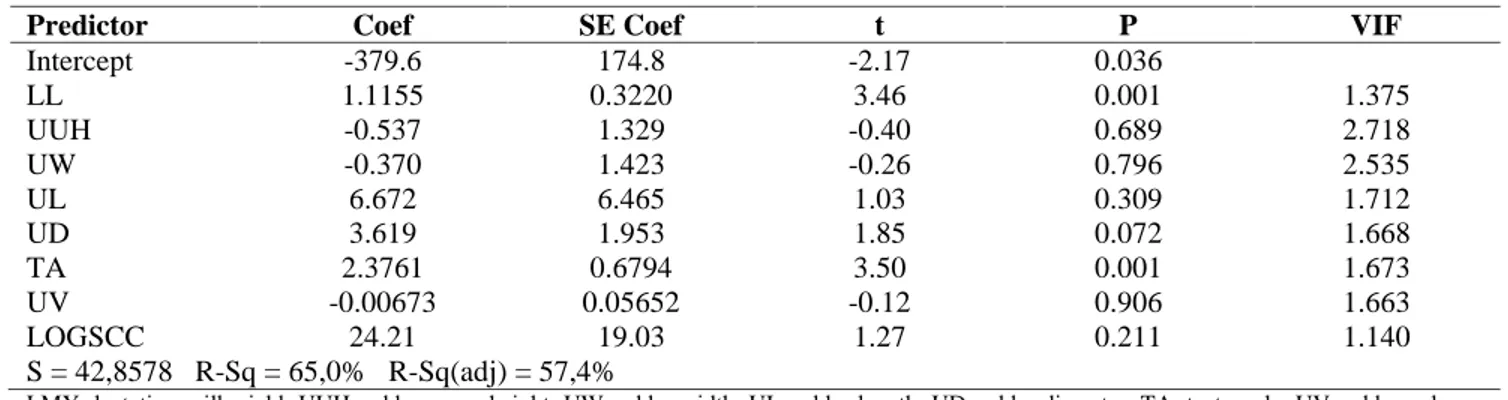
Result of MLRA, predicting lactation milk yield from the traits mentioned above are summarized in Table 1. . According to these results obtained from MLRA, proportion of the explained variation for LMY trait was exactly 65(%), meaning that 65(R2%) of total variation in the LMY trait was explained by other quantitative traits (independent variables) included in the MLRA model. Result of ANOVA table belonging to MLRA showed obviously that MLRA model (P<0.01) building for the present study were found significant and LL (P<0.01) and TA (P<0.01) in the MLRA model significantly and positively influenced LMY trait in the present study. VIF values obtained for independent variables varied from 1.140 (LOGSCC) to 2.718 (UUH), suggesting that MLRA model could be reliable without multicollinearity problem.
Table 1. Results of Multiple linear regression analysis for original variables
Predictor Coef SE Coef t P VIF
Intercept -379.6 174.8 -2.17 0.036 LL 1.1155 0.3220 3.46 0.001 1.375 UUH -0.537 1.329 -0.40 0.689 2.718 UW -0.370 1.423 -0.26 0.796 2.535 UL 6.672 6.465 1.03 0.309 1.712 UD 3.619 1.953 1.85 0.072 1.668 TA 2.3761 0.6794 3.50 0.001 1.673 UV -0.00673 0.05652 -0.12 0.906 1.663 LOGSCC 24.21 19.03 1.27 0.211 1.140 S = 42,8578 R-Sq = 65,0% R-Sq(adj) = 57,4%
LMY: lactation milk yield, UUH: udder upper height, UW: udder width, UL: udder length, UD: udder diameter, TA: teat angle, UV: udder volume, SCC: somatic cell count, LL: lactation length
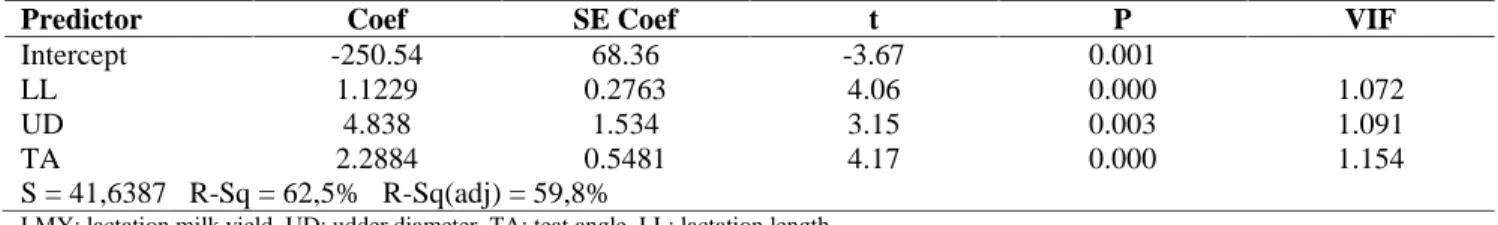
Stepwise Regression Analysis Model: The Summary of Stepwise Regression Analysis for original variables is given in Table 2. In stepwise regression analysis model
(SRAM), positively significant effects of TA, LL and UD traits on the LMY trait were determined, which illustrating that LMY would increase with increasing
these traits. For instance, when an increase of 10occurred in TA trait; LMY would increase approximately 2.29 lt. SRA model had a R2 (%) of 62.5, which was the proportion of the variation explained by these three traits,
(P<0.01). Very low VIF values for TA, LL and UD traits were 1.154, 1.072, and 1.091, respectively, with a narrow range of 1.072 to 1.154, illustrating that, no multicollinearity problem was found.
Table 2. The Summary of Stepwise Regression Analysis for original variables
Predictor Coef SE Coef t P VIF
Intercept -250.54 68.36 -3.67 0.001
LL 1.1229 0.2763 4.06 0.000 1.072
UD 4.838 1.534 3.15 0.003 1.091
TA 2.2884 0.5481 4.17 0.000 1.154
S = 41,6387 R-Sq = 62,5% R-Sq(adj) = 59,8%
LMY: lactation milk yield, UD: udder diameter, TA: teat angle, LL: lactation length
Use of Factor Analysis Scores in MLRAL In order to remove multicollinearity problem, one of the most effective approaches is to use factor analysis scores together with MLRA (FASMLRA). In the view of VIF values, present FASMLRA results with the lowest VIF values confirmed this statement compared to MLRA and SRAM, respectively. As seen from Tables 2-4, FASMLRA (S=0.638843) produced the lowest RMSE values compared with MLRA (S=42.8578) and SRAM (S=41.6387), respectively.
A Kaiser-Meyer-Olkin (KMO) of 0.60 and Bartlett’s test of spherity (chi-square: 96.56; P<0.01) confirmed the suitability of the studied data for factor analysis (Table 3).
Results of factor analysis are given in Table 3. Five factors with eigenvaluesgreater than one explained 87.7 % (7.0196/8*100) of total variation in the present data. Of the explained variation, 23.8%, 19.7%, 18.3%, 13.0% and 12.9% were explained by factors 1-5, respectively. With respect to sorted-rotated factor loading and communalities in the factor analysis, communalities had a range of 0.798 to 0.977, illustrating that very high communalities which were a desirable case were found in the study, because these high communalities mean that the extracted five factors accounted for a big proportion of variance regarding the original variables.
Factor loadings permit researchers to determine the quantitative traits which will make more contribution to the formation of the extracted factors. Factor loading is the correlation between original variables and factor scores. Thus, positively high correlation (r=0.933) between UUH and FS1 was found (P<0.01), but UW was highly negatively correlated with FS1 (r=-0.872) (P<0.01) statistically. UV and TA were strongly associated with FS2 (r=-0.922 and -0.800), respectively (P<0.01). In the similar way, positive correlation coefficients were also highly estimated for UL-FS3 (r=0.857), UD-FS3 (r=0.830), LL-FS4 (r=0.923), respectively. In addition, there was a significant correlation between LOGSCC-FS5, with r = - 0.970 (P<0.01).
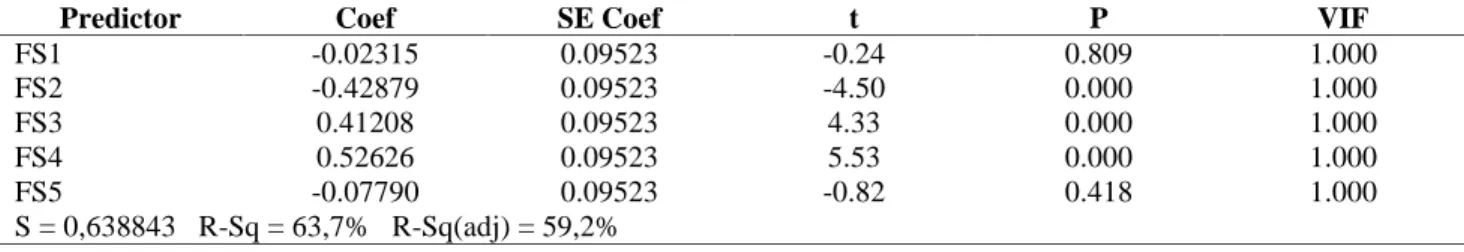
The results of MLRA model with latent uncorrected independent variables and LMY trait are presented in Table 4. Determination coefficient (63.7%) and Root of Mean Square Error (RMSE=0.638843) were estimated without exactly multicollinearity problem for jointly using factor score in MLRA model. In the MLRA model, no significant effects of FS1 and FS5 new-uncorrelated-latent variables on LMY trait were found as shown in Table . However, other new latent variables viz. FS2, FS3 and FS4 had very noteworthy impacts on LMY (P<0.01), respectively.
Mathematically, same signs of factor loading (Table 3) and regression coefficient (Coef) calculated for factor scores (Table 4) mean that LMY will increase in the Goat. LMY would be expected to insignificantly increase with decreasing UUH and increasing UW in respect of factor 1 as shown in the Tables 3-4, respectively.
LMY would be expected to increase when UV and TA, significantly contributing to factor 2 (P<0.01) , increased (Tables 3-4 ). Similarly LMY would be estimated to increase as a result of increasing UL and UD, which made a statistically significant contribution to factor 3 (P<0.01). Likewise, LMY would be expected to increase with longer LL, which was the most influential variable on factor 4 (P<0.01) (Tables 4 and 5). It was concluded that only UV, TA, UL, UD and LL could significantly increase LMY (P<0.01) in concern with factors 2, 3 and 4, which were statistically significant (P<0.05). LOGSCC positively-insignificantly affected LMY when evaluated together with fifth factor.
Keskin et al. (2005) reported positive influences of UC and UBH on DMY from Path Analysis, which can be seriously affected by multicollinearity problem, compared to the other traits, UD, LTC, RTC, AND TA and DMY of Akkeci Goat. In an earlier study by Keskin et al. (2007a), with using jointly factor scores in MLRA, four factors were extracted from 10 udder traits, and four new-latent-uncorrelated-variables were obtained with the aim of definitely removing multicollinearity problem. Among these udder traits, the positively significant
effects of LTL, RTL, LTC, UD, UW, UC, and TA on DMY were reported in spite of negatively effects of UUH and UBH on the DMY. However, UV, TA, UL, UD, LL significantly influenced LMY, very positively. The only results on significant effects of TA and UD in the present study were consistent with Keskin et al. (2007a). Considering studies on goat, very few reports including different udder traits were available on using jointly
factor analysis scores in MLRA (Keskin et.al. 2007a, b;), although there were many FASMLRA studies with various purposes on different species (Keskin et al., 2007a, b; Yakubu, 2009; Cankaya et al., 2009; Eyduran et al., 2009; Eyduran et al., 2010; Ogah et al., 2009; Yilmaz et al., 2011; Eyduran et al., 2012; Ifeanyichukwu, 2012; Tariq et al., 2012a).
Table 3. Results of Factor analysis for original variables
Sorted Rotated Factor Loadings and Communalities
Variable Factor1 Factor2 Factor3 Factor4 Factor5 Communality
UUH 0.933** -0.033 0.052 0.057 0.133 0.895 UW -0.872** 0.003 -0.010 -0.264 -0.111 0.843 UV 0.165 -0.922** 0.038 -0.093 -0.056 0.890 TA -0.154 -0.800** 0.159 0.310 0.116 0.798 UL 0.278 0.054 0.857** 0.103 0.153 0.848 UD -0.202 -0.263 0.830** 0.036 -0.138 0.819 LL 0.270 -0.107 0.104 0.923** 0.037 0.948 LOGSCC -0.183 0.031 -0.011 -0.039 -0.970** 0.977 Variance 1.9066 1.5756 1.4631 1.0427 1.0316 7.0196 % Var 0.238 0.197 0.183 0.130 0.129 0.877
Factor Score Coefficients
Variable Factor1 Factor2 Factor3 Factor4 Factor5 KMO Measure
of Sampling Adequacy: 0.60 Bartlett’s Test of Spherity: 96.56 (P<0.01) LL -0.091 0.079 -0.077 0.979 -0.071 LOGSCC 0.126 0.012 0.011 0.057 -1.005 UUH 0.565 -0.047 0.013 -0.218 -0.087 UW -0.471 -0.005 0.044 -0.057 0.105 UL 0.103 0.163 0.626 -0.082 0.088 TA -0.108 -0.053 0.580 -0.059 -0.111 UA -0.184 -0.474 -0.037 0.251 0.140 UV 0.189 -0.656 -0.088 -0.310 -0.106
**P<0.01 shows statistically significant correlation between an original variable and factor scores from the related factor
LMY: lactation milk yield, UUH: udder upper height, UW: udder width, UL: udder length, UD: udder diameter, TA: teat angle, UV: udder volume, SCC: somatic cell count, LL: lactation length
Table 4. Results of Multiple Linear Regression Analysis for new-uncorrelated latent variables
Predictor Coef SE Coef t P VIF
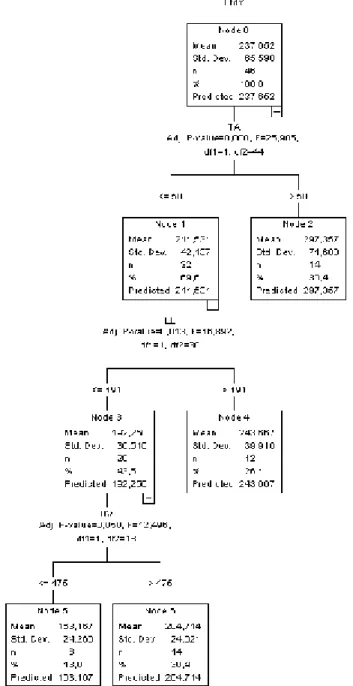
FS1 -0.02315 0.09523 -0.24 0.809 1.000 FS2 -0.42879 0.09523 -4.50 0.000 1.000 FS3 0.41208 0.09523 4.33 0.000 1.000 FS4 0.52626 0.09523 5.53 0.000 1.000 FS5 -0.07790 0.09523 -0.82 0.418 1.000 S = 0,638843 R-Sq = 63,7% R-Sq(adj) = 59,2% Regression tree (RT) Method: Regression tree (RT) diagram, drawn for finding out statistically significant traits influencing LMY is depicted in Fig 1. RT diagram reflected that merely TA, LL, and UV traits were statistically significant. . Considering significance ranking of these three traits, it was concluded that the statistically predominant trait on LMY was TA (P <0.01), followed by LL and then UV, (P<0.05) respectively.
Average LMY for Node 0, root node, a group of all the goats at the top of RT, was found as 237.652 lt (SD=65.590). Node 0 was divided into two new child nodes, Nodes 1 and 2, with respect to TA respectively. Average LMY for Node 1, which was a group of the goats with TA < 500among all the goats provided for the present study, was determined to be 211.531 lt (SD=42.137). As a group of the goats with TA > 500 within all the goats, Node 2 yielded the highest LMY
average of 297.357 lt (SD=71.688), which was compared with other Nodes in regression tree diagram. This means that the goats with TA > 500could have higher LMY.
Fig 1. Regression Tree Diagram
LMY: lactation milk yield, UUH: udder upper height, UW: udder width, UL: udder length, UD: udder diameter, TA: teat angle, UV: udder volume, SCC: somatic cell count, LL: lactation length LMY of the goats with TA < 500(Node 1) was affected by LL and Node 1 was rebranched into the new nodes of Nodes 3 and 4 on
the basis of LL, respectively. Node 3, a group of the goats with LL < 191 days among the goats of TA < 500, had an average LMY of 192.250 lt (SD=30.516). Node 4, defined as a group of the goats with LL > 191 days among the goats with TA < 500, produced 243.667 lt LMY (SD=39.910). Compared these two Nodes, among the goats with TA < 500, the LMY average from the goats with LL > 191 days was higher than the average from the goats < 191 days.
UV significantly influenced LMY of Node 3, a group of the goats with LL < 191 days and TA < 500 (P<0.05). Node 3 was seperated once more with respect to UV trait into the new child nodes, Nodes 5 and 6, respectively. Node 5 was defined as a group of the goats with UV < 475 ml among the goats with LL < 191 days and TA < 500 and its LMY average was estimated as 163.167 lt (SD=24.260). Node 6, which was a group of the goats with UV > 475 ml among the goats with LL < 191 days and TA < 500, had 204.714 lt LMY (SD=24.021).
In conclusion, Regression Tree Method illustrated that, the goats with TA > 500 among all the goats (Node 2) with 297.357 lt had the highest LMY in comparison with other Nodes or Node 4 as a group of the goats with LL > 191 days among the goats with TA < 500 gave higher LMY average.
In animal science, new RT results from the study were different from those obtained by some authors, working statistical modeling on different species (Eyduran et al., 2008; Mendes and Akkartal, 2009; Topal et al., 2010). These results were nonissuable with each other.
In conclusion, results of the present study and earlier studies could not be discussed due to use of different breeds, traits, sample size, and especially various statistical analysis techniques.
Acknowledgements: We would like to express our thanks to Didem EREL, Lecturer for her valuable contributions on improving english language of the paper, and Prof. Khalid JAVED for constructive comments.
REFERENCES
Aktas, Z.M., A. Kaygisiz, and S. Bas (2012). The relationships between Turkish Saanen goats milk yield traits, some udder measurements and SCC at Kahramanmaras Breeders Conditions. KSU J. Nat.Sci. 15(4): 7-17.
Amao, O.A., O.A. Osinowa, C.F.I. Onwuka, S.S. Abiola, M.A. Dipeolu, and C.A.M., Lakpini (2003). Evaluation udder of traits as influenced by body weight and reproductive status of red sokoto goats ın a Guınea savannah environment. Niger Agric. J. 34: 131-137.
Camdeviren, H., M. Mendes,M.M. Ozkan, F. Toros, T. Sasmaz, and S. Oner (2005). Determination of depression risk factors in children and adolescents by regression tree methodology. Acta Med. Okayama. 59: 19-26.
Cankaya, S., A. Altop, E. Kul, and G. Erener(2009). Body weight estimation in Karayaka lambs by using factor analysis scores. Anadolu J. Agric.Sci. 24: 98–102
Cedden, F., S.O.Kaya, and I. Daskıran (2008). Somatic cell, udder and milk yield in goat. Revue Med. Vet. 159:237-242.
Cedden, F., A. Kor,and S. Keskin(2002). Somatic cell counts in goat milk during late lactation period and its relationship with milk yield, age and some udder measurements. YYU. J. Fac. Agric. Sci. 12: 63-67.
Eyduran, E., K. Karakus, S. Keskin, and F. Cengiz(2008). Determination of factors influencing birth weight using regression tree (RT) method. J. Applied Anim. Res. 34: 109-112.
Eyduran, E., K. Karakus, S. Karakus, and F. Cengiz (2009). Usage of factor scores for determining relationships among body weight and body measurements. Bulgarian J. Agric. Sci. 15: 374– 378.
Eyduran, E., M. Topal, and A.Y. Sonmez, (2010). Use of factor scores in multiple regression analysis for estimation of body weight by several body measurements in brown trouts (Salmo trutta fario). Int. J.Agric. Biol. 12: 611–615
Eyduran, E., M. Topal, A.Y. Sonmez, and S.
Keskin(2012). Carcass weight estimation from some morphological traits of Capoeta capoeta capoeta (Guldenstädt, 1772) using factor scores in multiple regression analysis. Pakistan J. Stat. 28: 159–165
Gonzalo, C., B. Linage, J.A. Carriedo, F. de la. Fuente, and F. San Primitivo (2006). Evaluation of the overall accuracy of the deLaval cell counter for somatic cell counts in Ovine milk. J. Dairy Sci. 89:4613-4619.
Hebert, M., D.C. Vezina, I. Daigneault, N. Parent, and C. Tremblay (2006). Factors linked to outcomes in sexually abused girls: A regression tree analysis. Comp. Psychiatry. 47: 443-455.
Ifeanyichukwu, U. (2012). Use of factor scores for determining the relationship between body measurements and semen traits of cocks. Open J. Anim. Sci. 2: 41-44.
Juozaitiene, V., A. Juozaitisand R. Micikeviciene(2006). Relationship between somatic cell count and milk production or morphological traits of udder in Black-and-White cows. Turk J. Vet. Anim. Sci. 30: 47-51.
Kaya, S.O. (2005). Determination of somatic cells count, relationship with some yield and udder traits In the Akkeci goats. Ankara Univ. Msc Thesis, Ankara-Turkey.
Keskin, S., A. Korand S. Karaca (2007a). Use of factor analysis scores in multiple linear regression model for determining relationships between milk yield and some udder traits in Goats. J. Appl. Anim. Res. 31: 185-188.
Keskin, S., I. Daskiran, and A. Kor (2007b). Factor analysis scores in a multiple linear regression model for the prediction of carcass weight in Akkeci kids. J. Appl. Anim. Res. 31:201-204. Keskin, S., A. Kor,S. Karaca, and H. Mirtagioglu(2005).
A study of relationships between milk yield and some udder traits by using of path analysis in Akkeci goats. J.Anim. Vet. Adv. 4: 547-550. Koc, A. (2007). Daily milk yield, non-fat dry matter
content and somatic cell count of Holstein
Friesian and Brown-Swiss cows. Acta
Veterinaria (Beograd). 57: 523-535.
Mavrogenis, A.P., C. Papachristoforou,P. Lysandrides, and A. Roushias(1989). Environmental and genetic effects of udder characteristics and milk production in Damascus goats. Small Ruminant Res.. 2: 333-343.
Mendes, M. and E. Akkartal (2009). Regression tree analysis for predicting slaughter weight in broilers. Italian J. Anim. Sci. 8: 615-624. Ogah, DM, A.A. Alaga, M.O. Momoh(2009). Use of
factor analysis scores in multiple regression model for estimation of body weight from somebody measurement in Muscovy duck. Int. J. Poult. Sci. 8: 1107-1111.
Peris, S., G. Caja, and X. Such, (1999). Relationship between udder and milking traits in Murciano-Granadina goats. Small Ruminant Res. 33: 171-179.
Sharma, S. (1996). Applied multivariate techniques. John Wiley and Sons, Inc., New York. 493 p. Tariq, M.M., E. Eyduran, M.A. Bajwa,A. Waheed, F.
Iqbal, and Y. Javed (2012a). Prediction of body weight from testicular and morphological characteristics in indigenous Mengali sheep of Pakistan: using factor analysis scores in multiple linear regression analysis. Int. J. Agric. Biol., 14: 590–594.
Tariq, M.M., M. Rafeeq, M.A. Bajwa, M.A. Awan, F. Abbas, A. Waheed, F.A. Bukhari, and P. Akhtar (2012b). Prediction of body weight from body measurements using regression tree (RT) method for indigenous sheep breeds in Balochistan, Pakistan. The J. Anim. Plant Sci.,22: 20-24.
Topal, M., V. Aksakal, B. Bayram, and M. Yaganoglu (2010). An analysis of the factor affecting birth
weight and actual milk yield in Swedish red cattle using regression tree analysis. The J. Anim & Plant Sci.20: 63-69.
Uzmay, C, I. Kaya, Y. Akbas, and A. Kaya (2003). Effects of udder and teat morphology, parity and lactation stage on subclinical mastitis in Holstein cows. Turk J. Vet. Anim. Sci. 27:695-701. Yakubu, A, (2009). Fixing collinearity instability in the
estimation of body weight from morpho-biometrical traits of West African dwarf goats. Trakia J. Sci., 7, 61-66
Yalcın, C., Y. Cevger, K. Turkyılmaz, and G. Uysal (2000). Estimation of milk yield losses from subclinical mastitis in dairy cows. Turk J. Vet. Anim. Sci. 24: 599-604.Yalcın, C. (2000). Cost of mastitis in Scottish dairy herds with low and high subclinical mastitis problems. Turk J. Vet. Anim. Sci. 24: 465-472.
Yilmaz, I., E. Eyduran, A. Kaygisiz, and K. Javed (2011). Estimates of genetic parameters for lactation shape parameters with multivariate statistical technique in Brown Swiss cattle. Int. J. Agric. Biol. 13: 174–178.