published as:
Observation of the isospin-violating decay
J/ψ→ϕπ^{0}f_{0}(980)
M. Ablikim et al. (BESIII Collaboration)
Phys. Rev. D 92, 012007 — Published 17 July 2015
DOI:
10.1103/PhysRevD.92.012007
M. Ablikim1, M. N. Achasov9,a, X. C. Ai1, O. Albayrak5, M. Albrecht4, D. J. Ambrose44, A. Amoroso48A,48C, F. F. An1,
Q. An45
, J. Z. Bai1
, R. Baldini Ferroli20A, Y. Ban31
, D. W. Bennett19
, J. V. Bennett5
, M. Bertani20A, D. Bettoni21A,
J. M. Bian43
, F. Bianchi48A,48C, E. Boger23,h, O. Bondarenko25
, I. Boyko23
, R. A. Briere5
, H. Cai50
, X. Cai1
, O. Cakir40A,b,
A. Calcaterra20A, G. F. Cao1
, S. A. Cetin40B, J. F. Chang1 , G. Chelkov23,c, G. Chen1 , H. S. Chen1 , H. Y. Chen2 , J. C. Chen1 , M. L. Chen1 , S. J. Chen29 , X. Chen1 , X. R. Chen26 , Y. B. Chen1 , H. P. Cheng17 , X. K. Chu31 , G. Cibinetto21A, D. Cronin-Hennessy43 , H. L. Dai1 , J. P. Dai34 , A. Dbeyssi14 , D. Dedovich23 , Z. Y. Deng1 , A. Denig22 , I. Denysenko23 ,
M. Destefanis48A,48C, F. De Mori48A,48C, Y. Ding27
, C. Dong30 , J. Dong1 , L. Y. Dong1 , M. Y. Dong1 , S. X. Du52 ,
P. F. Duan1, J. Z. Fan39, J. Fang1, S. S. Fang1, X. Fang45, Y. Fang1, L. Fava48B,48C, F. Feldbauer22, G. Felici20A,
C. Q. Feng45
, E. Fioravanti21A, M. Fritsch14,22, C. D. Fu1
, Q. Gao1 , X. Y. Gao2 , Y. Gao39 , Z. Gao45 , I. Garzia21A, C. Geng45 , K. Goetzen10 , W. X. Gong1 , W. Gradl22 , M. Greco48A,48C, M. H. Gu1 , Y. T. Gu12 , Y. H. Guan1 , A. Q. Guo1 ,
L. B. Guo28, Y. Guo1, Y. P. Guo22, Z. Haddadi25, A. Hafner22, S. Han50, Y. L. Han1, X. Q. Hao15, F. A. Harris42, K. L. He1,
Z. Y. He30 , T. Held4 , Y. K. Heng1 , Z. L. Hou1 , C. Hu28 , H. M. Hu1 , J. F. Hu48A,48C, T. Hu1 , Y. Hu1 , G. M. Huang6 , G. S. Huang45 , H. P. Huang50 , J. S. Huang15 , X. T. Huang33 , Y. Huang29 , T. Hussain47 , Q. Ji1 , Q. P. Ji30 , X. B. Ji1 , X. L. Ji1 , L. L. Jiang1 , L. W. Jiang50 , X. S. Jiang1 , J. B. Jiao33 , Z. Jiao17 , D. P. Jin1 , S. Jin1 , T. Johansson49 , A. Julin43 , N. Kalantar-Nayestanaki25 , X. L. Kang1 , X. S. Kang30 , M. Kavatsyuk25 , B. C. Ke5 , R. Kliemt14 , B. Kloss22 , O. B. Kolcu40B,d, B. Kopf4 , M. Kornicer42 , W. K¨uhn24 , A. Kupsc49 , W. Lai1 , J. S. Lange24 , M. Lara19 , P. Larin14 , C. Leng48C, C. H. Li1 , Cheng Li45 , D. M. Li52 , F. Li1 , G. Li1 , H. B. Li1 , J. C. Li1 , Jin Li32 , K. Li13 , K. Li33 , Lei Li3 , P. R. Li41, T. Li33, W. D. Li1, W. G. Li1, X. L. Li33, X. M. Li12, X. N. Li1, X. Q. Li30, Z. B. Li38, H. Liang45, Y. F. Liang36, Y. T. Liang24 , G. R. Liao11 , D. X. Lin14 , B. J. Liu1 , C. X. Liu1 , F. H. Liu35 , Fang Liu1 , Feng Liu6 , H. B. Liu12 , H. H. Liu16 , H. H. Liu1 , H. M. Liu1 , J. Liu1 , J. P. Liu50 , J. Y. Liu1 , K. Liu39 , K. Y. Liu27 , L. D. Liu31 , P. L. Liu1 , Q. Liu41 , S. B. Liu45 ,
X. Liu26, X. X. Liu41, Y. B. Liu30, Z. A. Liu1, Zhiqiang Liu1, Zhiqing Liu22, H. Loehner25, X. C. Lou1,e, H. J. Lu17,
J. G. Lu1 , R. Q. Lu18 , Y. Lu1 , Y. P. Lu1 , C. L. Luo28 , M. X. Luo51 , T. Luo42 , X. L. Luo1 , M. Lv1 , X. R. Lyu41 , F. C. Ma27 , H. L. Ma1 , L. L. Ma33 , Q. M. Ma1 , S. Ma1 , T. Ma1 , X. N. Ma30 , X. Y. Ma1 , F. E. Maas14 , M. Maggiora48A,48C,
Q. A. Malik47, Y. J. Mao31, Z. P. Mao1, S. Marcello48A,48C, J. G. Messchendorp25, J. Min1, T. J. Min1, R. E. Mitchell19,
X. H. Mo1
, Y. J. Mo6
, C. Morales Morales14
, K. Moriya19
, N. Yu. Muchnoi9,a, H. Muramatsu43
, Y. Nefedov23
, F. Nerling14
,
I. B. Nikolaev9,a, Z. Ning1
, S. Nisar8
, S. L. Niu1
, X. Y. Niu1
, S. L. Olsen32
, Q. Ouyang1
, S. Pacetti20B, P. Patteri20A,
M. Pelizaeus4, H. P. Peng45, K. Peters10, J. Pettersson49, J. L. Ping28, R. G. Ping1, R. Poling43, Y. N. Pu18, M. Qi29,
S. Qian1 , C. F. Qiao41 , L. Q. Qin33 , N. Qin50 , X. S. Qin1 , Y. Qin31 , Z. H. Qin1 , J. F. Qiu1 , K. H. Rashid47 , C. F. Redmer22 , H. L. Ren18 , M. Ripka22 , G. Rong1 , Ch. Rosner14 , X. D. Ruan12
, V. Santoro21A, A. Sarantsev23,f, M. Savri´e21B,
K. Schoenning49, S. Schumann22, W. Shan31, M. Shao45, C. P. Shen2, P. X. Shen30, X. Y. Shen1, H. Y. Sheng1, W. M. Song1,
X. Y. Song1
, S. Sosio48A,48C, S. Spataro48A,48C, G. X. Sun1
, J. F. Sun15 , S. S. Sun1 , Y. J. Sun45 , Y. Z. Sun1 , Z. J. Sun1 , Z. T. Sun19 , C. J. Tang36 , X. Tang1 , I. Tapan40C, E. H. Thorndike44 , M. Tiemens25 , D. Toth43 , M. Ullrich24 , I. Uman40B, G. S. Varner42 , B. Wang30 , B. L. Wang41 , D. Wang31 , D. Y. Wang31 , K. Wang1 , L. L. Wang1 , L. S. Wang1 , M. Wang33 , P. Wang1 , P. L. Wang1 , Q. J. Wang1 , S. G. Wang31 , W. Wang1 , X. F. Wang39 , Y. D. Wang14 , Y. F. Wang1 , Y. Q. Wang22 , Z. Wang1 , Z. G. Wang1 , Z. H. Wang45 , Z. Y. Wang1 , T. Weber22 , D. H. Wei11 , J. B. Wei31 , P. Weidenkaff22 , S. P. Wen1 , U. Wiedner4 , M. Wolke49 , L. H. Wu1 , Z. Wu1 , L. G. Xia39 , Y. Xia18 , D. Xiao1 , Z. J. Xiao28 , Y. G. Xie1 , Q. L. Xiu1 ,
G. F. Xu1, L. Xu1, Q. J. Xu13, Q. N. Xu41, X. P. Xu37, L. Yan45, W. B. Yan45, W. C. Yan45, Y. H. Yan18, H. X. Yang1,
L. Yang50 , Y. Yang6 , Y. X. Yang11 , H. Ye1 , M. Ye1 , M. H. Ye7 , J. H. Yin1 , B. X. Yu1 , C. X. Yu30 , H. W. Yu31 , J. S. Yu26 , C. Z. Yuan1 , W. L. Yuan29 , Y. Yuan1 , A. Yuncu40B,g, A. A. Zafar47
, A. Zallo20A, Y. Zeng18
, B. X. Zhang1
, B. Y. Zhang1
,
C. Zhang29, C. C. Zhang1, D. H. Zhang1, H. H. Zhang38, H. Y. Zhang1, J. J. Zhang1, J. L. Zhang1, J. Q. Zhang1,
J. W. Zhang1 , J. Y. Zhang1 , J. Z. Zhang1 , K. Zhang1 , L. Zhang1 , S. H. Zhang1 , X. Y. Zhang33 , Y. Zhang1 , Y. H. Zhang1 , Y. T. Zhang45 , Z. H. Zhang6 , Z. P. Zhang45 , Z. Y. Zhang50 , G. Zhao1 , J. W. Zhao1 , J. Y. Zhao1 , J. Z. Zhao1 , Lei Zhao45 , Ling Zhao1 , M. G. Zhao30 , Q. Zhao1 , Q. W. Zhao1 , S. J. Zhao52 , T. C. Zhao1 , Y. B. Zhao1 , Z. G. Zhao45 , A. Zhemchugov23,h, B. Zheng46 , J. P. Zheng1 , W. J. Zheng33 , Y. H. Zheng41 , B. Zhong28 , L. Zhou1 , Li Zhou30 , X. Zhou50 , X. K. Zhou45 , X. R. Zhou45 , X. Y. Zhou1 , K. Zhu1 , K. J. Zhu1 , S. Zhu1 , X. L. Zhu39 , Y. C. Zhu45 , Y. S. Zhu1 , Z. A. Zhu1 , J. Zhuang1
, L. Zotti48A,48C, B. S. Zou1
, J. H. Zou1
(BESIII Collaboration)
1
Institute of High Energy Physics, Beijing 100049, People’s Republic of China
2
Beihang University, Beijing 100191, People’s Republic of China
3 Beijing Institute of Petrochemical Technology, Beijing 102617, People’s Republic of China
4
Bochum Ruhr-University, D-44780 Bochum, Germany
5
Carnegie Mellon University, Pittsburgh, Pennsylvania 15213, USA
6 Central China Normal University, Wuhan 430079, People’s Republic of China
7
China Center of Advanced Science and Technology, Beijing 100190, People’s Republic of China
8
COMSATS Institute of Information Technology, Lahore, Defence Road, Off Raiwind Road, 54000 Lahore, Pakistan
9 G.I. Budker Institute of Nuclear Physics SB RAS (BINP), Novosibirsk 630090, Russia
10
GSI Helmholtzcentre for Heavy Ion Research GmbH, D-64291 Darmstadt, Germany
11
Guangxi Normal University, Guilin 541004, People’s Republic of China
12
GuangXi University, Nanning 530004, People’s Republic of China
13
14
Helmholtz Institute Mainz, Johann-Joachim-Becher-Weg 45, D-55099 Mainz, Germany
15
Henan Normal University, Xinxiang 453007, People’s Republic of China
16 Henan University of Science and Technology, Luoyang 471003, People’s Republic of China
17
Huangshan College, Huangshan 245000, People’s Republic of China
18
Hunan University, Changsha 410082, People’s Republic of China
19 Indiana University, Bloomington, Indiana 47405, USA
20
(A)INFN Laboratori Nazionali di Frascati, I-00044, Frascati, Italy; (B)INFN and University of Perugia, I-06100, Perugia, Italy
21 (A)INFN Sezione di Ferrara, I-44122, Ferrara, Italy; (B)University of Ferrara, I-44122, Ferrara, Italy
22
Johannes Gutenberg University of Mainz, Johann-Joachim-Becher-Weg 45, D-55099 Mainz, Germany
23
Joint Institute for Nuclear Research, 141980 Dubna, Moscow region, Russia
24
Justus Liebig University Giessen, II. Physikalisches Institut, Heinrich-Buff-Ring 16, D-35392 Giessen, Germany
25
KVI-CART, University of Groningen, NL-9747 AA Groningen, The Netherlands
26
Lanzhou University, Lanzhou 730000, People’s Republic of China
27
Liaoning University, Shenyang 110036, People’s Republic of China
28 Nanjing Normal University, Nanjing 210023, People’s Republic of China
29
Nanjing University, Nanjing 210093, People’s Republic of China
30
Nankai University, Tianjin 300071, People’s Republic of China
31 Peking University, Beijing 100871, People’s Republic of China
32
Seoul National University, Seoul, 151-747 Korea
33
Shandong University, Jinan 250100, People’s Republic of China
34
Shanghai Jiao Tong University, Shanghai 200240, People’s Republic of China
35
Shanxi University, Taiyuan 030006, People’s Republic of China
36
Sichuan University, Chengdu 610064, People’s Republic of China
37
Soochow University, Suzhou 215006, People’s Republic of China
38Sun Yat-Sen University, Guangzhou 510275, People’s Republic of China
39
Tsinghua University, Beijing 100084, People’s Republic of China
40
(A)Istanbul Aydin University, 34295 Sefakoy, Istanbul, Turkey; (B)Dogus University, 34722 Istanbul, Turkey; (C)Uludag University, 16059 Bursa, Turkey
41
University of Chinese Academy of Sciences, Beijing 100049, People’s Republic of China
42
University of Hawaii, Honolulu, Hawaii 96822, USA
43 University of Minnesota, Minneapolis, Minnesota 55455, USA
44
University of Rochester, Rochester, New York 14627, USA
45
University of Science and Technology of China, Hefei 230026, People’s Republic of China
46 University of South China, Hengyang 421001, People’s Republic of China
47
University of the Punjab, Lahore-54590, Pakistan
48
(A)University of Turin, I-10125, Turin, Italy; (B)University of Eastern Piedmont, I-15121, Alessandria, Italy; (C)INFN, I-10125, Turin, Italy
49 Uppsala University, Box 516, SE-75120 Uppsala, Sweden
50
Wuhan University, Wuhan 430072, People’s Republic of China
51
Zhejiang University, Hangzhou 310027, People’s Republic of China
52
Zhengzhou University, Zhengzhou 450001, People’s Republic of China
a Also at the Novosibirsk State University, Novosibirsk, 630090, Russia
bAlso at Ankara University, 06100 Tandogan, Ankara, Turkey
c Also at the Moscow Institute of Physics and Technology, Moscow 141700, Russia and at the Functional Electronics
Laboratory, Tomsk State University, Tomsk, 634050, Russia
dCurrently at Istanbul Arel University, 34295 Istanbul, Turkey
e Also at University of Texas at Dallas, Richardson, Texas 75083, USA
f Also at the NRC ”Kurchatov Institute”, PNPI, 188300, Gatchina, Russia
g Also at Bogazici University, 34342 Istanbul, Turkey
hAlso at the Moscow Institute of Physics and Technology, Moscow 141700, Russia
1
1
Using a sample of 1.31 billion J/ψ events collected with the BESIII detector at the BEPCII
collider, the decays J/ψ → φπ+π−π0 and J/ψ → φπ0π0π0 are investigated. The isospin violating
decay J/ψ → φπ0
f0(980) with f0(980) → ππ, is observed for the first time. The width of the f0(980)
obtained from the dipion mass spectrum is found to be much smaller than the world average value.
In the π0
f0(980) mass spectrum, there is evidence of f1(1285) production. By studying the decay
J/ψ → φη′, the branching fractions of η′ →π+
π−π0
and η′ →π0
π0
π0
also measured.
PACS numbers: 13.25.Gv, 14.40.Be
I. INTRODUCTION
The nature of the scalar meson f0(980) is a
long-standing puzzle. It has been interpreted as a q ¯q state, a K ¯K molecule, a glueball, and a four-quark state (see the review in Ref. [1]). Further insights are expected from studies of f0(980) mixing with the a00(980) [2],
ev-idence for which was found in a recent BESIII analy-sis of J/ψ and χc1 decays [3]. BESIII also observed a
large isospin violation in J/ψ radiatively decaying into π+π−π0 and π0π0π0 involving the intermediate decay
η(1405) → π0f
0(980) [4]. In this study, the f0(980) width
was found to be 9.5 ± 1.1 MeV/c2. One proposed
expla-nation for this anomalously narrow width and the ob-served large isospin violation, which cannot be caused by a0
0(980) − f0(980) mixing, is the triangle singularity
mechanism [5, 6].
The decays J/ψ → φπ+π−π0and J/ψ → φπ0π0π0are
similar to the radiative decays J/ψ → γπ+π−π0/π0π0π0
as the φ and γ share the same spin and parity quan-tum numbers. Any intermediate f0(980) would be
no-ticeable in the ππ mass spectra. At the same time, a study of the decay J/ψ → φη′ would enable a
mea-surement of the branching fractions for η′ → π+π−π0
and η′ → π0π0π0. The recently measured B(η′ →
3π0) = (3.56 ± 0.40) × 10−3[4] from a study of the decay J/ψ → γη′ was found to be nearly 4σ higher than the
previous value (1.73 ± 0.23) × 10−3 from studies of the
reaction π−p → n(6γ) [7–9]1. Additionally, the
isospin-violating decays η′ → π+π−π0/π0π0π0 provide a means
to extract the d, u quark mass difference md− mu [10].
This paper reports a study of J/ψ → φπ+π−π0 and
J/ψ → φπ0π0π0 with φ → K+K− based on a sample
of (1.311 ± 0.011) × 109[11, 12] J/ψ events accumulated
with the BESIII detector in 2009 and 2012.
II. DETECTOR AND MONTE CARLO
SIMULATION
The BESIII detector [13] is a magnetic spectrom-eter located at the Beijing Electron-Positron Collider (BEPCII), which is a double-ring e+e− collider with a
design luminosity of 1033 cm−2s−1 at a center of mass
(c.m.) energy of 3.773 GeV. The cylindrical core of the BESIII detector consists of a helium-based main drift chamber (MDC), a plastic scintillator time-of-flight sys-tem (TOF), and a CsI(Tl) electromagnetic calorimeter
1
The PDG [1] gives an average value, Γ(η′ → 3π0
)/Γ(η′ → π0π0η) = 0.0078 ± 0.0010, of three measurements [7–9]. B(η′→ 3π0) is calculated using B(η′ → π0π0η) = 0.222 ± 0.008 [1],
assuming the uncertainties are independent.
(EMC). All are enclosed in a superconducting solenoidal magnet providing a 1.0 T (0.9 T in 2012) magnetic field. The solenoid is supported by an octagonal flux-return yoke with resistive plate counter muon identifier mod-ules interleaved with steel. The acceptance for charged tracks and photons is 93% of 4π solid angle. The charged-particle momentum resolution is 0.5% at 1 GeV/c, and the specific energy loss (dE/dx) resolution is better than 6%. The photon energy is measured in the EMC with a resolution of 2.5% (5%) at 1 GeV in the barrel (end-caps). The time resolution of the TOF is 80 ps (110 ps) in the barrel (endcaps). The BESIII offline software sys-tem framework, based on the Gaudi package [14], pro-vides standard interfaces and utilities for event simula-tion, data processing and physics analysis.
Monte Carlo (MC) simulation, based on the GEANT4[15] package, is used to simulate the detector response, study the background and determine efficien-cies. For this analysis, we use a phase space MC sample to describe the three body decay J/ψ → φπ0f
0(980),
while the angular distributions are considered in the de-cays J/ψ → φf1(1285) → φπ0f0(980) and J/ψ → φη′.
In the MC samples, the width of the f0(980) is fixed to
be 15.3 MeV/c2, which is obtained from a fit to data
as described below. An inclusive MC sample of 1.2 bil-lion J/ψ decays is used to study the background. For this MC sample, the generator BesEvtGen [16, 17] is used to generate the known J/ψ decays according to their measured branching fractions [1] while Lundcharm [18] is used to generate the remaining unknown decays.
III. EVENT SELECTION
Charged tracks are reconstructed from hits in the MDC and selected by requiring that | cos θ| < 0.93, where θ is the polar angle measured in the MDC, and that the point of closest approach to the e+e− interaction point
is within ±10 cm in the beam direction and within 1 cm in the plane perpendicular to the beam direction. TOF and dE/dx information are combined to calculate the particle identification (PID) probabilities for the pion, kaon and proton hypotheses. For each photon, the energy deposited in the EMC must be at least 25 MeV (50 MeV) in the region of | cos θ| < 0.8 (0.86 < | cos θ| < 0.92). To exclude showers that originate from charged tracks, the angle between a photon candidate and the closest charged track must be larger than 10◦. The timing information
from the EMC is used to suppress electronics noise and unrelated energy deposits.
To be accepted as a J/ψ → K+K−π+π−π0 decay, a
candidate event is required to have four charged tracks with zero net charge and at least two photons. The two oppositely charged tracks with an invariant mass closest
to the nominal mass of the φ are assigned as being kaons, while the remaining tracks are assigned as being pions. To avoid misidentification, kaon tracks are required to have a PID probability of being a kaon that is larger than that of being a pion. A 5-constraint kinematic fit is applied to the candidate events under the hypothesis J/ψ → K+K−π+π−γγ. This includes a constraint that
the total four-momenta of the selected particles must be equal to the initial four-momentum of the colliding beams (4-constraint) and that the invariant mass of the two pho-tons must be the nominal mass of the π0 (1-constraint).
If more than 2 photon candidates are found in the event, the combination with the minimum χ2(5C) from the
kinematic fit is retained. Only events with a χ2(5C) less
than 100 are accepted. Events with a K±π∓ invariant
mass satisfying |M (K±π∓) − M (K∗0)| < 0.050 GeV/c2
are rejected in order to suppress the background contain-ing K∗0 or ¯K∗0intermediate states.
To be accepted as a J/ψ → K+K−π0π0π0 decay,
a candidate event is required to have two oppositely charged tracks and at least six photons. For both tracks, the PID probability of being a kaon must be larger than that of being a pion. The six photons are selected and paired by minimizing the quantity (M(γ1γ2)−Mπ0)
2 σ2 π0 + (M(γ3γ4)−Mπ0) 2 σ2 π0 + (M(γ5γ6)−Mπ0) 2 σ2 π0 , where M (γiγj) is the
mass of γiγj, and Mπ0 and σπ0 are the nominal mass
and reconstruction resolution of the π0 respectively. A
7-constraint kinematic fit is performed to the J/ψ → K+K−6γ hypothesis, where the constraints include the
four-momentum constraint to the four-momentum of the colliding beams and three constraints of photon pairs to have invariant masses equal to the π0. Events with a χ2(7C) less than 90 are accepted.
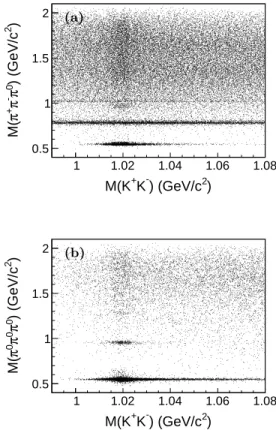
Figures 1 (a) and (b) show M (3π) versus M (K+K−)
for the two final states respectively. Clear signals from φη and φη′ with η′→ 3π0are noticeable. In Fig. 1 (a),
hor-izontal bands are noticeable from ω and φ decaying into π+π−π0 in the background channel J/ψ → ω/φK+K−.
To search for the decay J/ψ → φπ0f
0(980), we
fo-cus on the region 0.99 < M (K+K−) < 1.06 GeV/c2
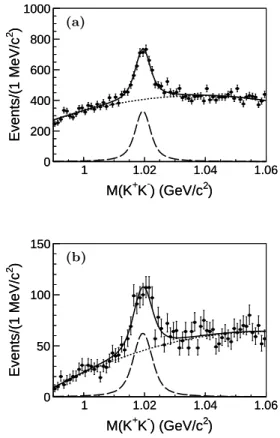
and 0.850 < M (ππ) < 1.150 GeV/c2. The M (K+K−)
spectra are shown in Fig. 2. Clear φ signals are visible. The M (π+π−) and M (π0π0) spectra for the φ signal
re-gion, which is defined by requiring 1.015 < M (K+K−) <
1.025 GeV/c2, are presented in Fig. 3 (a) and (b)
respec-tively. A clear f0(980) peak exists for the π+π− mode.
The M (f0(980)[ππ]π0) spectra for the f0(980) signal
re-gion, defined as 0.960 < M (ππ) < 1.020 GeV/c2, are
pre-sented in Fig. 4. There is evidence of a resonance around 1.28 GeV/c2 for the decay f
0(980) → π+π−, which will
be identified as the f1(1285)2.
To ensure that the observed f0 and f1 signals do not
originate from background processes, the same selection
2 For simplicity, f
0(980) and f1(1285) will be written as f0and f1
respectively throughout this paper.
) 2 ) (GeV/c -K + M(K 1 1.02 1.04 1.06 1.08 ) 2 ) (GeV/c 0π - π + π M( 0.5 1 1.5 2 (a) ) 2 ) (GeV/c -K + M(K 1 1.02 1.04 1.06 1.08 ) 2 ) (GeV/c 0π 0π 0π M( 0.5 1 1.5 2 (b)
FIG. 1. Scatter plots of (a) M (π+π−π0) versus M (K+K−)
and (b) M (π0
π0
π0
) versus M (K+
K−).
criteria as described above are applied to an MC sample of 1.2 billion inclusive J/ψ decays which does not con-tain the signal decay. As expected, neither an f1 nor
an f0 is observed from the inclusive MC sample. The
non-φ background is studied using data from the φ side-band regions (0.990 < M (K+K−) < 1.000 GeV/c2 and
1.040 < M (K+K−) < 1.050 GeV/c2), which are given
by the hatched histograms in Fig. 3 and Fig. 4 and in which no f0 or f1signals are observed.
IV. SIGNAL EXTRACTION OF J/ψ → φπ0f
0(980)
Figures 3 (a) and (b) show the π+π− and π0π0 mass
spectra for events with M (K+K−) in the φ signal region
(the black dots) and sideband regions (the hatched his-togram scaled by a normalization factor, C). Events in the φ sideband regions are normalized in the following way. A fit is performed to the K+K− mass spectrum,
where the φ signal is described by a Breit-Wigner func-tion convoluted with a Gaussian resolufunc-tion funcfunc-tion and the background is described by a second-order polyno-mial. The mass and width of the φ resonance are fixed to their world average values [1] and the mass resolution is allowed to float. The normalization factor C is defined as Asig/Asbd, where Asig (Asbd) is the area of the
region. The results of the fits are shown in Fig. 2 (a) and (b).
To extract the signal yield of J/ψ → φπ0f
0, a
simul-taneous unbinned maximum likelihood fit is performed to the π+π− and π0π0 mass spectra. The lineshape of
the f0 signal is different from that of the Flatt´e-form
resonance observed in the decays J/ψ → φπ+π− and
J/ψ → φK+K− [19]. A Breit-Wigner function
convo-luted with a Gaussian mass resolution function is used to describe the f0 signal. The mass resolutions of the f0
in the M (π+π−) and M (π0π0) spectra are determined
from MC simulations. The non-φ background is param-eterized with a straight line, which is determined from a fit to the data in the φ sideband regions. The size of this polynomial is fixed according to the normalized number of background events under the φ peak, Nbkg= CNsbd,
where Nsbd is the number of events falling in the φ
side-band regions and C is the normalization factor obtained above. Another straight line is used to account for the remaining background from J/ψ → φπ0ππ without f
0
decaying into ππ.
The mass and width of the f0are constrained to be the
same for both the K+K−π+π−π0and the K+K−π0π0π0
final states. The fit yields the values M (f0) = 989.4 ±
1.3 MeV/c2 and Γ(f
0) = 15.3 ± 4.7 MeV/c2, with the
number of events N = 354.7 ± 63.3 for the π+π− mode
and 69.8 ± 21.1 for the π0π0mode. The statistical
signif-icance is determined by the changes of the log likelihood value and the number of degrees of freedom in the fit with and without the signal [20]. The significance of the f0
sig-nal is 9.4σ in the K+K−π+π−π0 final state and 3.2σ in
the K+K−π0π0π0 final state. The measured mass and
width obtained from the invariant dipion mass spectrum are consistent with those from the study of the decay J/ψ → γη(1405) → γπ0f
0(980) [4]. It is worth noting
that the measured width of the f0observed in the dipion
mass spectrum is much smaller than the world average value of 40-100 MeV [1].
V. SIGNAL EXTRACTION OF J/ψ → φf1(1285)
WITH f1(1285) → π
0
f0(980)
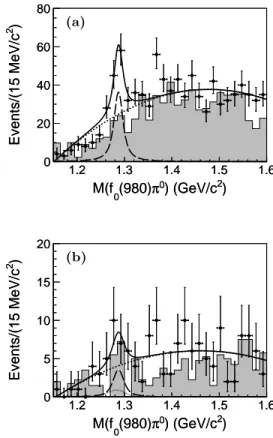
Figures 4 (a) and (b) show the π+π−π0 and π0π0π0
mass spectra in the φ and f0 signal region (the black
dots) and sideband regions (the hatched histogram). The f0 sideband regions are defined as 0.850 < M (ππ) <
0.910 GeV/c2 and 1.070 < M (ππ) < 1.130 GeV/c2.
In Fig. 4, events in the 2-dimensional sideband regions are weighted as follows. Events that fall in only the φ or f0(980) sideband regions are given a weight 0.5 to
take into account the non-φ or non-f0(980) background
while those that fall in both the φ and the f0(980)
side-band regions are given a weight −0.25 to compensate for the double counting of the non-φ and non-f0(980)
background. There is evidence of a resonance around 1.28 GeV/c2 that is not noticeable in the 2-dimensional
sideband regions. By studying an MC sample of the
de-) 2 ) (GeV/c -K + M(K 1 1.02 1.04 1.06 ) 2 Events/(1 MeV/c 0 200 400 600 800 1000 ) 2 ) (GeV/c -K + M(K 1 1.02 1.04 1.06 ) 2 Events/(1 MeV/c 0 200 400 600 800 1000 (a) ) 2 ) (GeV/c -K + M(K 1 1.02 1.04 1.06 ) 2 Events/(1 MeV/c 0 50 100 150 ) 2 ) (GeV/c -K + M(K 1 1.02 1.04 1.06 ) 2 Events/(1 MeV/c 0 50 100 150 (b)
FIG. 2. Fits to the M (K+K−) mass spectra for the mode (a)
f0(980) → π + π−and (b) f 0(980) → π 0 π0
. The solid curve is the full fit; the long-dashed curve is the φ signal while the short-dashed curve is the background.
cay J/ψ → φf1 → anything, we find that the decay
f1→ π0π0η/π0a00 3 with η → γγ contributes as a
peak-ing background for the decay f1 → π0π0π0. The yield
of this peaking background is calculated to be 3.1 ± 0.6 using the relevant branching fractions4 [1] and the
effi-ciency determined from an MC simulation. A simulta-neous unbinned maximum likelihood fit is performed to the M (π+π−π0) and M (π0π0π0) distributions. The f
1
signal is described by a Breit-Wigner function convoluted with a Gaussian mass resolution function. The shape of the peaking background f1→ π0π0η/π0a00is determined
from an exclusive MC sample and its size is fixed to be 3.1. A second order polynomial function is used to de-scribe the remaining background. The mass resolutions of the f1in M (π+π−π0) and M (π0π0π0) are determined
from MC simulations.
The fit to M (π+π−π0) and M (π0π0π0) distributions
yields the values M (f1) = 1287.4 ± 3.0 MeV/c2 and
Γ(f1) = 18.3 ± 6.3 MeV/c2, with the number of events
3
For simplicity, a0(980) and a00(980) are written as a0 and a00
respectively throughout this paper.
4 We assume that B(f1 → π0π0η) = 13B(f1 → ππη), B(f1 → π0 a0 0) = 1
3B(f1→πa0), and B(a 0 0→π
0
) 2 ) (GeV/c -π + π M( 0.85 0.9 0.95 1 1.05 1.1 1.15 ) 2 Events/(10 MeV/c 0 100 200 300 400 500 ) 2 ) (GeV/c -π + π M( 0.85 0.9 0.95 1 1.05 1.1 1.15 ) 2 Events/(10 MeV/c 0 100 200 300 400 500 (a) ) 2 ) (GeV/c 0 π 0 π M( 0.85 0.9 0.95 1 1.05 1.1 1.15 ) 2 Events/(10 MeV/c 0 20 40 60 80 100 ) 2 ) (GeV/c 0 π 0 π M( 0.85 0.9 0.95 1 1.05 1.1 1.15 ) 2 Events/(10 MeV/c 0 20 40 60 80 100 (b)
FIG. 3. The spectra (a) M (π+π−) and (b) M (π0π0) (three
entries per event) with K+
K−in the φ signal region (the black
dots) and in the φ sideband regions (the hatched histogram). The solid curve is the full fit; the long-dashed curve is the f0(980) signal; the dotted line is the non-φ background and
the short-dashed line is the total background.
N = 78.2 ± 19.3 for the K+K−π+π−π0 final state and
N = 8.7 ± 6.8 (< 18.2 at the 90% Confidence Level (C. L.)) for the K+K−π0π0π0 final state. The mass and
width are consistent with those of the axial-vector me-son f1[1]5. The statistical significance of the f1signal is
5.2σ for the K+K−π+π−π0 final state and 1.8σ for the
K+K−π0π0π0 final state. From the fit results,
summa-rized in Table I, it is clear that the production of a single f1 resonance cannot account for all of the f0π0 events
above the background.
VI. SIGNAL EXTRACTION OF J/ψ → φη′
For the decay J/ψ → φη′ → K+K−π+π−π0, the
de-cays J/ψ → φη′ → K+K−γρ[(γ)π+π−] and J/ψ →
φη′→ K+K−γω[π+π−π0] produce peaking background.
5
Here we assume that the contribution of the pseudoscalar η(1295) is small as no significant η(1295) signals were found in the π+π−η
mass spectrum from a study of J/ψ → φπ+π−η [21].
) 2 ) (GeV/c 0 π (980) 0 M(f 1.2 1.3 1.4 1.5 1.6 ) 2 Events/(15 MeV/c 0 20 40 60 80 ) 2 ) (GeV/c 0 π (980) 0 M(f 1.2 1.3 1.4 1.5 1.6 ) 2 Events/(15 MeV/c 0 20 40 60 80 (a) ) 2 ) (GeV/c 0 π (980) 0 M(f 1.2 1.3 1.4 1.5 1.6 ) 2 Events/(15 MeV/c 0 5 10 15 20 ) 2 ) (GeV/c 0 π (980) 0 M(f 1.2 1.3 1.4 1.5 1.6 ) 2 Events/(15 MeV/c 0 5 10 15 20 (b)
FIG. 4. The spectra of (a) M (π+π−π0) and (b) M (π0π0π0)
in the φ and f0(980) signal region (the black dots with error
bars) and in the sideband regions (the hatched histogram). The solid curve is the result of the fit, the long-dashed curve is the f1(1285) signal, and the short-dashed curve is the
ground. In (b), the dotted curve represents the peaking back-ground from the decay f1(1285) → π0π0η/π0a00 with η → γγ.
To reduce the former peaking background which is dom-inant, events with 0.920 < M (γπ+π−) < 0.970 GeV/c2
are rejected.
As the amount of background for the decay J/ψ → φη′ → K+K−π0π0π0 is relatively small, the φ
sig-nal and sideband regions are expanded to be 1.010 < M (K+K−) < 1.030 GeV/c2 and 1.040 < M (K+K−) <
1.060 GeV/c2, respectively. A peaking background
for this decay comes from the decay J/ψ → φη′ →
K+K−π0π0η[γγ]. To reduce this background, events
with any photon pair mass in the range 0.510 < M (γγ) < 0.580 GeV/c2 are rejected.
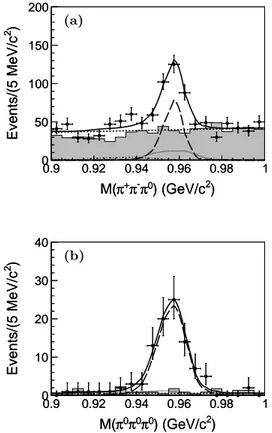
Figures 5 (a) and (b) show the final π+π−π0 and
π0π0π0 mass spectra for the φ signal (the black dots)
and sideband (the hatched histogram) regions. By ana-lyzing data in the φ sideband regions and the inclusive MC sample, we find that the contribution from the decay J/ψ → K+K−η′ is negligible.
An unbinned likelihood fit is performed to obtain the signal yields. The η′ signal shape is determined by
sam-pling a histogram from an MC simulation convoluted with a Gaussian function to compensate for the
reso-) 2 ) (GeV/c 0 π -π + π M( 0.9 0.92 0.94 0.96 0.98 1 ) 2 Events/(5 MeV/c 0 50 100 150 200 ) 2 ) (GeV/c 0 π -π + π M( 0.9 0.92 0.94 0.96 0.98 1 ) 2 Events/(5 MeV/c 0 50 100 150 200 (a) ) 2 ) (GeV/c 0 π 0 π 0 π M( 0.9 0.92 0.94 0.96 0.98 1 ) 2 Events/(5 MeV/c 0 10 20 30 40 ) 2 ) (GeV/c 0 π 0 π 0 π M( 0.9 0.92 0.94 0.96 0.98 1 ) 2 Events/(5 MeV/c 0 10 20 30 40 (b)
FIG. 5. The spectra (a) M (π+π−π0) and (b) M (π0π0π0)
with K+
K−in the φ signal region (the black dots) and
side-band regions (the hatched histogram). The solid curve is the result of the fit, the long-dashed curve is the η′ signal,
and the short-dashed line is the polynomial background. In (a), the dotted and dot-dashed curves represent the peaking background η′→γρ → γ(γ)π+
π−and η′→γω → γπ+
π−π0
, respectively. In (b), the dotted curve represents the peaking background η′→π0
π0
η with η → γγ.
lution difference between the data and the MC sam-ple. The shape of the peaking background is determined from exclusive MC samples, where the relative size of the background shape is determined using the relevant branching fractions in the PDG [1]. The non-peaking background is described by a first-order (zeroth-order) polynomial for the η′ → π+π−π0 (π0π0π0) decay. The
number of events are determined to be N = 183.3 ± 21.0 for the K+K−π+π−π0 final state and 77.6 ± 9.6 for the
K+K−π0π0π0 final state.
VII. BRANCHING FRACTIONS
MEASUREMENT
Table I summarizes the signal yields extracted from the fits for each decay. Equations (1) and (2) give the formulae used to calculate the branching fractions, where n is the number of π0s in the final state X. Nobs and
ǫ are the signal yield from the fits and efficiency from
TABLE I. Summary of the observed number of events (Nobs
, the errors are statistical only.).
Decay mode Nobs
J/ψ → φπ0f 0, f0→π+π− 354.7 ± 63.3 J/ψ → φπ0 f0, f0→π0π0 69.8 ± 21.1 J/ψ → φf1, f1→π0f0,f0→π+π− 78.2 ± 19.3 J/ψ → φf1, f1→π0f0, f0→π0π0 8.7 ± 6.8 < 18.2 (90% C.L.) J/ψ → φη′, η′→π+ π−π0 183.3 ± 21.0 J/ψ → φη′, η′→π0 π0 π0 77.6 ± 9.6
the MC simulation for each decay, respectively. BX Y Z is
the branching fraction of the decay X → Y Z. NJ/ψ is
the number of J/ψ events. The upper limit of B(J/ψ → φf1, f1 → π0f0, f0 → π0π0) is determined according to
Eq. (3), where Nobs
upp is the signal yield at the 90% C.
L. and σsys is the total systematic uncertainty, which
is described in the next section. Equation (4) is used to calculate the ratio between the branching fraction for η′ → π0π0π0and that for η′ → π+π−π0.
B(J/ψ → φX) = N obs NJ/ψǫBKφ+K−(B π0 γγ)n (1) B(η′→ X) = Nobs NJ/ψǫB J/ψ φη′ B φ K+K−(Bπ 0 γγ)n (2) B(J/ψ → φX) < N obs upp NJ/ψǫBφK+K−(B π0 γγ)n(1 − σsys) (3) r3π≡ B(η′→ π0π0π0)/B(η′→ π+π−π0) = N obs(π0π0π0) Nobs(π+π−π0) ǫ(π+π−π0) ǫ(π0π0π0) 1 (Bπ0 γγ)2 (4)
VIII. ESTIMATION OF THE SYSTEMATIC
UNCERTAINTIES
(1) MDC tracking: The tracking efficiency of kaon tracks is studied using a high purity sample of J/ψ → KSKπ events. The tracking efficiency
of the low-momentum pion tracks is studied us-ing a sample of J/ψ → π+π−p¯p while that of the
high-momentum pion tracks is studied using a high statistics sample of J/ψ → ρπ. The MC samples and data agree within 1% for each kaon or pion track.
(2) Photon detection: The photon detection efficiency is studied using a sample of J/ψ → ρπ events. The systematic uncertainty for each photon is 1% [22].
(3) PID efficiency: To study the PID efficiency for kaon tracks, we select a clean sample of J/ψ → φη → K+K−γγ. The PID efficiency is the ratio
of the number of events with and without the PID requirement for both kaon tracks. MC simulation is found to agree with data within 0.5%.
(4) Kinematic fit: The performance of the kine-matic fit is studied using a sample J/ψ → φη → K+K−π+π−π0/K+K−π0π0π0, which has
the same final states as the signal channel J/ψ → φπ0f
0 with φ → K+K− and f0 → π+π−/π0π0.
The control sample is selected without using the kinematic constraints. We then apply the same kinematic constraints and the same requirement on the χ2 from the kinematic fit. The efficiency is the
ratio of the yields with and without the kinematic fit. It contributes a systematic uncertainty of 1.0% for f0→ π+π− and 2.0% for f0→ π0π0.
(5) Veto neutral K∗: In selecting the candidate events
J/ψ → φπ0f
0 → K+K−π+π−π0, the events
with |M (K±π∓) − M (K∗0)| < 0.050 GeV/c2
are vetoed to suppress the background contain-ing K∗0 or ¯K∗0 intermediate states. The
require-ment is investigated using a clean sample J/ψ → φη → K+K−π+π−π0. The efficiency is given by
the yield ratio with and without the requirement |M (K±π∓) − M (K∗0)| < 0.050 GeV/c2. The
effi-ciency difference between data and MC is 0.1%.
(6) φ signal region: The uncertainty due to the re-striction on the φ signal region is studied with a high purity sample of J/ψ → φη′ → K+K−π+π−η
events as this sample is free of the background J/ψ → K+K−η′ without the intermediate state
φ.
(7) Veto peaking background: The uncertainties due to the restrictions used to remove peaking background in the mode η′ → 3π are studied with a control
sample of J/ψ → ωη → 2(π+π−π0) events. For
each sample, the efficiency is estimated by compar-ing the yields with and without the correspondcompar-ing requirement. The difference in efficiency between the data and MC samples is taken as the system-atic uncertainty.
(8) Background shape: To study the effect of the back-ground shape, the fits are repeated with a different fit range or polynomial order. The largest differ-ence in signal yield is taken as the systematic un-certainty.
(9) Mass resolution: The mass resolutions, σMC, from
an MC simulation of the modes f0 → π+π−/π0π0
and f1 → π0f0 have an associated systematic
un-certainty. The difference in mass resolution, σG,
between the data and the MC simulation is deter-mined using a sample of J/ψ → φη events where
η → π+π−π0/π0π0π0. The fit is repeated
us-ing different mass resolutions, which are defined as pσ2
MC+ σ2G assuming σG is the same for the
two-pion and three-two-pion mass spectra. The difference in yield is taken as a systematic uncertainty.
(10) MC simulation: For the decay J/ψ → φπ0f 0, the
dominant systematic uncertainty is from the effi-ciency ǫ0determined by a phase space MC
simula-tion. The π0f
0invariant mass spectrum is divided
into 5 bins, each with a bin width of 0.2 GeV/c2.
The f0 signal yields, Ni, are determined by fits
to the ππ spectra for each bin i using the mass and width of the f0 obtained above. The
cor-rected efficiency is ǫM ≡ P
iNi P
iNi/ǫi, where ǫi is
the efficiency in the i-th bin. The same proce-dure is applied to the angular distribution of the π0f
0 system in the c.m. frame of the J/ψ to
ob-tain another corrected efficiency ǫθ. The difference
p(ǫM− ǫ0)2+ (ǫθ− ǫ0)2 is taken as the
system-atic uncertainty due to the imperfection of the MC simulation.
(11) f0 signal region: For the decay J/ψ → φf1 with
f1→ π0f0, the f0signal region is 0.960 < M (ππ) <
1.020 GeV/c2. The branching fraction
measure-ments are repeated after varying this region to 0.970 < M (ππ) < 1.010 GeV/c2 and 0.950 <
M (ππ) < 1.030 GeV/c2. The differences from the
nominal results are taken as the systematic uncer-tainties due to the signal region of the f0. For the
decay f1 → π0π0π0, the number of the peaking
background f1 → π0π0η[γγ] is determined to be
3.1 ± 0.6. Varying the number of the peaking back-ground within ±0.6 in the fit, the largest difference of the signal yield gives a systematic uncertainty. The systematic uncertainty values related to the f1
are shown in brackets in Table II.
(12) About B(J/ψ → φf1, f1 → π0f0, f0 → π0π0): For
the decay J/ψ → φf1, f1→ π0f0 with f0→ π0π0,
the signal yield at the 90% C. L., Nobs
upp in Eq. (3),
is the largest one among the cases with varying the fit ranges, the order of the polynomial describ-ing the background, the number of the peakdescrib-ing background, and the signal region of the f0
res-onance. The total systematic uncertainty, σsys
in Eq. (3), is the quadratic sum of the rest sys-tematic uncertainties in the third column of Ta-ble II (the values in the brackets). We obtain Nobs
upp = 29.0 and σsys = 6.9% with the efficiency
(7.21±0.08)%, determined from an MC simulation. B(J/ψ → φf1, f1→ π0f0, f0→ π0π0) is calculated
to be less than 6.98 × 10⁻⁷ at the 90% C. L.
ac-cording to Eq. (3).
(13) Uncertainty of B(J/ψ → φη′): For the decay
η′ → 3π, the dominant systematic uncertainty
(4.0 ± 0.7) × 10−4[1]. A variation in B(J/ψ → φη′)
will change the size of peaking background and thus the signal yield. In Eq. (2), it is reasonable to consider a change in the quantity Nobs/BJ/ψ φη′
with any variation in B(J/ψ → φη′). The fit to
the data is repeated after varying the number of peaking background to correspond with 1σ varia-tions in B(J/ψ → φη′) [1]. The largest difference
of Nobs/BJ/ψ
φη′ from the nominal result is taken as
the systematic uncertainty.
(14)Systematic uncertainties for r3π: In the
measure-ment of the ratio r3π of B(η′ → π0π0π0) over
B(η′→ π+π−π0), the systematic uncertainties due
to the reconstruction and identification of kaon tracks and photon detection cancel as the efficiency ratio ǫ(π0π0π0)/ǫ(π+π−π0) appears in Eq. (4).
The effect of the uncertainty in the number of peak-ing background due to the uncertainty of B(J/ψ → φη′) is also considered.
All systematic uncertainties including those on the num-ber of J/ψ events [12] and other relevant branching frac-tions from the PDG [1] are summarized in Table II, where the total systematic uncertainty is the quadratic sum of the individual contributions, assuming they are indepen-dent. Efficiency and branching fraction measurements are summarized in Table III.
IX. SUMMARY
In summary, we have studied the decay J/ψ → φ3π → K+K−3π. The isospin violating decay J/ψ → φπ0f
0
is observed for the first time. In the π0f
0 mass
spec-trum, there is an evidence of the axial-vector meson f1, but not all π0f0 pairs come from the decay of an
f1. Using B(J/ψ → φf1) = (2.6 ± 0.5) × 10−4 and
B(f1→ πa0→ ππη) = (36 ± 7)% from the PDG [1], the
ratio B(f1→ π0f0 → π0π+π−)/B(f1→ π0a00 → π0π0η)
is determined to be (3.6±1.4)% assuming isospin symme-try in the decay f1→ a0π. This value is only about 1/5
of B(η(1405) → π0f
0→ π0π+π−)/B(η(1405) → π0a00 →
π0π0η) = (17.9 ± 4.2)% [4]. On the other hand, the
mea-sured mass and width of the f0obtained from the
invari-ant dipion mass spectrum are consistent with those in the decay J/ψ → γη(1405) → γπ0f
0 [4]. The measured
f0 width is much narrower than the world average value
of 40−100 MeV [1]. It seems that there is a contradiction in the isospin-violating decays f1/η(1405) → π0f0.
How-ever, a recent theoretical work [23], based on the triangle singularity mechanism as proposed in Ref. [5, 6], analyzes the decay f1 → π0f0 → π0π+π− and predicts that the
width of the peaking structure in the f0region is about 10
MeV. It also derives B(f1 → π0f0 → π0π+π−)/B(f1 →
π0a0
0 → π0π0η) ≃ 1%, which is close to our
measure-ment. This analysis supports the argument that the na-ture of the resonances a0
0and f0as dynamically generated
makes the amount of isospin breaking strongly depen-dent on the physical process [23]. In addition, we have measured the branching fractions B(η′ → π+π−π0) =
(4.28 ± 0.49(stat.)± 0.22(syst.)± 1.09)× 10−3and B(η′→
π0π0π0) = (4.79 ± 0.59(stat.) ± 0.33(syst.) ± 1.09) × 10−3,
where the last uncertainty is due to B(J/ψ → φη′). The
ratio between them r3π= 1.12 ± 0.19(stat.) ± 0.06(syst.)
is also measured for the first time. These results are con-sistent with those measured in the decay J/ψ → γη′ [4].
X. ACKNOWLEDGEMENT
The BESIII collaboration thanks the staff of BEPCII and the IHEP computing center for their strong sup-port. This work is supported in part by National Key Basic Research Program of China under Contract No. 2015CB856700; National Natural Science Founda-tion of China (NSFC) under Contracts Nos. 11125525, 11235011, 11322544, 11335008, 11425524; the Chinese Academy of Sciences (CAS) Large-Scale Scientific Facil-ity Program; the CAS Center for Excellence in Parti-cle Physics (CCEPP); the Collaborative Innovation Cen-ter for Particles and InCen-teractions (CICPI); Joint Large-Scale Scientific Facility Funds of the NSFC and CAS under Contracts Nos. 11179007, U1232201, U1332201; CAS under Contracts Nos. YW-N29, KJCX2-YW-N45; 100 Talents Program of CAS; INPAC and Shanghai Key Laboratory for Particle Physics and Cos-mology; German Research Foundation DFG under Con-tract No. Collaborative Research Center CRC-1044; Is-tituto Nazionale di Fisica Nucleare, Italy; Ministry of Development of Turkey under Contract No. DPT2006K-120470; Russian Foundation for Basic Research under Contract No. 14-07-91152; U. S. Department of Energy under Contracts Nos. 04ER41291, DE-FG02-05ER41374, DE-FG02-94ER40823, DESC0010118; U.S. National Science Foundation; University of Groningen (RuG) and the Helmholtzzentrum fuer Schwerionen-forschung GmbH (GSI), Darmstadt; WCU Program of National Research Foundation of Korea under Contract No. R32-2008-000-10155-0
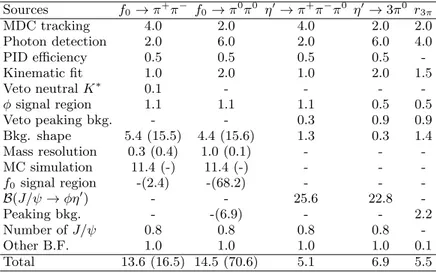
TABLE II. Summary of systematic uncertainties (%). For f0 →ππ, the values in the brackets are for the decay f1 →π0f0.
For η′→3π, the systematic uncertainty from the uncertainty of B(J/ψ → φη′) is not included in the total quadratic sum. The
last column lists the systematic uncertainties for the ratio between B(η′→π0
π0 π0 ) and B(η′→π+ π−π0 ), denoted by r3π. Sources f0→π+π− f0→π0π0 η′→π+π−π0 η′→3π0 r3π MDC tracking 4.0 2.0 4.0 2.0 2.0 Photon detection 2.0 6.0 2.0 6.0 4.0 PID efficiency 0.5 0.5 0.5 0.5 -Kinematic fit 1.0 2.0 1.0 2.0 1.5 Veto neutral K∗ 0.1 - - - -φ signal region 1.1 1.1 1.1 0.5 0.5 Veto peaking bkg. - - 0.3 0.9 0.9 Bkg. shape 5.4 (15.5) 4.4 (15.6) 1.3 0.3 1.4 Mass resolution 0.3 (0.4) 1.0 (0.1) - - -MC simulation 11.4 (-) 11.4 (-) - - -f0 signal region -(2.4) -(68.2) - - -B(J/ψ → φη′) - - 25.6 22.8 -Peaking bkg. - -(6.9) - - 2.2 Number of J/ψ 0.8 0.8 0.8 0.8 -Other B.F. 1.0 1.0 1.0 1.0 0.1 Total 13.6 (16.5) 14.5 (70.6) 5.1 6.9 5.5
TABLE III. Summary of the efficiencies and the branching fractions. For the branching fractions, the first error indicates the statistical error and the second the systematic error. For B(η′ → 3π), the third error is due to the uncertainty of
B(J/ψ → φη′) [1]. The last line gives the measured value of r
3π, defined as B(η′→π0π0π0)/B(η′→π+π−π0).
Decay mode Efficiency (%) Branching fractions
J/ψ → φπ0 f0, f0→π+π− 12.44 ± 0.10 (4.50 ± 0.80 ± 0.61) × 10−6 J/ψ → φπ0 f0, f0→π0π0 6.76 ± 0.08 (1.67 ± 0.50 ± 0.24) × 10−6 J/ψ → φf1, f1 →π0f0→π0π+π− 13.19 ± 0.11 (9.36 ± 2.31 ± 1.54) × 10−7 J/ψ → φf1, f1 →π0f0→π0π0π0 6.76 ± 0.08 (2.08 ± 1.63 ± 1.47) × 10−7 < 6.98 × 10⁻⁷ (90% C. L.) η′→π+π−π0 16.92 ± 0.12 (4.28 ± 0.49 ± 0.22 ± 1.09) × 10−3 η′→π0 π0 π0 6.55 ± 0.08 (4.79 ± 0.59 ± 0.33 ± 1.09) × 10−3 r3π 1.12 ± 0.19 ± 0.06
[1] K. A. Olive et al. (Particle Data Group), Chin. Phys. C 38, 090001 (2014).
[2] N. N. Achasov, S. A. Devyanin, G. N. Shestakov, Phys.
Lett. B 88, 367 (1979).
[3] M. Ablikim et al. (BESIII Collaboration), Phys. Rev. D
83, 032003 (2011).
[4] M. Ablikim et al. (BESIII Collaboration), Phys. Rev.
Lett. 108, 182001 (2012).
[5] J. J. Wu, X. H. Liu, Q. Zhao, B. S. Zou, Phys. Rev. Lett.
108, 081803 (2012).
[6] F. Aceti, W. H. Liang, E. Oset, J. J. Wu, and B. S. Zou,
Phys. Rev. D 86, 114007 (2012).
[7] F. Binon et al. (IHEP-IISN-LAPP Collaboration), Phys.
Lett. B 140, 264 (1984).
[8] D. Alde et al. (IHEP-IISN-LANL-LAPP Collaboration),
Z. Phys. C 36, 603 (1987).
[9] A. Blik et al., Phys. Atom. Nucl. 71, 2124 (2008).
[10] D. J. Gross, S. B. Treiman, F. Wilczek, Phys. Rev. D 19,
2188 (1979).
[11] M. Ablikim et al. (BESIII Collaboration), Chin. Phys. C
36, 915 (2012).
[12] The total number of J/ψ events taken in 2009 and 2012
is determined to be 1.311 × 10⁹
with an uncertainty 0.8%
with the same approach in Ref. [11].
[13] M. Ablikim et al., Nucl. Instrum. Meth. Phys. Res. A
614, 345 (2010).
[14] G. Barrand et al., Comput. Phys. Commun. 140, 45
(2001).
[15] S. Agostinelli et al., (GEANT4 Collaboration), Nucl.
In-strum. Meth. A 506, 250 (2003).
[16] D. J. Lange, Nucl. Instrum. Meth. A 462, 152 (2001).
[17] R. G. Ping, Chin. Phys. C 32, 599 (2008).
[18] J. C. Chen, G. S. Huang, X. R. Qi, D. H. Zhang, Y. S.
Zhu, Phys. Rev. D 62, 034003(2000).
[19] M. Ablikim et al. (BES Collaboration), Phys. Lett. B
607, 243 (2005).
[20] F. James et al., Statistic Methods in Experimental
Physics (2ndedition, World Scientific, 2007).
[21] M. Ablikim et al. (BESIII Collaboration), Phys. Rev. D
91, 052017 (2015).
[22] M. Ablikim et al. (BESIII Collaboration), Phys. Rev. D
83, 112005 (2011).
[23] F. Aceti, J. M. Dias and E. Oset, Eur. Phys. J. A 51, 48