KADIR HAS UNIVERSITY
GRADUATE SCHOOL OF SCIENCE AND ENGINEERING
REALISTIC PERFORMANCE CONSIDERATIONS FOR COMBINATIONAL COOPERATIVE DETECTION METHOD
GRADUATE THESIS
RAMEEZ AHMED SAMO September, 2016
ii RAME EZ AH M ED SA M O M as te r Thesis (M .S c) 2 0 1 6 Stu d ent’s Fu ll Na m e P h .D. (o r M .S . o r M .A .) The sis 20 11
iii REALISTIC PERFORMANCE CONSIDERATIONS FOR COMBINATIONAL
COOPERATIVE DETECTION METHOD
RAMEEZ AHMED SAMO
Submitted to the Graduate School of Science and Engineering in partial fulfillment of the requirements for the degree of
Master of Science in
ELECTRONICS ENGINEERING
KADIR HAS UNIVERSITY September, 2016
KADIR HAS UNIVERSITY
GRADUATE SCHOOL OF SCIENCE AND ENGINEERING APPENDIX B
iv C
vi
ABSTRACT
REALISTIC PERFORMANCE CONSIDERATIONS FOR COMBINATIONAL COOPERATIVE DETECTION METHOD
RAMEEZ AHMED SAMO
Master of Science in Electronics Engineering Advisor: Assoc. Prof. Dr. Serhat ERKÜÇÜK
September, 2016
Combinational cooperative detection (CCD) method is different from the conventional cooperative detection method in the sense that each user may reach a different decision for the activity of the primary user. In the CCD method, the locations of the secondary users (SUs) were fixed and selected near the border points of the communication area. The detection performance for SUs at random locations was not considered earlier. The CCD method’s practical implementation was explained with observing different system parameter’s effects on the detection performance for those fixed locations. Carrying previous work done forward, in this thesis some realistic performance considerations for the CCD method are assessed. In accordance with that, firstly, the effect of SUs random locations on the detection performance is considered and compared with the performance for fixed locations. Secondly, the effect of distance variations between master and primary user is tested. Finally, the effect of different propagation environments on the detection performance of CCD is examined. The results are important to assess the realistic performance of the CCD method.
Keywords: Conventional cooperative detection, Combinational cooperative detection, Cognitive radio.
EIX C
vii
ÖZET
KOMBINASYONEL İŞBİRLİKLİ ALGILAMA YÖNTEMİ İÇİN GERÇEKÇİ PERFORMANS SONUÇLARI
RAMEEZ AHMED SAMO Elektronik Mühendisliği Yüksek Lisans
Danışman: Doç. Dr. Serhat Erküçük Eylül 2016
Kombinasyonel işbirlikli algılama (CCD) yöntemi, her kullanıcının birincil kullanıcının aktivite durumu hakkında farklı karar verebilme özelliğinden dolayı klasik işbirlikli algılama yönteminden farklıdır. CCD yöntemini kullanan çalışmada ikincil kullanıcıların lokasyonları sabit ve sınır bölgelerinde kabul edilmiştir. İkincil kullanıcıların rastgele dağılımındaki sistem performansı dikkate alınmamıştır. CCD yönteminin pratik gerçekleştiriminde değişik sistem parametrelerinin performansı sabit noktalarda değerlendirilmiştir. Önceki çalışmayı ileri götürerek, bu tezde bazı gerçekçi koşullar dikkate alınmış ve CCD yönteminin performansı ölçülmüştür. Buna uygun olarak, ilk olarak ikincil kullancıların rastgele dağılımlarının algılama performansına etkisi incelenmiş ve sabit noktalardaki performanslar ile karşılaştırılmıştır. İkinci olarak Master ve birincil kullanıcı arasındaki uzaklığın etkisi incelenmiştir. Son olarak değişik yayılım ortamlarının algılama performansına etkisi incelenmiştir. Bu tezin sonuçları CCD yönteminin gerçekçi performansını sunması açısından önemlidir.
Anahtar Kelimeler: Klasik işbirlikli algılama, Kombinasyonel işbirlikli algılama, Bilişsel radyo.
NX C
viii
Acknowledgements
Great thanks to Almighty ALLAH who is most kind and merciful, nothing would have been possible to complete this thesis without His kindness and blessings.
I would like to praise and pass on my sincere gratitude to the honorable supervisor Assoc. Prof. Dr. Serhat ERKÜÇÜK for his precious time and the efforts that he put into to make me complete my thesis and helping me out in every difficult time during my thesis work.
Special thanks of all to my lovely parents and my family, for believing in me, for encouraging me in every difficult time of life and supporting me throughout.
I am also thankful to my friends for their timely cooperation and assistance during tough times.
Last but not the least, a very special thanks to all my friends here in Turkey for showing so much love and hospitality who never let me feel that I was away from home.
NX C
ix
Table of Contents
Abstract
Acknowledgements
List of Tables xii
List of Figures xii
List of Abbreviations xiv 1 Introduction 1 1.1 Overview……… 1
1.2 Literature Review………... 2
1.3 Thesis Contributio n……….………... 3
1.4 Thesis Outline ……….... 4
2 Cognitive Radios and Spectrum Sensing 6
2.1 Cognitive Radio ………. 7
2.1.1 Characteristics of Cognitive Radio ………... 7
2.1.2 Cognitive Radio’s Functions ………. 9
2.2 Approaches for the Sensing of Spectrum ………... 10
2.2.1 Sensing for Spectrum Opportunities……….. 11
2.2.2 Spectrum Sensing for Interference Detection ……… 11
2.3 Classification of Spectrum Sensing Techniques ……... 12
x
2.3.1.1 Matched Filter Detection ……… 13
2.3.1.2 Cyclostationary Feature Detection ………... 13
2.3.1.3 Energy Detection ……… 14
2.3.1.4 Limitations of Transmitter Detection ………. 15
2.3.2 Cooperative Detection ……… 16
2.4 Cognitive Radio Network Applications ………... 18
2.4.1 Cognitive Mesh Network ………. 18
2.4.2 Leased Network ……….... 18
2.4.3 Emergency Network ………. 19
2.4.4 Military Network ……….. 19
3 Combinational Cooperative Detection Method 20
3.1 Mathematical model……… 20
3.2 Implementation of CCD Method………..……... 22
3.3 Effect of Combination number (Q) on the performance of the CCD method ……….. 24
3.4 Effect of SU distribution (x / y) on the performance of the CCD method……….... 25
4 Performance of CCD Method Under Realistic Assumptions 27
4.1 Effect of Randomizing the SU locations ……… 27
4.2 The Effect of the distance between (A, B) on detection performance ……… 31
xi
5 Conclusions and Future Work 37
5.1 Conclusions ……… 37
5.2 Future Work ………...… 38
References 39
xii
List of Tables
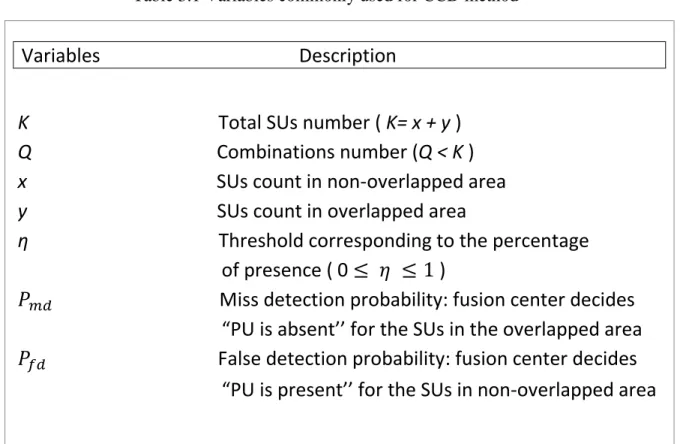
Table 3.1 Variables commonly used for CCD method ... 23
List of Figures
Figure 2.1 Dynamic changes in all layers……… 8Figure 2.2 Spectrum hole concept……… 9
Figure 2.3 Spectrum sensing techniques classification ... 12
Figure 2.4 Matched Filter Block Diagram ... 13
Figure 2.5 Cyclostationary Feature Detector Block Diagram ... 14
Figure 2.6 Energy Detector Block Diagram ... 15
Figure 2.7 Receiver Uncertainty and Multipath/Shadow Fading ... 17
Figure 2.8 Cooperative Spectrum Sensing Classification (a) Centralized, (b) Distributed... 18
Figure 3.1 The Locations of SUs and PU ... 22
Figure 3.2 Q’s effect on CCD method performance ... 24
xiii
Figure 4.1 Random vs AB and CD (x/y =2/4) ... 28
Figure 4.2 Random vs AB and CD (x/y =3/3) ... 29
Figure 4.3 Random vs AB and CD (x/y =4/2) ... 30
Figure 4.4 Effect of distance between A and B locations ... 31
Figure 4.5 Distance variations between A and B locations ... 32
Figure 4.6 CCD performance in different propagation environments for AB ... 33
Figure 4.7 CCD performance in different propagation environments for CD ... 34
Figure 4.8 CCD performance for different propagation environments for random x/y = 2/4 ... 35
Figure 4.9 CCD performance for different propagation environments for random x/y = 4/2 ... 36
xiv
List of Abbreviations
FCC ... Federal Communication Commission CR ... Cognitive Radio CCD ... Combinational Cooperative Detection SDR ... Software Defined Radio SU ... Secondary User PU ... Primary User FC ... Fusion Center
1
Chapter 1
Introduction
1.1 Overview
In this modern world of wireless communication systems, the demand of wireless applications is growing day by day, which has constrained the use of the radio spectrum available, which is a very rare and important resource. The policy of radio spectrum’s static allocation results in some part of the spectrum being underutilized. Also, the assignment of an exclusive license to every single user for the operation in a certain frequency band results in an inflexible spectrum management. It is hard to locate empty bands for allocating it to new users or for enhancing the service to the ones existing because of the already allocation of major part of the radio spectrum. In order to solve this issue, there is a need for better utilization of the spectrum by dynamic allocation of spectrum access [1-3].
The efficient utilization of the spectrum has become a major topic of interest because of wireless communication’s increased usage in personal, commercial and governmental activities. The usage of the spectrum and allocation of specific ranges to licensed users is governed by regulatory agencies worldwide. However, in the allocation, some spectrum ranges have become overcrowded, while some are under-utilized. The overall quality of service for the users in the allotment of overcrowded spectrum is reduced. As a result, reduced data transmission rates, low latencies and increased error probabilities have occurred.
A viable solution to this underutilization problem of the spectrum is Cognitive Radios (CR). The design of a CR facilitates the network’s users with highly reliable communication and more effective usage of the radio spectrum. Two major tasks are performed by cognitive radio, first one is the sensing of spectrum, which determines the spectrum parts that are not in use. The second one is the assignment of unoccupied
2 spectrum bands to the secondary users without causing any trouble to the primary user’s communication. By the dynamic allocation of the spectrum usage, future methods of operation of wireless communication can be changed very much using cognitive radios and in the end providing the users with a better quality of service [4].
1.2 Literature Review
An extensive range of literature on the technology of cognitive radio can be found to overcome the wastage of the unused spectrum with different sensing techniques that have evolved with time. There are many technical papers that explain in detail the different aspects of management of the spectrum including the sensing of the spectrum, decision of spectrum, sharing of the spectrum and mobility of spectrum. Most part of the literature that exists includes the detailed description of the spectrum sensing techniques and different detection methods and how they work. Among them, cooperative detection methods, which show improved performance through cooperation have been described in this thesis in detail.
In cooperative detection, the presence or the absence of a primary user’s decision is made by a fusion center with the help of the information received from each secondary user (SU) [5,6]. A new scheme of cooperative detection is proposed in [7] which provides an individual decision for each CR user against one common decision for all users. Different algorithms for the spectrum sensing in a cooperative setup based on machine learning are discussed in [8]. In [9], the algorithm of optimization for cooperative detection in a cognitive radio to improve the system performance is proposed. Different cooperative spectrum sensing techniques and the benefits of cooperation including the reduction in the interference and detection time and improvement in the agility gain are explained in [10]. A distributed cooperative detection scheme based on sequential detection algorithms is defined in [11] that uses the previous information of the CR users. In [12], a description of different fusion schemes in fusion center for cooperative sensing are given. A multichannel cooperative sensing scheme is proposed in [13] in which SUs have
3 heterogeneous sensing ability instead of homogeneous and improvement in performance is shown. The selection for the optimal number of CR users under different scenarios for an efficient cooperative sensing scheme is explained in [14]. It is proved in [15] that the throughput of the spectrum sensing is not always increased by an increase in the SUs number. For the highest throughput, the optimal number of users also depends on the sensing duration.
Among the methods of cooperative detection, the method of conventional cooperative detection and the evolvement of the combinational cooperative detection method are explained here, which are important models in this thesis. In the method of conventional cooperative detection, the information from all the SUs is collected and gathered by a fusion center, which then makes a decision of either a primary user (PU) is present or absent and passes this single decision made to all the SUs. The conventional cooperative detection approach ignores the SU’s locations, due to which a user situated far away from the primary user will have to remain quiet also. To overcome this issue, another method which was later called as the method of combinational cooperative detection (CCD) was proposed in [16]. That method of CCD worked on combining the received signals from multiple users, making the decision tables and giving a decision for each user individually rather than a collective decision. In spite of the promising results that the CCD method showed initially, the implementation of that method practically was still doubtful. This problem of the practical implementation was later addressed in [17] along with investigating the SU’s location and distribution’s effects on the performance of detection in terms of different parameters of the system. Note that the locations of the SUs were fixed in [17], where as in practice, SUs could be at different locations.
1.3 Thesis Contribution
Motivated by the work done in [17], where the CCD method’s practical implementation was explained in detail, some advancements have been carried out. In this thesis, cognitive radio networks, different spectrum sensing techniques, conventional and combinational
4 cooperative detection methods have been studied and analyzed in detail and some realistic performance considerations for the CCD method have been carried out. The SU’s random distribution’s effect on the CCD method’s performance of detection is investigated. By allocating the locations of the users randomly instead of fixed locations and comparing it to the previously obtained fixed location results in [17], the performances are obtained. Also, the CCD method’s performance for different propagation environments is obtained for comparison. In brief, this thesis investigates two main issues:
Effect of random locations on CCD method
Effect of different propagation environments on CCD method
1.4 Thesis Outline
This thesis is organized into five main chapters which are listed as below:
Chapter 1 provides the introduction including the literature overview of the previous studies done on the cooperative detection method and the contribution that this thesis provides. Also, the basic structure of this thesis is provided in this chapter.
Chapter 2 describes the cognitive radio network in detail with its structures and explains different spectrum sensing techniques and some related algorithms.
Chapter 3 is about the conventional and combinational cooperative detection methods and CCD method’s implementation with observing different system parameters effect on the performance of detection.
Chapter 4 presents the simulation results of the random locations of the SUs, the effect of distance variations between secondary users (SU) and primary user (PU) and the effect of different propagation environments.
5 Finally, chapter 5 presents the concluding remarks and results of the overall thesis work. Also, possible extensions of the work are suggested in this chapter.
6
Chapter 2
Cognitive Radios and Spectrum Sensing
Wireless communication has brought a revolution to our lives. Today's wireless devices offer more innovative services along with the data rates that are a lot higher. Different types of wireless services have the access to the licensed and unlicensed spectrum. The availability of the unlicensed band is becoming rare due to the increasing demand of the wireless communication services and their use around the world [18][19]. The licensed spectrum is allocated to some dedicated service while the unlicensed spectrum, also referred to as ISM band (i.e. Industrial, Scientific and Medical), can be accessed by all the wireless services and can also be availed for the research purposes. The availability of the bandwidth in the unlicensed spectrum is becoming rare too fast whereas on the other hand, for licensed spectrum major portion of the band goes underutilized. This is because of the implementation of spectrum allocation policy as static [20][21]. The Federal Communications Commission (FCC) report published in 2002 [22], also confirmed the fact that the utilization of the licensed band is very low whereas unlicensed bands are over utilized. The part of the licensed band that is not used is referred to as white space. The inefficient utilization of the spectrum is a result of the spectrum allocation policy being static, adopted by the governments worldwide. Dynamic spectrum access and allocation is the solution to this inefficient utilization problem. Encouraged by the FCC report statistics about the ineffective utilization of the spectrum, researchers looked towards the development of new spectrum sharing methods.
In wireless communication’s early days, fixed radios were used in which the operators used to fix and set up the transmitter parameters. Software Defined Radio (SDR) evolved in the new era of communication. SDR is a radio whose transmitter’s operating parameters can be altered by making a change just in the software and no any changes required in the hardware [23]. The use of SDR minimizes the hardware requirements by giving a reliable and cheaper solution to the user but it will not account for the availability of the spectrum.
7 SDR’s newer version is Cognitive Radio (CR), which operates like SDR with an addition of the change of parameters also according to the availability of the spectrum.
A revolution of new opportunities has been brought in the wireless communication by the use of SDR and CR technologies. The main motivation behind this technology is to maximize the spectrum usage and to optimize the resource use of the radio. Based on SDR, CR is looked for as a viable solution for many of the wireless communication problems such as under-utilization of the spectrum, geo-location and networking applications [24][25].
2.1 Cognitive Radio
Cognitive Radio [26], in recent times, has been receiving great attention in search of better technology for the management of spectrum. Joseph Mitola named the technology as “Cognitive Radio’’, to explain the devices that had the ability to sense their environment and after sensing, based on the observations it received, it can then make a decision on how to act without any interference to primary users.
Cognitive radios are intelligent enough to sense its environment for some changes and based on those changes it can then change the different operating parameters like frequency, power, coding techniques, modulation techniques etc. which makes the utilization of the available resources efficient.
2.1.1 Characteristics of Cognitive Radios
The frequency of operation and the transmission parameters in a cognitive radio are adjusted dynamically. Cognitive radio’s main characteristics are as follows:
8 Cognitive Capability
Sensing of information from its surrounding and making the required parameters changed by a CR, is known as the Cognitive capability. The characteristic of cognitive capability includes three main tasks. The task of sensing of the spectrum is to monitor and find the spectrum holes. Spectrum analysis will be then used to determine the characteristics of the spectrum found unused. In spectrum decision, a decision is taken for the selection of the best spectrum by the determination of the parameters like data rate, transmission mode etc.
Re-configurability
CR’s ability to make the changes to its parameters without the need of making any changes to the components of its hardware, is referred to as Re-configurability. By doing so, all the layers of communication are changed dynamically as shown in Figure 2.1. Different technologies can be used with the same hardware depending on the availability of their spectrum.
9 2.1.2 Cognitive Radio’s Functions
Cognitive Radio’s functions are described as below:
Sensing of Spectrum
CR’s major goal is to sense and locate the best spectrum opportunity for the user. Considering the fact of the shortage of spectrum, sharing the spectrum that is licensed without creating any interference to the transmission of the primary user is a big challenge, as Figure 2.2 illustrates. The use of the spectrum that is not being utilized temporarily, known as spectrum hole or white space [27], is enabled by the cognitive radios. In the case of a primary user willing to use the spectrum, the CR has to look for some other spectrum hole or by avoiding the interference to the primary user, it can remain in the same band.
10 Management of Spectrum
The selection of the best spectrum opportunity that is available keeping into consideration the user and QoS needs, is called spectrum management [28]. Spectrum management is cognitive radio's main function because it selects the best spectrum that can be used for the SUs.
Mobility of Spectrum
Mobility of spectrum is the frequency changing process of cognitive user from one to another frequency. The frequency is changed by the cognitive user because of either the detection of primary user on same spectrum or the availability of some other spectrum that is better than the current one. The frequency transition process is carried out seamlessly by the cognitive radio because of its dynamic spectrum access working policy [28].
Sharing of Spectrum
Spectrum scheduling by a Cognitive radio is referred to as Spectrum sharing [28]. The efficient utilization and sharing of the used licensed spectrum by cognitive radio users is enabled by the spectrum sharing. Among the major challenges of open spectrum access, spectrum sharing is also included.
2.2 Approaches for the Sensing of Spectrum
The techniques of spectrum sensing can be categorized into two approaches as the frequency domain and time domain. In the method of frequency domain, the estimation of the signal is carried out directly in the frequency domain, hence it is also called as direct method. In time domain method, signal’s autocorrelation is used for performing the
11 estimation. Depending on the need of spectrum sensing, it can be classified in other ways as below [29]:
2.2.1 Sensing for Spectrum Opportunities
There are two main approaches:
(i) Detection of primary user: In this approach, the signal received at the CR users, makes a decision on whether a PU is present or absent. This approach is also called as non-cooperative detection. The sub-methods of detection based on matched filter, detection based on energy, detection based on cyclostationary and the detection based on radio identification are included in this approach. (ii) Cooperative or collaborative detection: In this approach, the combination of
multiple cognitive radio user’s information makes the decision of primary user’s presence or absence. This approach includes either the distributed approach or an approach of giving the control of the access to a central server.
2.2.2 Spectrum Sensing for Interference Detection
The approaches for this method are:
(i) Interference temperature detection: The secondary users with lower power level as compared to the power level of a primary user are given the way to transmit and are bounded by the level of interference temperature to avoid the interference with a PU.
(ii) Detection of a primary receiver: In this method, the detection of the opportunities of spectrum and of interference is done that is based on the leakage power of the primary receiver’s local oscillator.
12 2.3 Classification of Spectrum Sensing Techniques
Figure 2.3 Spectrum sensing techniques classification
2.3.1 Non-cooperative Detection (Transmitter Detection)
In transmitter detection, the PU’s detection must be carried out independently by each CR in a specified spectrum. In [30]-[33], a hypothesized model is defined for the detection of a transmitter that says that the signal detected by the SU is:
𝐻₀ ∶ 𝑦 (𝑡) = 𝑤 (𝑡)
𝐻₁ ∶ 𝑦 (𝑡) = ℎ. 𝑥 (𝑡) + 𝑤 (𝑡) (2.1) where hypothesis 𝐻₀ represents “no signal transmitted” and the hypothesis 𝐻₁ represents “signal transmitted”, 𝑦 (𝑡) represents signal received, 𝑥 (𝑡) represents signal transmitted, 𝑤 (𝑡) represents Additive White Gaussian Noise (AWGN) with zero mean and variance 𝜎𝑛2, and ℎ represents the channel gain amplitude (channel coefficient).
13 There are many transmitter detection techniques but three of them are generally used which are Matched Filter Detection, Energy Detection and Cyclostationary Feature Detection [30]-[33].
2.3.1.1 Matched Filter Detection
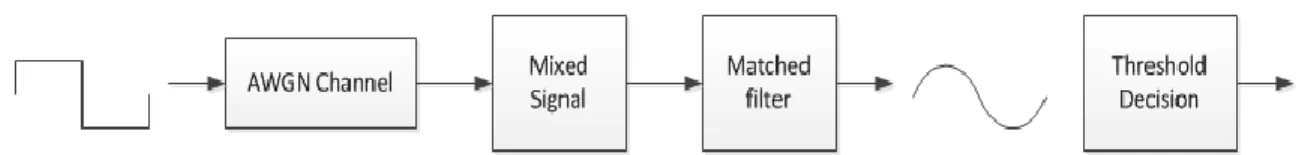
The matched filter detector (also referred to as coherent detector) was initially proposed in [34]. It can be considered as the best sensing technique if CR has a prior knowledge of the waveform of PU. This technique is also very accurate as the signal to noise ratio (SNR) received by it is increased. Figure 2.4 shows the matched filter’s block diagram. The signal that a CR receives, it feds that signal to the input of the matched filter which will be r (t) = s (t) + n (t). After that r (t) is convolved with h (t) where h (t) = s (T-t + τ). Finally, a comparison between the matched filter output and a threshold λ is made to decide the primary user’s status.
Figure 2.4 Matched Filter Block Diagram
The detection of a PU is difficult in the absence of prior information of PU’s waveform. The use of matched filter gives the advantage of a high processing gain in less time. The requirement of a specific receiver by CR for separate primary user class [35], gives it as a major drawback.
2.3.1.2 Cyclostationary Feature Detection
The cyclostationary feature detector’s implementation was first presented in [35], as sensing of spectrum having the ability to separate out the modulated signal from the additive noise. For cyclostationary, a signal’s mean and autocorrelation has to be a
14 periodic function. The extraction of the received signal’s features and then based on those extracted features carrying out the detection is said to be a feature detection. A PU signal can be distinguished from noise by cyclostationary feature detection and it can be used at very low SNR by the use of the information included in the signal of a PU.
Figure 2.5 Cyclostationary Feature Detector Block Diagram
Figure 2.5 shows the block diagram of a cyclostationary feature detector with the implementation of spectrum correlation function for it. The number of signals, their modulation types, symbol rates and interferer’s presence are the features detected by cyclostationary feature detector. A primary user is detected in a radio environment if the factor of correlation factor exceeds the threshold. Although, cyclostationary feature detection showed an improved performance than energy detection because of its ability of separating out the signal and noise power, computationally it is very complex because of long delays in processing time, which in result worsens the performance of CR.
2.3.1.3 Energy Detection
Energy detection is the signal detection technique that detects the absence or the presence of a PU by the use of an energy detector. This detection method is also known as non-coherent detection. This method of spectrum sensing is very common because of the computational complexities being moderate and the implementation of it in both frequency and time domain. Energy detector is required to sense the noise power in order to adjust the detection threshold. Unlike the matched filter and cyclostationary feature detection, priori PU’s information is not required by energy detection, which is hard to achieve. Energy detection technique is adopted widely because it is simple to implement, though it is not optimal.
15 Figure 2.6 Energy Detector Block Diagram
Figure 2.6 shows the energy detector proposed in [36]. The center frequency fs and bandwidth of interest W is selected by the input band pass filter. A squaring device follows the filter which measures the energy received, then the observation interval T is determined by the integrator. The integrator Y’s output is then finally compared with a threshold of detection λ to decide on the status of a PU.
The inability of the energy detection method to differentiate between the signal and noise power is its major drawback.
2.3.1.4 Limitations of Transmitter Detection
Receiver uncertainty and shadowing problem, are the two limitations of transmitter detection. In transmitter detection CR users only possess information about the transmitter of the PU and not of receiver of the PU. Hence, the way to identify the PU receiver by CR is only through the transmission of weak signals. This is called as receiver uncertainty problem. Moreover, the usability of the transmitter detection is limited by the hidden node problem. The other problem that limits the transmitter detection is of shadowing that prevents the transmitter of the CR to detect the transmitter of PU. Therefore, collaborative approaches are needed.
16 2.3.2 Cooperative Detection (Receiver Detection)
Ghasemi and Sousain [36], first proposed a collaborative spectrum sensing method. The cooperative sensing of the spectrum for CR happens when a collection or group of cognitive radios share the same detection information of the PU. Cooperative detection provides a far better sensing of the spectrum over the location area of the CRs. The ability of a cooperative detection to improve the spectrum sensing performance especially in the scenarios of fading, shadowing and noise uncertainty [37][38], plays an important role in the CR research.
Figure 2.7 illustrates multipath fading, shadowing and receiver’s uncertainty. The placement of CR1 and CR2 is inside the range of PU transmitter’s transmission while CR3 exceeds its range. The detection of a PU may not be obtained correctly because of the effect of multipath and shadow fading on CR2. More than that, the existence of the PU outside its range and no knowledge of the PU’s transmission creates the problem of receiver uncertainty for CR3. As a result, there may be an interference between the CR3 transmission and the reception at PU receiver. The individual observations deficiency at each CR user [30][31], can be compensated with the sharing of the sensing results by the CR users with other users.
17 Figure 2.7 Receiver Uncertainty and Multipath/Shadow Fading
Cooperative spectrum sensing is broadly categorized into two categories [31][39]: Centralized approach: In the centralized approach of cooperative sensing, a central point called the fusion center (FC) is assigned the task of collecting the sensed information from all the CRs within the network. The information is delivered between each CR and the FC by the means of a physical point to point link called a reporting channel as shown in Figure 2.8(a). In the last, a FC after analyzing decides on which spectrum band can be allocated and which cannot. Distributed approach: In the distributed approach of cooperative sensing, the cooperative decision is not dependent on a single central point. The sensed information of each CR is send to other CRs, each CR after combining the received and its own information makes the decision of the presence or absence of a PU individually shown in Figure 2.8(b). For this approach, the CRs will be required to possess a very level of independence and also the ability to set themselves up as an ad-hoc network.
18 Figure 2.8 Cooperative Spectrum Sensing Classification (a) Centralized, (b) Distributed
2.4 Cognitive Radio Network Applications
The applications of a cognitive radio network can include the following cases:
2.4.1 Cognitive Mesh Network
The broadband connectivity is provided by wireless mesh networks which has emerged as a cost-effective technology [40]. However, the requirement of the capacity by the mesh networks is greater to meet the higher throughput demand of the applications. Because a cognitive radio can provide an access to a large amount of spectrum, hence, it will be a good choice to fulfill the mesh network requirements.
2.4.2 Leased Network
A leased network theory is proposed in [41], which states that a PU can lend its licensed spectrum to the CR user for the communication in an opportunistic manner such that the PU’s communication is not affected.
19 2.4.3 Emergency Network
For the public safety and emergency networks [42], the use of the implementation of the cognitive radio networks can be considered. CR users can access the unused part of the licensed spectrum, in the case of any natural disaster. Without any need to set up an infrastructure, the CR networks can communicate in an ad-hoc mode on spectrum available.
2.4.4 Military Network
CR networks can also be applied in military radio environment, as proposed in [43]. By the use of CR networks, adjusting to the changing radio environment of battlefield, the changes in the intermediate frequency (IF) bandwidth, modulation and coding schemes of the military radios can be enabled.
20
Chapter 3
Combinational Cooperative Detection Method
In CR networks, a PU’s detection is generally done by the method of cooperative detection. The conventional method of cooperative detection is the one used to detect a PU. The decision in it is made by a fusion center of whether a PU is present or absent. The operation of a fusion center was based on gathering the sensing information from all the SUs and then conveying a single decision, which had to be followed by all the SUs. There was one major problem with the conventional method that it did not take the locations of the SUs into account. Due to this problem, a SU situated away from the PU also had to remain silent in spite of being away from the interfering area of PU.
To overcome this problem, an improved method was proposed known as Combinational cooperative detection (CCD) method [16]. The way of operation of this method was to collect and combine the signal energies received from multiple SUs, store the results for different combinations of the SUs and making individual decision for each SU rather than a collective decision. Although this method of CCD showed improved and promising results than the conventional method, there were still some unclear issues regarding its practical implementation. These issues were later addressed in [17], from the point of view of a realistic implementation.
3.1 Mathematical Model
The signal energy received by the k-th SU in [17], is given by
𝑌𝑘 = { ∑𝐿 |𝑛𝑘,𝑙|2 𝑙=1 , 𝐻0 ∑𝐿 |𝑠𝑘,𝑙 𝑙=1 + 𝑛𝑘,𝑙|2 , 𝐻1 (1)
21 where 𝑠𝑘,𝑙 and 𝑛𝑘,𝑙 represent the signal energy received and the AWGN (Additive white Gaussian noise) with variance 𝜎𝑛2, for the k-th SU, respectively. This signal energy of the k-th SU is then passed to the fusion center. The fusion center receives the instantaneous SNR (𝛾𝑘) from the k-th SU [17], which is given by
𝛾
𝑘= 𝑃𝑇𝑋 𝜎𝑛2 𝑑𝑃𝑈,𝑘2 𝑑𝑀,𝑘2(2)
where 𝑃𝑇𝑋 is the power of the transmitted signal by PU, 𝑑𝑃𝑈,𝑘2 and 𝑑𝑀,𝑘2 represent the distances between PU and the k-th SU and between M and k-th SU, respectively. The combined signal from the fusion center for each SU depends on the combination of Q different SUs [17] and is given by
𝑍
𝑢 = 1𝑄
∑
𝑘∈𝑊𝑢𝑌
𝑘, u = 1,…,U.
(3)The combination output (𝑍𝑢) for each SU is obtained for different combinations of the SUs and is stored in a combination table. All the combination output values are then compared with a value of threshold of detection (𝜆) to confirm the status of a PU. After the comparison, the resulting values 1 and 0, representing the presence and absence of a PU, respectively, are stored in an availability table created. In the availability table, a SU is represented by each column of it. For each SU, the total number of decisions is given by (𝐾−1𝑄−1).
The total number of decisions representing the presence of a PU is given by 𝑚𝑘. M and 𝑚𝑘, are then compared to decide that which SU should be given the access of spectrum. The SU for which a fusion center gives the decision of the presence of PU, that SU will be bound to remain silent and in the case of absence of PU, SU will be allowed to communicate. M is given as
22 M = η x (𝐾−1𝑄−1) , 0 ≤ 𝜂 ≤ 1 (4) where η represents the threshold that corresponds to the presence percentage required for making a decision.
For the evaluation of performance of the system, the error probabilities of miss detection (𝑃𝑚𝑑) and false detection are defined (𝑃𝑓𝑑). The definition of these error probabilities in the case of an assumption that a PU is present all the time can be given as:
Miss detection probability (𝑃𝑚𝑑): The error probability of fusion center making a decision of “PU is absent” for the SUs located in an overlapped area of communication.
False detection probability (𝑃𝑓𝑑): The error probability of fusion center making a decision of “PU is present” for the SUs in non-overlapped area of communication.
Further details of the mathematical model can be found in [17].
3.2 Implementation of CCD Method
23 Figure 3.1 depicts the locations of the SUs and PU [44]. The variables M and PU, respectively, denote the fusion center (i.e., Master) and the primary user. A, B, C and D represents the fixed SU’s locations. The communication area of the SUs is divided into two parts, overlapping and overlapping area. The number of SUs in the non-overlapping can be represented by x and in the non-overlapping area by y. The total number of SUs in the whole communication area will then be, x + y = K users. SUs at A and C locations are in the non-overlapping area, hence they are allowed to communicate without creating any interference to PU. SUs at B and D locations are situated in an overlapped area, therefore they are not allowed to communicate in the presence of a PU to avoid the interference. The selection of the fixed A, B, C and D locations is done near the border of the communication areas and they serve as the benchmark performance for the best (AB) and worst (CD) performance evaluations of the CCD method. This was the limitation of a realistic performance for the CCD method in [17]. In Table 3.1, variables commonly used for CCD method are provided.
Table 3.1 Variables commonly used for CCD method
Variables Description
K Total SUs number ( K= x + y )
Q Combinations number (Q < K )
x SUs count in non-overlapped area
y SUs count in overlapped area
η Threshold corresponding to the percentage
of presence ( 0 ≤ 𝜂 ≤ 1 )
𝑃
𝑚𝑑Miss detection probability: fusion center decides
“PU is absent’’ for the SUs in the overlapped area
𝑃
𝑓𝑑False detection probability: fusion center decides
“PU is present’’ for the SUs in non-overlapped area
24 Before evaluating the realistic performance of the CCD method including randomized locations, distance between A and B locations and propagation environments, the simulation results for the effect of the system parameters of Q and x / y on the CCD method in [17] are reproduced but for new set of parameters. The total number of SUs in this work have been considered to be K = 6.
3.3 Effect of Combination number (Q) on the performance of CCD method
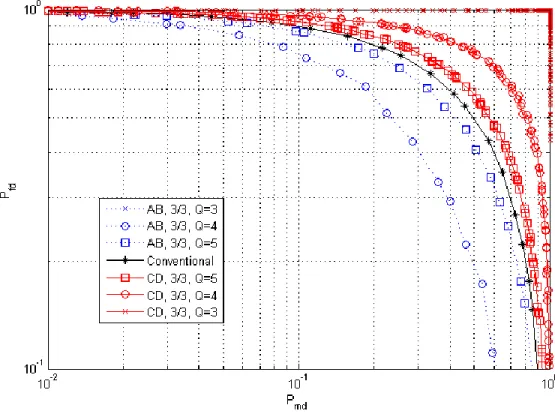
Figure 3.2 Q’s effect on CCD method performance
The performance results of the effect of combination number (Q) on AB and CD locations when η = 1 and x/y = 3/3 are shown in Figure 3.2.
From the performance results, it can be observed that with the decreasing value of Q, the error probabilities for the SUs at AB location are decreased. On the other hand, for the
25 SUs at CD location, the error probabilities are increased with the decreasing value of Q. Since the locations C and D are very close to each other, hence the magnitudes of the received signals from them by the fusion center will be similar. Hence, increasing the value of Q will not decrease the error probabilities than the conventional method’s error probabilities. For A and B locations, since they are far from each other, received signal’s magnitude from them would be different. Hence, for a greater value of Q than x, signals with different magnitude will be combined. Therefore, for the location AB, the smaller Q value is preferred for an improved performance. These results were also obtained in [17] and are confirmed here.
3.4 Effect of SU distribution (x / y) on the performance of CCD method
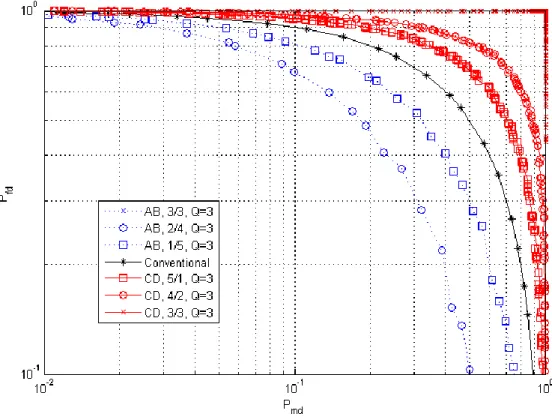
Figure 3.3 x/y effect on CCD method performance
The performance results of the effect of SU distribution (x/y) on AB and CD locations when η = 1 and Q = 3 are shown in Figure 3.3.
26 From the results, it can be seen that regardless of the SUs distribution, the error probabilities for the SUs at CD location are always higher and for the SUs at AB location are always lower than the error probabilities for the conventional method of cooperative detection. The error probabilities have become smaller with the increasing SUs number in the non-overlapping area (x). With the increase of x, for CD locations, the error probabilities approach the performance of conventional method of cooperative detection whereas, for AB locations, the error probabilities of error within a threshold interval are 𝑃𝑓𝑑 = 𝑃𝑚𝑑 = 0, when the value of x becomes equal to or increases than the combination number (x ≥ Q). These results were also obtained in [17] and are confirmed here.
Next, more realistic assumptions are considered to study the performance of the CCD method.
27
Chapter 4
Performance of CCD Method Under Realistic Assumptions
Considering the limited results provided in [17], more realistic approaches for the performance considerations of the CCD method are provided in this chapter. Initially, the locations of the SUs are assigned randomly and its effect on the performance of the CCD method’s detection is observed. The comparison is made between the performance for random locations and the performance for the fixed locations to determine the conditions where better detection performances are obtained compared to the conventional approach. Also, the distance between SUs and PU is changed to investigate how it affects the system performance. Furthermore, in [17], only the free space propagation environment is considered for the communication. However, in this chapter different propagation environments including indoor LOS and sub-urban propagation environment are tested. For the simulation results obtained in this chapter, the combination number Q = 3 and the threshold of correspondence η = 1 are kept constant.
4.1 Effect of Randomizing the SU locations
In the previous work done on CCD method, the SU locations were fixed at dedicated AB and CD locations, where they served as the best and worst CCD performances, respectively. In this thesis, the SUs are moved from fixed to random locations, to check that how it affects the CCD method performance in comparison to the fixed locations. After evaluating the average performances of the random locations, they are then compared with the performances at AB and CD locations.
28 Figure 4.1 Random vs AB and CD (x/y = 2/4)
Figure 4.1 shows the curve of the average random distribution of SUs x/y = 2/4 in comparison to the AB location and the conventional method of cooperative detection. The error probabilities are maximum for the CD locations because of the condition (x ≤ Q) as explained before. The performance curve of the random locations of the SUs is worse than the AB location but better than conventional performance.
29 Figure 4.2 Random vs AB and CD (x/y = 3/3)
The performance curve of the average random SU locations for x/y= 3/3 is shown in comparison to the AB and CD locations in Figure 4.2. The curve for AB is minimum since x ≥Q implies Pfd = Pmd = 0. It can be seen that the probabilities of error for the random locations of the SUs lies in between the error probabilities for AB and CD locations and also it is better than the conventional method performance.
30 Figure 4.3 Random vs AB and CD (x/y = 4/2)
The result of the average random locations of the SUs for x/y = 4/2 in comparison to the conventional method performance and CD location can be seen in Figure 4.3. Since x ≥ Q, the error probabilities for AB is minimum. The performance curve of the average random locations lies in between the conventional method of cooperative detection performance and the CD locations performance. Here the random locations performance worsens than the conventional performance but is better than CD.
31 4.2 The Effect of the distance between (A, B) on detection performance
Figure 4.4 Effect of distance between A and B locations
In Figure 4.4, the effect of increasing and decreasing distances between the SU locations AB is examined when x/y = 2/4. From the graph it can be observed that as the distance between A and B is increased and moved further close to the border points, the error probabilities for the SUs becomes smaller. On the other hand, when the distance between A and B is decreased and they are brought nearer to each other, the error probabilities for the SUs at those locations increases.
32 Figure 4.5 Distance variations between A and B locations
The CCD method detection performance for the SUs at different A and B locations is further examined in Figure 4.5. Initially, the performance curve is obtained for A= [1 6] and B= [11 6]. The B location is then set at B= [10 6] and the location of A is moved towards B. It can be seen that with decreasing distance between A and B, the error probabilities increases. When A reaches to [3.40 6] location, the error probabilities exceeds the conventional method and the performance worsens than the performance of conventional method.
4.3 Propagation Environments and its Effects
As a part of this thesis work, different propagation environments are examined and the effect that they have on the CCD method’s performance of detection is investigated for a few environments.
33 The initial performance that we had for the CCD method was obtained in a free space propagation environment having a path loss exponent 2. Now, the performance is considered for two other environments and then compared to the initial performance of free space environment.
Figure 4.6 CCD performance in different propagation environments for AB
Figure 4.6 shows the resulting performance curves of the indoor LOS environment having path loss exponent 1.6 and sub-urban environment with path loss exponent 3 for the AB location. It can be seen that we get a better performance for the indoor LOS environment than the free space performance. The sub-urban’s environment performance gets worse than the free space environment’s performance for AB locations.
34 Figure 4.7 CCD performance in different propagation environments for CD
The results for the indoor LOS and sub-urban environment in comparison to the free space environment for CD locations can be viewed in Figure 4.7. From the resulting curves, it is observed that the CCD method’s performance of detection improves for the indoor LOS environment having path loss exponent 1.6 and decreases for the sub-urban environment with path loss exponent 3 as compared to the free space environment for the SUs at location CD. However, it should be noted that the performance losses are incremental.
Along with investigating the different propagation environment’s effect on the SUs detection performance at dedicated AB and CD locations, also the change in the performances of the SUs situated at random locations due to different propagation environment are considered.
35 Figure 4.8 CCD Performance for different propagation environments for random x/y =
2/4
Figure 4.8 shows the performance comparison of the random SU locations for x/y = 2/4 under different propagation environments. The resulting performance shows the same trend for the fixed locations. That is the performance improves for the indoor LOS path loss model having the path loss exponent 1.6 than the free space model with path loss exponent 2. On the other hand, the performance for the sub-urban environment with path loss exponent 3 decreases than the free space model and also worsens than the conventional detection performance in free space.
36 Figure 4.9 CCD performance for different propagation environments for random x/y =
4/2
Finally, in Figure 4.9, we can see the comparison between curves representing the performance of the CCD method for free space, indoor LOS and sub-urban path loss models for random x/y = 4/2. A similar trend as in Figure 4.8 is observed with overall reduced performance due to x/y distribution.
37
Chapter 5
Conclusions and Future Work
5.1 Conclusions
In this thesis, the CCD method is undergone some realistic performance considerations. For earlier CCD method implementation, the performance was checked for the fixed locations of the SUs at border points of the communication areas. In this work, the locations of the SUs are moved from fixed to random locations and then their performance is compared with the earlier obtained results for the dedicated AB and CD locations in [17]. Also, the effect that the distance variations between AB causes on the performance of the CCD method along with the distance variations between M and PU is examined. In the end, the effect of different propagation models on the CCD method is investigated and their performances are compared with each other.
In general, the remarks that can be concluded from the study in this thesis are stated as follows:
The performance curves of the average random locations of the SUs always lies in between the AB and CD performance curves, which serve as the best and worst performances, respectively.
The performance of detection of the random SU locations tends to decrease with the increasing SUs number in the non-overlapping area (x).
When x ≥ Q, the average random SU locations performance exceeds the performance of the conventional method of cooperative detection.
When the distance between AB locations is increased, the CCD method’s performance tends to improve. On the contrary, when the distance is decreased between AB locations, the performance worsens.
The assessment of the effect of different propagation environments on the method of CCD shows that the performance for the indoor LOS environment is better than
38 the free space environment whereas for the sub-urban environment, the performance is worse than the free space performance for AB and CD locations. The same trend is observed for the random SU locations as for the fixed AB and
CD locations for different propagation environments.
5.2 Future Work
In the future work for the CCD method, the effects of the realistic path loss models such as Hata-Okumura model on the CCD method’s detection performance can be carried out. Also, in this thesis, a single hop topology was used between the CRs for the communication. That can be extended to the implementation of a mesh topology for improving the performance of the system.
39
References
1. Shahzad A. et. al. (2010), “Comparative Analysis of Primary Transmitter Detection Based Spectrum Sensing Techniques in Cognitive Radio Systems,’’ Australian Journal of Basic and Applied Sciences, 4(9), pp: 4522-4531, INSInet Publication.
2. Weifang Wang (2009), “Spectrum Sensing for Cognitive Radio’’, Third International Symposium on Intelligent Information Technology Application Workshops, pp: 410-412.
3. V. Stoianovici, V. Popescu, M. Murroni (2008), “A Survey on spectrum sensing techniques in cognitive radio” Bulletin of the Transilvania University of Brasov, Vol. 15 (50).
4. Scott Parsons, (2014)” Literature Review of Cognitive Radio Spectrum Sensing” EE 359 Project, Stanford University.
5. Yucek, T., & Arslan, H. (2009). A survey of spectrum sensing algorithms for cognitive radio applications. IEEE Communications on Surveys & Tutorials, 11(1), 116–130.
6. Liu, X.,&Tan,X. (2012).Optimization algorithm of periodical cooperative spectrum sensing in cognitive radio. International Journal of Communication Systems. doi:10.1002/dac.2377.
7. M. Fujii, H. Hatano and Y. Watanabe, "A study on cooperative detection scheme based on combination for cognitive radio systems," 2013 IEEE International Conference on Ultra-Wideband (ICUWB), Sydney, NSW, 2013, pp. 136-141.
40 8. V. Balaji, Pranav Kabra , Saieesh , C. Hota, G. Raghurama, "Cooperative Spectrum Sensing in Cognitive Radios using Perceptron Learning for IEEE 802.22 WRAN" publisheed in 11th International Conference on Communication Networks, ICCN 2015, Bangalore, India.
9. X. Tan, X. Liu and A. A. Anghuwo, "Optimization algorithm for cooperative detection in cognitive radio," 2012 IEEE Wireless Communications and Networking Conference (WCNC), Shanghai, 2012, pp. 2774-2779.
10. Y. Zhang, W. D. Yang and Y. M. Cai, "Cooperative Spectrum Sensing Technique," 2007 International Conference on Wireless Communications, Networking and Mobile Computing, Shanghai, 2007, pp. 1167-1170.
11. Sharma, Vinod; Jayaprakasam, ArunKumar, "An Efficient Algorithm for Cooperative Spectrum Sensing in Cognitive Radio Network" arXiv:0809.2931
12. D. Teguig, B. Scheers and V. Le Nir, "Data fusion schemes for cooperative spectrum sensing in cognitive radio networks," Communications and Information Systems Conference (MCC), 2012 Military, Gdansk, 2012, pp. 1-7.
13. Ge, W., Ji, H., & Li, X. (2013). Multichannel cooperative sensing for cognitive radio with users owning heterogeneous sensing ability. International Journal of Communication Systems. doi:10.1002/dac.2583.
14. S. Maleki, S. P. Chepuri and G. Leus, "Energy and throughput efficient strategies for cooperative spectrum sensing in cognitive radios," 2011 IEEE 12th
41 International Workshop on Signal Processing Advances in Wireless Communications, San Francisco, CA, 2011, pp. 71-75.
15. Choi, Y.-J., Pak, W., Xin, Y., & Rangarajan, S. (2012). Throughput analysis of cooperative spectrum sensing in Rayleigh-faded cognitive radio systems. IET Communications, 6, 1104–1110.
16. Hozumi, T., Fujii, M., & Watanabe, Y. (2011). A study on cooperative interference detection for UWB systems. In IEEE ICUWB 2011 (pp. 49–53).
17. Catak, E. & Erkucuk, S. (2015). Practical implementation of the combinational cooperative detection method. Wireless Pers Commun (2015) 80: 723-738
18. Piazza, D., P. Cosman, L.B. Milstein and G. Tartara, 2009. A Resource Allocation Algorithm for Real-Time Streaming in Cognitive Networks. In the proceedings of Wireless Communications and Networking Conference, pp: 1-5.
19. Yau, K.-L.A, P. Komisarczuk and P.D. Teal, 2009. Cognitive Radio-based Wireless Sensor Networks: Conceptual Design and Open Issues. In the proceedings of 2009 IEEE 34th conference on Local Computer Network, pp: 955-962.
20. Krishna, T.V. and A. Das, 2009. A Survey on MAC Protocols in OSA Networks. J. of Computer Networks., 53 (9): 1377- 1394.
21. Hossian, M., A. Mahmood, and R. Jantti, 2009. Channel ranking algorithms for cognitive coexistence of IEEE 802.15.4. In the proceedings of 2009 IEEE 20th International Symposium on Personal, Indoor and Mobile Radio Communications, pp: 112-116.
42 22. Marcus, M., C.J. Burtle, B. Franca, A. Lahjouji and N. McNeil, 2002. Federal Communications Commission (FCC): Spectrum Policy Task Force. ET Docket no. 02-135.
23. ET Docket No. 03-222 Notice of proposed rule making and order, December 2003.
24. FCC, Spectrum Policy Task Force Report, ET Docket No. 02-155, Nov 02, 2002
25. J. Polson, "Cognitive radio applications in software defined radio," Proc. SDR Forum 2004, Scottsdale, USA, 2004
26. J. Mitola, “Cognitive Radio: An Integrated Agent Architecture for Software Defined Radio,” Ph.D. dissertation, KTH Royal Institute of Technology, 2000
27. S. Haykin, Cognitive radio: brain-empowered wireless communications, IEEE Journal on Selected Areas in Communications 23 (2) (2005) 201–220.
28. Bhattacharya, P.P., R. Khandelwal, R. Gera, A. Agarwal, 2011. Smart Radio Spectrum Management for Cognitive Radio. Intl. J. of Distributed and Parallel Systems (IJDPS)., 2 (4): 12-24.
29. Bruce A. Fette, “Cognitive Radio Technology’’,Newnes Publisher,2006. 30. I. F. Akyildiz, Won-Yeol Lee, M. C. Vuran, and Sh. Mohanty, “NeXt
generation/dynamic spectrum access/cognitive radio wireless networks: A survey,” Computer Networks, vol. 50, no. 13, pp. 2127-2159,2006. Elsevier DOI: 10.1016/j.comnet.2006.05.001
31. Authors: I.F. Akyildiz, B.F. Lo, and R. Balakrishnan, “Cooperative spectrum sensing in cognitive radio networks: A survey,” Physical Communication, vol. 4 no. 1 pp. 40-62, 2011. Elsevier DOI: 10.1016/j.phycom.2011.12.003
43 32. A. Garhwal, and P. P. Bhattacharya “A Survey on Dynamic Spectrum Access Techniques for Cognitive Radio,” International Journal of Next-Generation Networks, vol. 3, no. 4, pp. 15-32, 2012.
33. S. Ziafat, W. Ejaz, and H. Jamal, “Spectrum sensing techniques for cognitive radio networks: Performance analysis,” 2011 IEEE MTT-S International Microwave Workshop Series on Intelligent Radio for Future Personal Terminals, pp. 1-4, 2011. IEEE DOI: 10.1109/IMWS2.2011.6027191.
34. A. Sahai, N. Hoven, and R. Tandra, “Some fundamental limits in cognitive radio,” in Proceedings of the Allerton Conference on Communication, Control, and Computing, Monticello, Ill, USA, 2004.
35. D. Cabric, S. M. Mishra, and R. W. Brodersen, ”Implementation Issues in Spectrum Sensing for Cognitive Radios”,in Proc. 38th Asilomar Conference on Signals, Systems and Computers, pp. 772776, Nov. 2004.
36. A. Ghasemi and E. S. Sousa,”Collaborative Spectrum Sensing for Opportunistic Access in Fading Environment”, in Proc. IEEE DySPAN, pp. 131-136, Nov. 2005.
37. J. Unnikrishnan, and V. Veeravalli “Cooperative sensing for primary detection in cognitive radio,” IEEE Journal on Selected Areas in Signal Processing, vol. 2, no. 1, pp. 18-27, 2008.
38. Y. Chen, Q. Zhao, and A. Swami “Distributed spectrum sensing and access in cognitive radio networks with energy constraint,” IEEE Transactions on Signal Processing, vol. 57, no. 2, pp. 783-797, 2009.
39. N. Noorshams, M. Malboubi, and A. Bahai, “Centralized and decentralized cooperative spectrum sensing in cognitive radio networks: A novel approach,” 2010 IEEE 11th International Workshop on Signal Processing Advances in
44 Wireless Communications (SPAWC), pp. 1-5, 2010. IEEE DOI: 10.1109/SPAWC.2010.5670998
40. I.F. Akyildiz, X. Wang, W. Wang, Wireless mesh networks: a survey, Computer Networks Journal 47 (4) (2005) 445–487.
41. J.A. Stine, Spectrum management: the killer application of ad hoc and mesh networking, in: Proc. IEEE DySPAN 2005, November 2005, pp. 184–193. 42. D. Maldonado, B. Lie, A. Hugine, T.W. Rondeau, C.W. Bostian, Cognitive radio
applications to dynamic spectrum allocation, in: Proc. IEEE DySPAN 2005, November 2005, pp. 597–600.
43. R. Murty, Software-defined reconfigurability radios: smart, agile, cognitive, and interoperable, Technology@Intel Magazine, July 2003.
44. Catak, E., & Erkucuk, S. (2012). The effect of secondary user locations on the cooperative detection performance. In IEEE SIU 2012 (pp. 1–4).
45
Curriculum Vitae
Rameez Ahmed was born on October 22nd, 1989, in Hyderabad, Pakistan. He received his BE in Telecommunication Engineering in 2013 from Mehran University of Engineering and Technology, Jamshoro, Pakistan. After which he completed his M.Sc. in Electronics Engineering from the Graduate School of Science and Engineering at Kadir Has University, Istanbul, Turkey.

![Figure 2.2 Spectrum hole concept [27]](https://thumb-eu.123doks.com/thumbv2/9libnet/4341487.71900/23.918.193.796.593.877/figure-spectrum-hole-concept.webp)

![Figure 2.6 shows the energy detector proposed in [36]. The center frequency fs and bandwidth of interest W is selected by the input band pass filter](https://thumb-eu.123doks.com/thumbv2/9libnet/4341487.71900/29.918.160.817.135.238/figure-energy-detector-proposed-center-frequency-bandwidth-selected.webp)
![Figure 3.1 SUs and PU locations [44]](https://thumb-eu.123doks.com/thumbv2/9libnet/4341487.71900/36.918.174.750.669.949/figure-sus-and-pu-locations.webp)