Copyright © www.iejee.com ISSN: 1307-9298
© 2020 Published by KURA Education & Publish-ing. This is an open access article under the CC BY- NC- ND license. (https://creativecommons. org/licenses/by/4.0/)
Scaling Problems in the System of
Transition from Elementary to
Secondary Education in Turkey with
the Rank-Order Method
*
Beyza İnceçam
**,a, Ergül Demir
bReceived : 2 February 2020 Revised : 3 July 2020 Accepted : 7 August 2020 DOI : 10.26822/iejee.2020.173
Abstract
Introduction
The purpose of this study was to examine the significance level of problems experienced in the transition from elementary to secondary education by using the rank-order scaling method. The study was conducted using a mixed-methods design. Forty-two eighth-and ninth-grade students from different types of public schools and 15 teachers were selected as the sample for the qualitative phase. The sample for the quantitative phase constituted consisted of 336 eighth- and 397 ninth-grade students, with 130 eighth- and 139 ninth-grade teachers. An essay instruction and semi-structured interviews were used to collect qualitative data. Then, scaling forms for students and teachers were developed in accordance with the qualitative data. The qualitative data were analyzed with the content analysis technique. "Thurstone's law of comparative judgments" and "the composite standard" solutions were utilized to analyze the ranked data. The stimulus of "constant and rapid changes in the transition system to secondary education" was scaled as the most significant problem by eighth-grade students and teachers. "Not allocating time for leisure time activities" stimulus was evaluated as the most crucial problem by ninth-grade students. In terms of the independent variables, rankings of the stimuli were more consistent in eighth graders’ judgments. However, ninth-grade students’ judgments revealed that there was less similarity in rankings for both gender and school type variables. Besides, according to the judgments of teachers, rankings descriptively differed in terms of the branch and seniority level variables.
D
evelopment theories have a determining role in definingthe structure of formal education systems. In this context, formal education is constituted of certain stages, such as preschool education, elementary education, secondary education, and higher education. However, the gradual structure of education systems brings along a necessity to regulate student transitions through stages.
**,aCorresponding Author: Beyza İnceçam.
Graduate School of Education, Kütahya Dumlupınar University, Kütahya, Turkey. E-mail: [email protected]. ORCID: http://orcid.org/0000-0003-0918-2165
bErgül Demir. Faculty of Education,
Ankara University, Ankara, Turkey E-mail: [email protected]
ORCID: http://orcid.org/0000-0002-3708-8013
Keywords:
Rank-Order Method, Scaling, The Composite Standard Method, Thurstone's Law of Comparative Judgments, The Transition From Elementary to Secondary Education
* This study was produced from the first author’s
Even though the transition from preschool education to elementary education is relatively less complex, there are well-defined, more systematic and sophisticated implementations in the transition to secondary schools. For instance, in the Republic of China, an entrance exam, Zhongkao, is administered to decide whether students graduate from elementary school and the same exam is used to select and place students in secondary schools (Hannum, An, & Cherng, 2011). Moreover, Finland’s education system is different from the Republic of China’s system and requires every student to receive a “basic education certificate” to get admission from secondary education institutions. Throughout primary education, national examinations are not allowed and the whole measurement and assessment process are administered by teachers. The secondary schools take into consideration of the grade point average for theoretical subjects in the certificate. Besides, some institutions may administer their entrance exams or students’ extracurricular activities are assessed as a criterion. In France, as in Finland, there are no examinations at the elementary level. However, students are directed to secondary schools through decisions of a local committee (académie), teachers council in primary school, and parents. Furthermore, in the Netherlands, an educational report on student performance is prepared by the school committee to determine which secondary school students should enroll. Additionally, at the end of primary school, students take a test that measures their level of understanding and knowledge (Eurydice, 2020). As for Turkey, nationwide examinations are administered, even in different systems for transition to secondary education. These systems were called OÖKÖSYS between 1998 and 2005; OKS between 2005 and 2007; OGES between 2007 and 2013, and TEOG between 2013 and 2018. It has been called central and regional placement since 2018. Regarding the dominant use of central examinations, the general structure of the system in Turkey is similar to the Republic of China’s system. However, considering the grade point average, OGES and TEOG systems overlap with Finland’s procedure.
Furthermore, in OKS, teachers’ suggestions were taken into consideration to select the students for particular types of schools, such as Anatolian teacher high schools (Ministry of National Education [MoNE], 2005). Thus, this implementation was in parallel with France’s. However, the system in Turkey is more compatible with the Netherlands system because both countries reckon among multiple criteria. Besides, considering system regulations in Turkey, it was explicitly stated that there are several problems (e.g., high levels of anxiety, low levels of attendance to extracurricular activities, and predominance of summative assessment rather than process) exist in the process of transition to secondary schools (MoNE, 2007). Although these problems have
caused a system shift, they persistently appear at different levels in the new systems. Therefore, the rationales for creating a new system and extinguishing the old one have resembled each other (MoNE, 2007; MoNE, 2010; MoNE, 2013). As a consequence, the transition to secondary education has become a tedious educational problem to solve. One of the problems in the transition system to secondary education in Turkey is increasing need for out-of-school resources such as cram and private out-of-schools (MoNE, 2010; Turkish Education Association [TED], 2010; Şad & Şahiner, 2016). Another problem is the negative consequences of entrance examinations on students’ psychology such as distress and anxiety (Koçak, Doğan-Gül, Gül, & Çokluk-Bökeoğlu, 2017; Duban & Arısoy, 2016; Karadeniz, Er, & Tangülü, 2014; MoNE, 2010). Moreover, many teachers feel increased pressure and under risk, while trying to increase students’ success (Atila & Özeken, 2015; Buyruk, 2014). Studies also showed that students’ participation in extracurricular social or leisure time activities such as arts or sports activities is negatively affected (MoNE 2010, Şahin, Uz-Baş, Sucuoğlu, & Şahin-Fırat, 2012), as well as communication between students and their parents (Şahin et al., 2012; TED, 2010; Zayimoğlu-Öztürk & Aksoy, 2014). Besides, due to an instructional perspective, in schools, emphasis is given to particular subjects that are subtests of entrance exams such as mathematics, science, or reading. Still, other subject areas, in other words, non-tested branches, may be ignored. Therefore, exams shaped teachers’ teaching methods and measurement and assessment techniques (MoNE, 2010b, TEA, 2010). These problems encountered in Turkey can also be seen in other countries as a result of the high-stakes testing (Berliner, 2011; Brown, Akos, & Galassi, 2004; Madaus, 1988; Madaus, Russel, & Higgins, 2009; Mora, 2011; Saito, 2006; Shepard, 2002; Smith & Rottenberg, 1991; Stecher, 2002; Winstead, 2011). The literature review showed that there are several qualitative research (Bakırcı & Kırıcı, 2018; Barksdale-Ladd & Thomas, 2000; Dinç, Dere & Koluman, 2014; Kahraman, 2014; Kılıçkaya, 2016; Yılmaz & Altınkurt, 2011), quantitative research (Bıçak & Çevik, 2010; Kutlu & Kumandaş, 2012; Özer-Özkan & Acar-Güvendir, 2018) and mixed-methods design (Kumandaş & Kutlu, 2014) that investigate experienced problems during transition through educational stages. Although problems in the transition to secondary schools have been explored through these studies, the positions of the problems among other problems or what is the most critical issue are still uncertain.
Hence, these studies were limited to determine the significance level of these problems. Therefore, using a convenient scaling approach to determine the experienced problems with a psychological continuum has become the main consideration of
this research. Dunn-Rankin, Knezek, Wallace, and Zhang (2004) listed the following four tasks to assess individuals’ judgments about psychological objects: ordering, categorical ratings, similarity judgments, and free clustering. The selection of ordering tasks would be the most appropriate one to determine the best, next best, and the worst. Thus, the methods meeting the ordering task are the unidimensional scaling techniques based on the stimulus-centered approach. In this context, using the rank-ordering method in scaling the problems experienced in the transition to secondary education could contribute to the literature. Because the rank-order scaling method enables to present stimuli as a whole (Ip, Kwan, & Chiu, 2007), prevents circular triads (Turgut & Baykul, 1992), and allows a wide range of stimuli to be used together (Guildford, 1954).
This study aimed to determine the problems in the transition system from elementary to secondary education, considering the perceptions of eighth and ninth-grade students and their teachers, then examine the significance level of these problems using the rank-order scaling method. Teachers and students were selected as judges because they were the most affected stakeholders of any change in the transition system. Hence, their scaled judgments in the psychological continuum might be used as data-based evidence to make regulations and find solutions to the problems in the transition policies. Moreover, several studies have examined the differences between groups (Bal, 2011; Koğar & Gelbal, 2015; Yalçın & Şengül-Avşar, 2014). Hence, various demographic variables such as gender, age, school type, or educational background may be related to the scale values. In this context, the study examined the following research questions:
1. According to students and teachers, what are the problems experienced in the context of the transition system from elementary to secondary education?
2. According to students and teachers, what are the scale values of the problems in the transition from elementary to secondary school?
3. Do the scale values differ descriptively by students’ genders and type of their schools, teachers’ branches, and seniority?
Method
Research Design
This study was conducted using a mixed-methods design. Mixed methods design is a research approach that requires the collection of qualitative and quantitative data in the process of investigating research questions and the integration of these
different data set forms while interpreting them. Exploratory sequential mixed design is one of the types of mixed methods design. In this design, the study begins with exploring and analyzing the qualitative data, and the findings can be used to develop a measurement tool. The quantitative data is then obtained as a second phase to support or generalize qualitative findings (Creswell, 2014). Thus, in this study, qualitative data were initially obtained to identify the stimuli in scaling forms, and then scale values were computed as a second phase.
Study Sample
A maximum variation sampling, which is a non-probability-based sampling method, was used in the qualitative phase of the study. The purpose of maximum variation sampling is to capture and reflect diverse characteristics of individuals (Patton, 2002). Accordingly, in the 2017–2018 academic year, the essay writing exercises were conducted with 27 eighth- grade students from middle schools and Imam hatip middle school, and 42 ninth-grade students from Anatolian high school, Imam hatip high school, and social sciences high school in Kütahya city center, Turkey. Besides, interviews were conducted simultaneously, with 15 teachers from the same schools. These schools varied in terms of academic achievement, school size, and family socioeconomic status (SES). While 10 (66.67%) teachers were working at elementary schools, five (33.33%) of them were working at secondary schools. Eleven of the 15 teachers were men, and only four of them were women. As for their branches, four teachers (26.67%) were in the field of mathematics, two (13.33%) were in the field of social studies, and similarly, two of them (13.33%) were in the field of counseling. One teacher from the following each branch participated in interviews: Turkish, literature, technology and design, religious culture and moral knowledge, geography, and science. Also, seven (46.67%) of the teachers had one to 10 years of working experience, whereas others’ (53.33%) had experience between 11 and 20 years.
A stratified random sampling method was used in the quantitative phase. In stratified sampling, the population is divided into specific subgroups by key characteristics of individuals in the population. Every subgroup is randomly selected to represent the same proportion in the population (Fraenkel & Wallen, 2006; Robson & McCartan, 2016). Then, the types of middle and high schools are identified as the subgroups of this study. MoNE (2018) statistics revealed that in the 2017 and 2018 academic year, there were 3,466 eighth- grade students and 3,675 ninth- grade students who enrolled in middle and high schools in the city center of Kütahya.
Additionally, the number of teachers working at middle schools was 746, while 816 teachers were working at high schools. As Cochran (1953) stated, for a 95% confidence level to represent a population as large as 1000, the sample size should be at least 320, and to represent a population that is 4000, the sample size then should be approximately 354. Therefore, the quantitative phase of the study constituted of 336 eighth- and 397 ninth-grade students, and 130 eighth- and 139 ninth-grade teachers additionally. Table 1 shows detailed information about the sample of students.
Table 1. Distribution of the Sample in terms of the
Grade, School Type, and Gender Variables
Grade School type
Gender Total Girl Boy n % n % n % Eight grade Middle school 127 17.33 122 16.64 249 33.97 İmam hatip middle school 51 6.96 36 4.91 87 11.87 Total 178 24.29 158 21.55 336 45.84 Ninth grade Science high school 17 2.32 10 1.36 27 6.80 Anatolian high school 65 8.87 72 9.82 137 34.51 Social sciences high school 18 2.46 8 1.09 26 6.55 Vocational high school 47 6.41 97 13.23 144 36.27 Imam hatip high school 0 0.00 41 5.59 41 10.33
Fine arts sigh
school 14 1.91 8 1.09 22 5.54
Total 161 21.97 236 32.19 397 54.16
General total 339 46.26 394 53.74 733 100
As Table 1 depicts, 1, the number of students from middle schools is almost three times greater than the number of students from İmam hatip middle schools. The numbers of students in the ninth-grade level are close to each other in Anatolian high schools and vocational high schools while science high school, fine arts high school, and social science high school have the lowest number of students in the distribution. As the preparation of data set for the analysis, it was noticed that there were 22 missing data in the scaling forms. In 16 of these forms, different stimuli were ranked with the same values. Five of them were ranked with a value that out of the ranking e.g., eight or nine, and one form was left unfinished. These forms were excluded from the data set, and analyses were conducted with 711 data. The sample of the teachers is presented in Table 2.
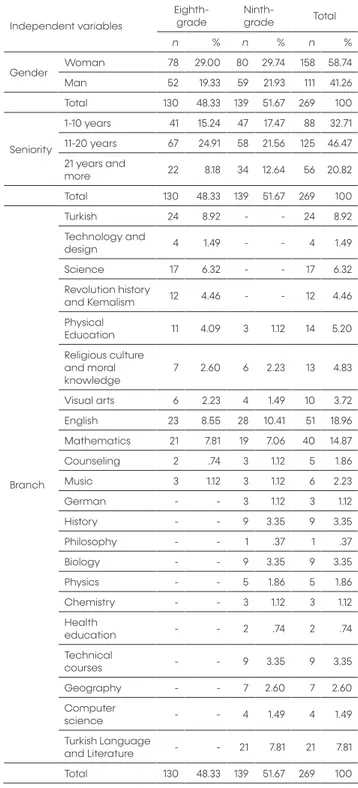
According to Table 2, in both of the eighth- and ninth-grade teacher groups, the percentage of the teachers with 21 years and more working experience
is the lowest. The branches with the highest number of teachers were English (18.96%), and mathematics (14.87%). The findings on the data set revealed that there are several mistakes (e.g., incomplete ranking or using the same rank more than once) in six forms that belong to eighth-grade teachers, and in the nine forms that belong to ninth-grade teachers. Hence, these forms were not included in the data set and 124 eighth-grade teacher forms with 130 ninth-grade teacher forms were analyzed.
Table 2. Distribution of the Sample in Terms of the
Gender, Seniority, and Branch Variables
Independent variables
Eighth-grade Ninth-grade Total
n % n % n % Gender Woman 78 29.00 80 29.74 158 58.74 Man 52 19.33 59 21.93 111 41.26 Total 130 48.33 139 51.67 269 100 Seniority 1-10 years 41 15.24 47 17.47 88 32.71 11-20 years 67 24.91 58 21.56 125 46.47 21 years and more 22 8.18 34 12.64 56 20.82 Total 130 48.33 139 51.67 269 100 Branch Turkish 24 8.92 - - 24 8.92 Technology and design 4 1.49 - - 4 1.49 Science 17 6.32 - - 17 6.32 Revolution history and Kemalism 12 4.46 - - 12 4.46 Physical Education 11 4.09 3 1.12 14 5.20 Religious culture and moral knowledge 7 2.60 6 2.23 13 4.83 Visual arts 6 2.23 4 1.49 10 3.72 English 23 8.55 28 10.41 51 18.96 Mathematics 21 7.81 19 7.06 40 14.87 Counseling 2 .74 3 1.12 5 1.86 Music 3 1.12 3 1.12 6 2.23 German - - 3 1.12 3 1.12 History - - 9 3.35 9 3.35 Philosophy - - 1 .37 1 .37 Biology - - 9 3.35 9 3.35 Physics - - 5 1.86 5 1.86 Chemistry - - 3 1.12 3 1.12 Health education - - 2 .74 2 .74 Technical courses - - 9 3.35 9 3.35 Geography - - 7 2.60 7 2.60 Computer science - - 4 1.49 4 1.49 Turkish Language and Literature - - 21 7.81 21 7.81 Total 130 48.33 139 51.67 269 100
Research Instruments and Procedures
The quantitative data were obtained using “Student and Teacher Scaling Forms” developed by the researchers. The “essay instruction” and an “interview form” were used to obtain the qualitative data set during the process of developing the scaling forms. As Erkuş (2012) stated, while identifying the construct to be measured, the literature can be supported by methods such as essay writing exercises or observations. To define the stimuli of the Student Scaling Form, the students were instructed to write an essay about their experiences during the transition to secondary education. This instruction was reviewed by two measurement and evaluation experts and two language experts. The essay practice was performed with seven students as a preliminary. Then, revisions about readability and accuracy of the final version of the instruction were made. As the essay data showed, eighth-grade and ninth-grade students’ perceptions showed similarity. Thereby, a scale form was developed for two groups of students.
Initially, the Student Scaling Form had six stimuli. “My family’s financial struggles because of costly out-of-school resources such as private tuition, textbooks” was a sub-example of the stimulus of “the problems that I had experienced with my parents.”. However, this sub-example was decided to be an independent stimulus, according to the experts’ review. Thus, the number of stimuli increased to seven. After the final version of the form was designed, preliminary administration was conducted with 10 students.
The student scaling form consisted of two parts and an instruction explaining how the form should be filled. In the first part, there are two demographic questions, gender and school type. The second part of the scaling form included a ranking of the problems. In this part, the problems considered as stimuli were listed as a table on one page and arranged randomly. Sub-examples were given to understand each stimulus better. A “ranking column” was added next to the list of stimuli. The judges (students) were asked to rank the stimuli from the most important (1) to the least important (7).
The stimuli of the Teacher Scaling Form were identified through semi-structured interviews with four main questions and probes. Thus, 11 stimuli were determined by evaluating the qualitative data and the body of the literature together. Teacher Scaling Form was reviewed by the same experts in the Student Scaling Form. Following the reviews, the sub-examples of stimuli were elaborated. The form was tested with four teachers. After revisions, the final form consisted of two parts and one instruction, similar to
the student form. Nevertheless, as distinct from it, the demographic information part was expanded with branch and seniority questions. Furthermore, teachers were asked to rank 11 stimuli from the most important (1) to the least important (11).
Data Analysis
A content analysis was used to examine the qualitative data. The purpose of the content analysis is to produce valid and replicable inferences from texts to contexts of their use (Krippendorff, 2004). In this regard, the data obtained from essays and interviews were analyzed inductively in the following five stages: coding, constructing sub-themes, constructing themes, sorting of themes, and reporting findings (Merriam & Tisdell, 2016). During the coding process, identifier numbers (e.g., S1 for the first student, T2 for the second teacher were used) were assigned to students and teachers. Eventually, seven themes were constructed according to the student essays, and four themes were emerged according to teachers’ views. Codes were checked by a qualified subject matter expert. Then, inter-rater reliability was not examined as the codes were agreed on.
A scaling method of rank-order based on the stimulus-centered approach was used to analyze the ranked data. In this scaling method, judges rank the defined stimuli from smallest to biggest, or vice versa, according to their particular characteristics. Then, they assign an ordinal number to these stimuli (Turgut & Baykul, 1992). The scale values can be computed with various techniques in the rank-order scaling method. One of these solutions is "Thurstone’s law of comparative judgment” claiming that ranked data can be transformed into the proportions of the law of comparative judgments by creating the row frequency matrices (F) that represent how many times a stimulus is placed in each rank (Thurstone, 1931). According to Guilford (1954), this solution is based upon the safest logical grounds. However, the number of judges should be at least 100. Therefore, to use this technique, integrations were made in some groups where the number of judges is relatively small. In this way, science high school, social high school, and Anatolian high schools were treated as one group (First group), and vocational high schools, imam hatip high schools, and fine arts high school were combined as the second group. In the same manner, eighth-grade teachers’ branches were scaled in two groups as tested and non-tested branches in national exams. Each of the scaling analysis was conducted on complete data (Edwards, 1957). Computation steps for the solution of the law of comparative judgment can be summarized as follows:
A raw frequency matrix was created for each group of independent variables. Then, the number of how many times each stimulus was judged greater than another stimulus was calculated with the following equation of n(Sji> Ski)= fji.(fk<i+(1/2).fki), in separate matrices.
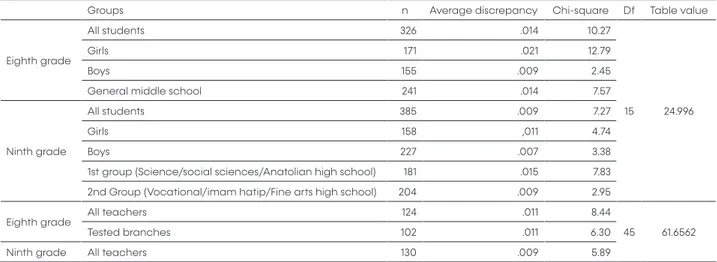
Later, the proportion of times stimulus j was greater than stimulus k was constructed in the P matrix. Moreover, unit normal deviation values corresponding to P elements were shown in the X matrix. To obtain scale values, the mean values of X were calculated by dividing sums of the columns of the X matrix by the number of stimuli. However, to see the position of the stimuli on the psychological continuum, the zero point was arbitrarily placed at the lowest mean value of X as the origin. This value was then added to other mean values of X (Guilford, 1954; Torgerson, 1958). Furthermore, the goodness of fit of the model to the data was examined to determine whether the assumption of analysis was met. Accordingly, average absolute deviations between observed and fitted proportions, in other words, error terms were obtained, and a chi-square test was utilized to examine the significance of these values. Table 3 depicts the results of the analysis.
According to Table 3, the discrepancies between observed and fitted values are not statistically
significant at the alpha level of α= .05. Therefore, the
scale values obtained from Case V were interpreted
in the findings section. Another solution for rank-order scaling is “the composite standard method," which is accepted as the second best technique by Guilford (1954). The underlying assumption of this technique is that the stimuli group is a composite standard (CS) in which each stimulus is compared. However, the CS technique can be used when the multiplication of the number of stimuli and the number of judges is greater than 200 (Guilford, 1954). Hence, in cases where the number of judgments for Thurstone’s solution was inadequate, the CS method was used in this study (these situations are as follows: seniority of the teachers, branches of the ninth-grade teachers, non-tested branch group among eighth-grade teachers, and İmam-hatip middle school as school type). Ninth-grade teachers’ branches were examined into four groups to ensure that the number of teachers was close to each other. Hence, the first group was called language (German and English), the second group was called social sciences (geography, literature, philosophy, religious culture and morality, and history), the third group was called mathematics and science (physics, chemistry, biology, and mathematics) and lastly, the fourth group was called other (physical education, computer education, visual arts, music, counseling, health education, and technical courses). Similarly, scale values for seniority variable were calculated for three different groups; One to 10 years, 11 to 20 years, and 21 and more years. Initially, the raw frequency matrix was generated in
Figure 1. Process of Solution of Law of Comparative Judgment in Method of Rank-Order
Table 3. Average Discrepancy and Chi-square Values for the Solution of Law of Comparative Judgments
Groups n Average discrepancy Chi-square Df Table value
Eighth grade
All students 326 .014 10.27
15 24.996
Girls 171 .021 12.79
Boys 155 .009 2.45
General middle school 241 .014 7.57
Ninth grade
All students 385 .009 7.27
Girls 158 ,011 4.74
Boys 227 .007 3.38
1st group (Science/social sciences/Anatolian high school) 181 .015 7.83
2nd Group (Vocational/imam hatip/Fine arts high school) 204 .009 2.95
Eighth grade All teachers 124 .011 8.44
45 61.6562
Tested branches 102 .011 6.30
the CS method. Owing to this matrix, the probability of each stimulus greater than the CS was calculated using the following equation:
(Guilford, 1954; Turgut & Baykul, 1992). As the next step, the deviations correspond to those proportions were computed (Xj> cs). Turgut and Baykul (1992) claimed that the sum of X values should be as small as possible and close to zero.
In this study, the sum of the X values ranged within the range of -.002 and .11, not far from zero. Consequently, the number of judges and data set was found to be convenient for this technique. Lastly, to make all X values positive, the zero point was arbitrarily placed at the lowest X value. Furthermore, Kendall’s Tau correlation coefficient was used to compare rank orders in addition to descriptive findings.
Findings
Qualitative Findings
Students’ perceptions. Eight- and ninth grade students’
perceptions revealed that the problems experienced in the transition to secondary education were constructed in seven themes. The most frequently mentioned theme was "anxiety and stress experienced during the transition to secondary education" (f= 43). While the total frequency of eighth-grade students
was f8= 17, the total frequency of ninth-grade students
was f9= 26. Experiencing exam stress, feeling physically
ill, being afraid of not being successful in exams, or disappointing others were the sub-themes that explain this theme. A student (S34) highlighted the stress he experienced by writing, “when TEOG exams have come, many of us could not succeed due to studying hard and feeling stressed. As if we are not taking an exam, we are taking stress.” S25, who worried about being unsuccessful, stated, “If I cannot be successful, it will be tough to recover myself. This is what terrifies me the most. Even the thought of not being successful is enough to fill my eyes with tears. If I had one wish, I just wanted to pass the exam.”
Moreover, S11 wrote that "…I am curious about my parents' reactions and I am really scared. I do not want to disappoint them…and I do not want to break their hearts.” S61, who suffered health problems, remarked, “I was also physically harmed. I lost eight kilos in a year.” The second theme was defined as "the problems arise from the system" (f8= 25, f9= 6). The main argument of this theme was the rapid changes in the system of transition to secondary education. Also, uncertainty about how the measurement and assessment process will operate, and not adapting to a new system were also considered as crucial problems. About this theme, S24 wrote, "…the most challenging thing for us
was definitely the change of the system. When the system suddenly changed, we were in a quandary." Following this statement, S64 expressed, "students who faced with system changing do not know what to do and fell psychologically bad." The third theme was “the problems between students and their parents” (f8= 7, f9= 20). The sub-themes of this theme are parent pressure on the student to study, comparison of student performance with others, negative reactions to exam results, and the conflict between students and parents when determining future goals. Student opinions regarding these problems are as follows:
“Our parents want us to enroll in a good high school and have a profession, but when they say study, we feel pressured. I mean, I feel like this (S3). “My parents acted differently because of my low exam score” (S28). “My parents’ expectations about my future, on the other hand, my dreams and plans for my future made me to fall into a dilemma” (S29). “It makes me feel awful when my family and the people I care about compare me with others” (S19).
Another theme was determined as “not allocating time for leisure time activities” (f8= 7, f9= 8). Student opinions revealed that students spent most of their time studying, even out of school during the transition process. S65 made a statement for this theme writing, “I locked myself home, and was constantly studying or doing homework. I almost isolated myself from the outside world.” The fifth theme was called "the problems between students and their teachers". S23 gave an example of opinion on this theme, "our teachers put pressure on us to get good results from exams, and they sometimes shout at us to do a nonstop test." On the other side, students in the eighth- and ninth-grades said that the time they spend in school increases, including weekends; however, this time was allocated to studying or taking the tests. These statements were identified as the sixth theme as “excessive exam-oriented preparations in schools” (f8= 6, f9= 7). S23 wrote, "it has been a tough period of my life since I attended after-school and weekend courses." Furthermore, S47 stated, “…but I want to explain a method that we used. With this method that was started two months before TEOG, we did the test from 7 p.m. to 9 p.m.”
The least mentioned theme among seven themes was the “financial struggles of the families” (f8= 2, f9= 3). This theme can be exemplified by costly out-of-school resources such as new textbooks, books, and private lessons. Student views supporting this theme were "my family enrolled me in a cram school; however, they had to stint themselves. They made many sacrifices” (S1). Moreover, S30 identified the problem as “The expenses that my family made for me to study in a high school was overmuch.”
Teachers’ Perceptions. According to the teachers’
perceptions, four main themes emerged. The first
theme was “the problems arise from the system" (f8=
29, f9= 6). Some teachers (f8= 8, f9= 1) remarked the continuous and rapid changes in the transition system to secondary education with the following statement, “my wish is the stability in the system. Change happens within a day or two, but the new system takes a year to digest. For example, the system may change again next year, and it will be disconcerting for children”
(T3). A few teachers (f8= 7 f9= 1) highlighted that
these changes may cause uncertainty about how to administer the new implementations. Furthermore,
teachers (f8= 5, f9= 1) perceived that the transition
system to secondary education fails to bring students abilities and interests to the forefront. For example, T4 expressed, “unfortunately, the placement of students to high schools is completely exam-oriented. Neither the ability of children nor what they think are not taken into consideration, the last decision depends on the exam results.” Some teachers (f8= 3, f9= 1) also criticized the subtests in nationwide exams as they are not good enough to assess higher-order thinking skills as much as PISA.
Moreover, teachers (f8= 3, f9= 1) had a negative view
that the new system would be a solution for out-of-school resources, as emphasized in the following statements: "the new system will raise the importance of cram schools or private lesson” (T8), “people whit money will eventually access to the extra resources so that the gap will increase more” (T7). Besides, the use of the criteria for academic achievement in placing students to secondary education schools
is identified as a problem by a few teachers (f8=
1, f9= 1). T15’s following statement could exemplify
the aforementioned problem: “…I think the views of teachers and school administration must be used as a criterion for students’ placement because they work with students and know them very well. Some European countries use these criteria.” Two teachers expressed that their opinions are not taken during the change in the system of transition to secondary education, and defined it as a problem. T7’s opinions summarize this problem: “As a suggestion, I can say that I believe that the ministry of education does not appreciate my ideas in this system, where I am the practitioner, is nonsense. There are about a million teachers in which they play a major role in the Turkish education system, but unfortunately, I am the one whose ideas are taken least. I know very-well educated people at the ministry, yet I believe that they do not care that my ideas can give them a perspective.” The second theme was about the harmful effects of the transition system to secondary education on teachers (f8= 18, f9= 9). Sub-themes of this theme were
restriction of teachers’ teaching and measurement-assessment methods (f8= 12, f9= 5), increased in stress due to the use of exam results to make comparative interpretations (f8= 4, f9= 2), and consideration of non-tested subject areas as worthless by students (f8= 2, f9= 2). Teachers’ views on this theme are as follows:
T5: “While I am preparing items for the exam, I pay attention to…. rather than considering which item measures the learning outcomes best, then I cannot transfer my dreams into practice. I mean, I use tests, open-ended items, or items that out of spec when needed. However, I know that I am accounted for these.” T4 said, "…normally, I can use many activities such as games or puzzles, according to my branch. Nevertheless, unfortunately, we are compelled to teach test or cover a topic due to our exam-oriented system and restricted lesson hours. Also, like students, teachers are compared as a racer like this teacher's students got lower grades, while others’ students got higher grades.” Lastly, T14 stated, “teachers of non-test branches are considered in an unnecessary position. Students do not care about these subjects since they thought these subjects are not useful for them. Thus, the teachers get upset and take a hard line with students. Even technology and design teachers intentionally give students low grades due to this situation.”
Teachers also expressed their opinions about the unintended consequences of the transition system to
secondary education on students (f8= 3, f9= 7). These
views were investigated in the theme of "problems that students experienced." One sub-theme was associated with the limitation of the students’ development to cognitive skills only. T14 said, “… children try to improve themselves only in Turkish or mathematics, but they miss many other goals such as social and emotional development." Some teachers stated that the parents hold down students to study. For example, T13 said, “Especially some parents bore children by saying, you have to solve 300-400 questions per day. Children study like a racer.”
The fourth theme with the lowest frequency was the "problems of the families” (f8= 1, f9= 1). According to the teachers, even though the cram schools were closed down, families still pay for extra resources such as private lesson institutions that are similar to cram schools. A teacher’s (T4) view explains this problem as follows: “If we look from the family’s viewpoint, it is a very troublesome situation. Why? Because they are responsible for a great financial expense. They spend money on school for food and textbooks; they maybe hire a teacher for a private lesson. Although the cram schools closed down, they do not give up private lesson institutions that can also be excepted as under the counter. So, families become more stresses to meet these expenses.”
Quantitative Findings
Scaling Findings Obtained from Students’ Judgments.
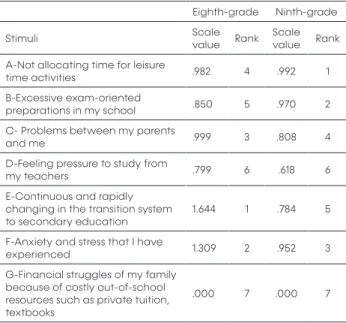
Table 4 depicts the level of importance considered as a problem in the transition system to secondary education, according to eighth-grade and ninth-grade students.
Table 4. Scale Values and Ranks Obtained from
Students’ Judgments
Eighth-grade Ninth-grade
Stimuli Scale value Rank Scale value Rank
A-Not allocating time for leisure
time activities .982 4 .992 1
B-Excessive exam-oriented
preparations in my school .850 5 .970 2
C- Problems between my parents
and me .999 3 .808 4
D-Feeling pressure to study from
my teachers .799 6 .618 6
E-Continuous and rapidly changing in the transition system to secondary education
1.644 1 .784 5
F-Anxiety and stress that I have
experienced 1.309 2 .952 3
G-Financial struggles of my family because of costly out-of-school resources such as private tuition, textbooks
.000 7 .000 7
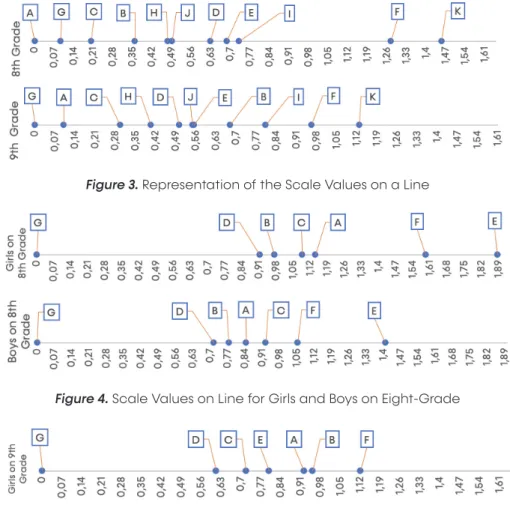
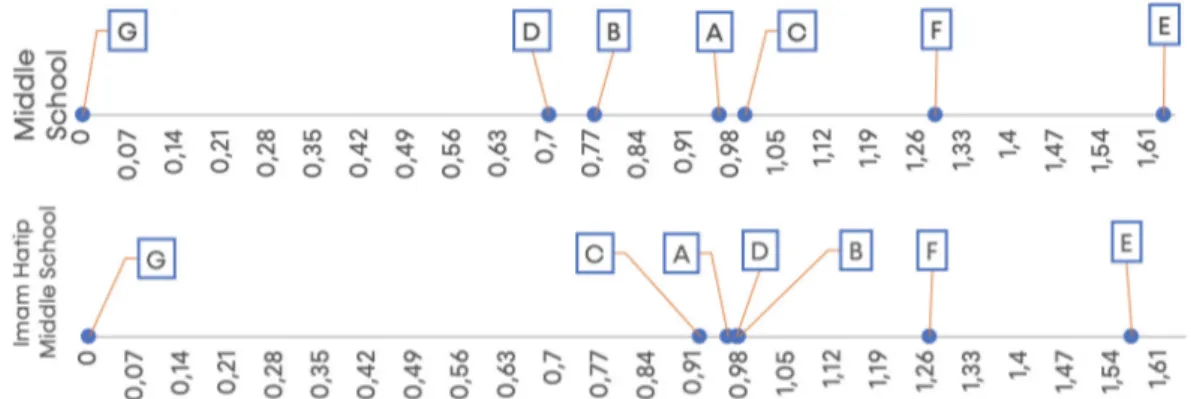
As Table 4 depicts, the vast majority of the significance levels regarded the problems that differ among the student groups experiencing different systems for transition to secondary education. Coherently, the Kendall’s tau (rt) correlation coefficient was found to be .24 but it was not significant (p> .05). This value illustrates that students’ rankings at different grade levels are not similar. Only, stimuli D and G went through a similar discriminal process because both were scaled on the last ranks. The most distinct discrepancy between the two groups was observed in stimuli A and E. The scale values on a straight line are shown in Figure 2.
In Figure 2, the most significant problems had the highest scale values, while the least problems had the lowest scale values. According to eighth-grade students' judgments, the stimuli that were ranked on the fifth and sixth order, and on third and fourth order were more clustered. However, the stimulus on
the second rank was located more independently by scaling almost in the middle of the stimuli C and E. For ninth graders’ judgments, the range of the scale values of stimuli A, B, and F is narrow. Moreover, the stimuli that scaled on fourth and fifth orders were grouped by diverging from that triad.
Scaling Findings Obtained from Teachers’ Judgments.
Table 5 presents the significance level of the problems in the transitions system to secondary education by teachers.
Table 5. Scale Values and Ranks Obtained from
Teachers’ Judgments
Eighth-grade Ninth-grade
Stimuli Scale value Rank Scale value Rank
A- Financial struggles of the families because of costly out-of-school resources such as private tuition, textbooks.
.000 11 .099 10
B-Consideration of non-tested
subjects as worthless by students .358 8 .678 4
C-Increase in the necessity for
out-of-school resources .201 9 .296 9
D-Restriction of teachers’ teaching
methods .628 5 .501 7
E-Experiencing stress because of the use of exam results to make comparative interpretations about teacher and school
.686 4 .552 5
F-Not taking teachers ‘opinions while changing the transition system to secondary education or making decisions about it
1.274 2 .961 2
G-Parent pressure on students .092 10 .000 11
H-Limitation of the students’ development with only cognitive skills rather than soft skills
.475 7 .403 8
I-The use of criteria only related to academic achievement in placing students to secondary education schools
.730 3 .802 3
J-Falling short of the national exams while assessing higher-order thinking skills
.491 6 .548 6
K- Continuous and rapid changes in the transition system to s
econdary education 1.455 1 1.128 1
As illustrated in Table 5, despite the scale values of stimuli K, F, and I differentiated, they were assigned to
the top three ranks for both groups. Similarly, stimuli J and C that is ranked sixth and ninth order, respectively. For the rest of the stimuli, there were no significant differences between rankings which is proved with
correlation analysis (rt= .78, p< .05). Exceptionally,
stimulus B was judged as highly significant by ninth-grade teachers, whereas it was evaluated as less significant by eighth-grade teachers. The scale values on a straight line are illustrated in Figure 3.
In judgments of the eighth-grade teachers, the significance level of two stimuli that on sixth and seventh ranks was almost equal. Stimuli D, E, and I seemed a group because they located tightly. However, the two most significant stimuli located explicitly far away from the rest of the stimuli. Most of the differences between the scale values of ninth-grade teachers' judgments were ranged between .09 and .17. Still, the significance level of stimuli on the fifth and sixth ranking was barely discriminated against with the value of .004 difference.
Scaling Findings in Terms of Gender and School Type Variables. According to students' judgments in terms
of gender variable, the scale values were evaluated comparatively for both grade-level and presented in Figures 4 and 5.
According to students' judgments in terms of gender variable, the scale values were evaluated comparatively for both grade-level and presented in Figures 4 and 5.
According to girls and boys in eighth-grade, the ranking only differed for the stimuli on the third and fourth order. Hence the correlation between rankings showed that boys’ and girls’ judgments were statistically similar (rt= .91, p< .05). Also, it was observed that there are descriptive differences in scale values. For instance, despite the most significant problem was stimulus E for boys and girls, there was a .47 difference between the two groups. This difference was observed in each of stimulus, except for the least significant stimulus. In the same rankings for girls and
Figure 3. Representation of the Scale Values on a Line
boys, there were differences with the values of .54, .20, and .20, respectively. Each difference was in favor of girls. While the scale value of stimulus D on sixth rank was .91, this value scarcely corresponded to third rank in the group of boys.
Figure 5 provides that four stimuli were scaled on different ranks, except for the stimuli on second, sixth, and seventh rankings. However, rankings in different gender groups were not similar (rt= .52, p> .05). While the most significant problem for girls was judged to be moderately significant by boys, the most significant problem for boys was placed on third order by girls. Even though the stimuli were scaled on different ranks, no significant changes in scale values were observed. Most of the scale values were in favor of boys, yet the scale values of first and third stimulus were in favor of girls. The scale values obtained from the judgments of students from different school types are demonstrated in Figures 6 and 7.
As Figure 6 depicts, stimuli E, F, and G had the same rankings in different groups. However, compared to students' judgments in imam hatip middle schools, students in middle schools evaluated stimulus C as highly significant by ranking it three points more. Stimulus A was scaled moderately important in both different school types, and its location differed only one rank. Stimuli B and D were considered more important for imam hatip middle school students. These different rankings indicated that eighth-grade
students from different school types do not share similar judgments (rt= .52, p> .05). Furthermore, in the solution of the law of comparative judgment, stimulus on third and fourth with fifth and sixth ranks seemed like a group. The scale values of the CS method were clustered, particularly at the third, fourth, fifth, and sixth ranks.
As Figure 7 shows, the essential problems devoted by groups differed. Consistently, the relationship between rankings was not significant (rt= .52, p> .05). As the most important for the second group, stimulus B was ranked third by the first group. And stimulus F was seen moderately significant by the second group, while it was seen as the most important one by the first group. Also, the scale values of the second group are lower than that of the first group. The highest scale value of the second group was almost equal to the scale value of the stimulus on the fourth rank. As the top six stimuli were close to each other in both groups, stimuli G was not seen explicitly important by locating far away from others.
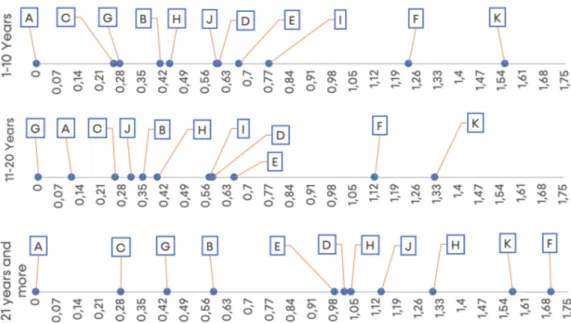
Scaling Findings in Terms of Seniority and Branch Variables. Figure 8 and 9 show scale values calculated
from the judgments of eighth-grade and ninth-grade teachers according to seniority variable.
Figure 8 depicts that no stimulus was scaled on the same rank by three different groups. However, most of the stimuli were changed only one or two ranks
Figure 6. Representation of the Scale Values of Eighth Grade Students’ Judgments
among the groups, so the correlation coefficient
among rankings varied between .56 and .78, p< .05.
According to descriptive results, teachers in first and second groups decided that the stimulus K is the most significant problem. However, this stimulus was seen as less important than the stimulus F by the teachers with 21 years and more experience. Contrary to the fact that stimulus A was scaled by the first and third group on the last rank; stimulus G was judged as the least significant problem by the teachers with 11- and 20-year experience. In the first group, stimuli that scaled on fifth and sixth, seventh, and eighth, with ninth and tenth rank; in the second group stimuli scaled on fourth and fifth rank created a pairwise. In the last group, there was a triad that included stimuli E, D, and H.
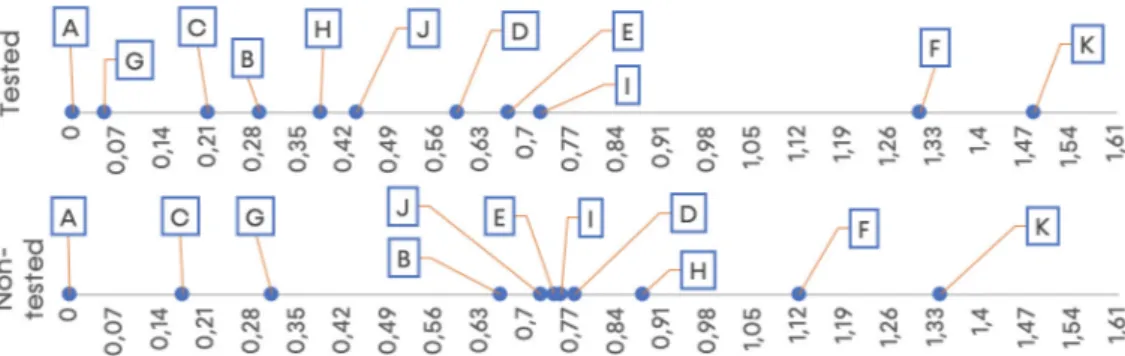
Based on Figure 9, the number of stimuli agreed on by the groups is four in eleven. Even though stimuli B, E, D, and J were scaled in different locations, the ranking differences were not more than three. Overall, the correlation coefficient between rankings was found rt= .86, p< .05 for each comparison, which means the judgments of different groups were congruent. The highest scale values of stimuli K and F were in the group of teachers with one to 10 years of seniority. In the last group, stimuli on fifth, sixth, seventh, eighth, ninth, and tenth ranks were clustered between .35 and .42 values. Figures 10 and 11 explain whether the scale values differed or not in terms of the branch variable. According to the representation of the scale values on a line, stimuli A, B, F, and K were scaled on the same
Figure 8. Representation of the Scale Values of Eighth-Grade Teachers’ Judgments
rank, and rankings were consistent among these groups rt= .745, p< .05. However, while the stimulus H
was considered as highly crucial for the first group, the non-tested branch group judged the same stimuli closer to the last of the ranking. Stimuli F and K, which were on the same ranks for both groups, had higher scale values in the solution of Thurstone’s law of comparative judgment. Nevertheless, stimulus B had a higher scale value in the CS method. In the first group, stimuli fall into the last nine ranks were more distributed more tightly, yet the top two stimuli distinctly discriminated. Additionally, in the non-tested branch group, stimuli H to B were condensed between .65 and .75 values.
As Figure 11 depicts, most of the stimuli’ ranks were changed one or two orders, although there are only two stimuli were judged at the same significance level by four branch groups. Thus, the correlation between teachers’ judgments was found to be
significantly similar, and the correlation coefficients among rankings varied between .67 and .89, p< .05. Nevertheless, stimulus B was judged to be moderately significant by the third group, while other groups chose this stimulus as highly significant. Also, stimulus E was seen as more important by the language and social sciences branch groups. Besides, some stimuli were clustered and constituted of pairwise and triad groups such as; stimuli B and I in the first group; stimuli E and B with stimuli D, J, C, and H in the second group; stimuli I and J, B, and D with A and G in the third group. Finally, the scale values of F, I, and B with D and J were close to each other in the last group. Even, the scale values of stimulus J and D were equal; it means two stimuli were not distinguished.
Discussion, Conclusion, and Recommendations
Analysis of essays indicated that the students’ experiences constituted seven main problem areas.
Figure 10. Representation of the Scale Values of Eighth-Grade Teachers’ Judgments
All of them were in line with previous studies (Özerman, 2007; Satio, 2006; TED, 2010; Şahin et al., 2012; Zayimoğlu-Öztürk & Aksoy, 2014; Stecher, 2002). However, unlike previous research, this study has illustrated that the problems between students and their families went beyond pressure and conflict issues. Parents’ negative attitudes toward exam results have become a part of the existing problems and had negative effects on students. Besides, the findings of the study revealed that the relationship between teachers and students has become more exam-oriented, and the success of central examinations has become the only tool for promoting student motivation.
According to qualitative data, teachers’ perceptions were grouped under four themes. Similarly, the study of Özer-Özkan and Acar Güvendir (2018) aimed to develop a scale about the effects of national examinations on teachers and identified four factors. Three of these factors are as follows; (i) instructional effects, (ii) morale and motivation, (iii) anxiety, and stress were consistent with the themes. Qualitative data indicated that teachers’ teaching strategies were restricted by exam preparation, as well. Chapman and Snyder Jr (2000) claimed that during national high-stakes test adopting new teaching approaches consistently seemed to be risky by teachers. Additionally, many teachers reported that they had become teachers who teach test (Barksdale-Ladd & Thomas, 2000; Kahraman, 2014; Kılıçkaya, 2016).
During interviews, teachers stated that students consider non-tested branches worthless, which was also emphasized by previous studies (Stecher, 2002; TEA, 2010; Winstead, 2011). However, this study revealed that the ratings of non-tested branch teachers can be biased due to reaction to students, while evaluating student performance.
Thus, it can be concluded that the exams administrated in the transition to secondary education had adverse outcomes for the measurement and assessment process. Another problem highlighted by teachers was the constant changes during the transition process to secondary education. Studies have revealed that this problem became a current issue, particularly as system has been changing (Ocak, Yıldız, & Akgül, 2010; Uzoğlu, Cengiz, & Taşdemir, 2013). Besides, teachers expressed their stressful feelings because of the usage exam results were used as comparative judgments. Several studies confirmed this finding by revealing stress and pressure experienced by teachers (Buyruk, 2014; Brown et al., 2004; Kılıçkaya, 2016). Furthermore, in a study conducted by Barksdale- Ladd and Thomas (2000), teachers expressed that they can transfer their anxiety and stress to students. Therefore, this finding can explain why teachers put pressure on students to study more. Lastly, a few studies that examining the
items of national exams (Altun & Doğan, 2018; Başol et al., 2016; İncikabı, Pektaş, & Süle, 2016) supported teachers' criticism about assessing higher-order thinking skills.
The findings of scaling revealed that the most important problems differed descriptively among eighth-grade and ninth-grade students. As the fact that eighth-grade students experienced the system changing can be considered as the reason for “continuous and rapid change in the system of transition to secondary education," stimulus was judged as the most crucial problem by them. Moreover, the study of Lee and Larson (2000) examined students who prepared for university entrance exams and found that allocating time for leisure activities is negatively correlated with depression. Thus, "not allocating time for leisure time activities" stimulus was assessed as the most significant problem experienced by ninth-grade students was an expected result, as their mental health may have been negatively affected. However, the "anxiety and stress that I experienced" stimulus was scaled as significant by all of the students. Some metaphorical research (Duban & Arısoy, 2016; Karadeniz et al., 2014; Koçak et al., 2017) showed that students’ perceptions about secondary school entrance exams were mostly associated with stress, anxiety, hopeless, and death. Even though these studies did not reveal the significance level of this problem, they can be evaluated as the explanator of students' judgments about this stimulus. According to collective judgment among students, "the financial struggles of families" was the least significant problem. Scaling values of this problem were consistent with the frequencies in essays. Comparing the scale and frequency rankings of other stimuli, they showed consistency in eighth-graders' judgments.
Though, qualitative data and scaling findings differed in the judgments of the ninth-graders. For instance, "not allocating time for leisure activities" and "excessive test preparation in schools" were on the moderate level in terms of frequency, but they scaled in the top two ranks. Despite the "anxiety and stress that experienced" was the most mentioned problem in the essays, scaling results revealed that its actual position of it on the psychological continuum was different. Just as judgments of eighth-grade students, the most significant problem for teachers was "continuous and rapid changes in the system of transition to secondary education." However, eighth-and ninth-grade teachers’ judgments about the least significant problem did not correspond to the same stimuli. "Financial struggles of families" stimulus was not considered as important by eighth-grade teachers, whereas "parent pressure on student" was seen the least significant one by ninth-grade teachers. Besides,
scaling rankings were not in line with the qualitative phase of this study. Although the "restriction of the teaching methods" problem was frequently stated during interviews, it did not have the highest scale values. Moreover, "not taking teachers' opinions while changing the transition system to secondary education" was one of the least mentioned problems by teachers. However, when several stimuli were represented together, the same problem was assigned to second order on the psychological continuum. In this study, scale values were also examined in terms of independent variables. The findings of the study revealed that eighth-grade students’ rankings were showed similarity among gender variables. Some studies showed that girls in eighth-grade experienced test preparation anxiety (Özerman, 2007), and test anxiety more (Hanımoğlu, 2010). Conversely, the significance level devoted to "anxiety and stress that students experienced" stimulus did not differ between girls and boys in eighth-grade. As for ninth-grade students, rankings were more inconsistent in terms of independent variables, because the essential problems varied by gender and school type. When considered seniority and branch variables, more similar distributions on psychological continuum were produced in one-and 10-years seniority with 21 years and more seniority groups. However, the rankings in 11-and 20-years seniority groups were more distinctive. Furthermore, there was no variation in the location of "consideration of non-tested subjects as worthless by students" stimulus between tested and non-tested branch groups, which was an unexpected result. An explanation for such a result is that there are few teachers in the non-tested group.
Besides, scaling of 11 stimuli produced average discrepancy values ranged between .009 and .011, while these values ranged between .007 and .021 in the scaling analysis with seven stimuli. Thurstone (1931) reported that when the number of stimuli in the method of rank-order is greater than 10, the approximation of proportions reaches a satisfactory level. Hence, the findings of the study supported Thurstone's (1931) argument.
According to the findings of this research, some suggestions can be made. First, the transition to secondary education should be planned in a systematic, scientific, and rational way. Thus, the continuity can be ensured. Teachers’ ideas also can also be considered as an expert opinion in structuring this system. Second, students should be directed to extracurricular activities, and teachers should be encouraged to use different instructional strategies. Future studies can extend their scope by considering to study with different samples or variables. For example, parents and school administrators can be selected
as judges. It may also be worthwhile to use different methods to identify stimuli, such as Delphi technique or focus group interviews. Moreover, further studies can explore other unidimensional scaling techniques and compare their consistency.
References
Altun, H., & Doğan, M. (2018). Teog sınavı matematik sorularının yenilenen bloom taksonomisine göre incelenmesi [Analysis of maths questions of Teog exam according to the renewed Bloom taxonomy]. Sosyal Bilimler Dergisi, 5(19), 439-447. http://dx.doi.org/10.16990/SOBIDER.4000
Atila, M. E., & Özeken, Ö.F. (2015). Temel eğitimden ortaöğretime geçiş sınavı: fen bilimleri öğretmenleri ne düşünüyor? [Examination for transition from primary education to secondary education (Teog): What do science teachers think about it?]. Ondokuz Mayıs
Üniversitesi Eğitim Fakültesi Dergisi, 34(1),
124-140. https://dergipark.org.tr/tr/pub/omuefd/ issue/20280/214999
Bakırcı, H., & Kırıcı, M. G. (2018). Temel eğitimden ortaöğretime geçiş sınavına ve bu sınavın kaldırılmasna yönelik fen bilimleri öğretmenlerinin görüşleri [Science teachers’ views on the removal of the transition from primary to secondary education exam]. YYÜ
Eğitim Fakültesi Dergisi, 15(1), 383-416. http://
dx.doi.org/10.23891/efdyyu.2018.73
Barksdale-Ladd, M. A., & Thomas, K. F. (2000). What’s at stake in high stakes testing: Teachers and parents speak out. Journal of
Teacher Education, 51(5), 384-397. https://doi.
org/10.1177/0022487100051005006
Bal, Ö. (2011). Seviye Belirleme Sınavı (SBS) başarısında etkili olduğu düşünülen faktörlerin sıralama yargılarıyla ölçeklenmesi [Scaling of factors that is considered to be effective on placement exam with the rank order method]. Eğitimde
ve Psikolojide Ölçme ve Değerlendirme Dergisi, 2(2), 200-209. https://dergipark.org.tr/en/pub/
epod/issue/5804/77230
Başol, G., Gılgamış, E., Karlı, M. G., & Öz, F. B. (2016). Teog sınavı matematik sorularının MEB kazanımlarına, Timms seviyelerine ve yenilenen Bloom taksonomisine göre incelenmesi [Content analysis of TEOG mathematics items based on MONE attainments, TIMSS levels, and reformed Bloom Taxonomy]. Journal of Human Sciences,
Berliner, D. (2011). Rational responses to high stakes testing: The case of curriculum narrowing and the harm that follows. Cambridge Journal of
Education, 41(3), 278-302. http://dx.doi.org/10.10
80/0305764X.2011.607151
Bıçak, B. & Çevik, C. (2010). Yedinci sınıf seviye belirleme sınavı matematik sorularına ilişkin öğretmen görüşleri [The views of field experts in determining the mathematic questions for seventh class level exam’s]. Mediterranean
Journal of Humanities, 2(2), 45-56. http://doi.
org/10.13114/MJH/201322469
Buyruk, H. (2014). Öğretmen performansının göstergesi olarak merkezi sınavlar ve eğitimde performans değerlendirme [Standardized examinations as a teacher performance indicator and performance evaluation in education]. Trakya
Üniversitesi Eğitim Fakültesi Dergisi, 4(2),
28-42. https://dergipark.org.tr/en/pub/trkefd/ issue/21480/230201
Brown, D., Galassi, J. P, & Akos, P. (2004). School counselors’ perceptions of the impact of high-stakes testing. Professional School Counseling,
8(1), 31-39.
Chapman, D. W., & Snyder Jr, C. W. (2000). Can high stakes national testing improve instruction: reexamining conventional wisdom. International Journal of Educational
Development, 20, 457-474. https://doi.
org/10.1016/S0738-0593(00)00020-1
Cochran, W. G. (1953). Sampling techniques. Asia Publishing House.
Creswell, J. W. (2014). Research design: Qualitative,
quantitative and mixed methods approaches
(4th Ed.). Sage Publications.
Dinç, E., Dere, İ., & Koluman, S. (2014). Kademeler arası geçiş uygulamalarına yönelik görüşler ve deneyimler [Experiences and viewpoints on the practices of the transition between various schooling levels]. Adıyaman Üniversitesi Sosyal
Bilimler Enstitüsü Dergisi, 7(17), 398-423. http://
dx.doi.org/10.14520/adyusbd.761
Duban, N. & Arısoy, H. (2016). 8. sınıf öğrencilerinin temel eğitimden ortaöğretime geçiş (teog) sınavına ilişkin algılarının metaforlar aracılığıyla incelenmesi [Analysing the perceptions of 8th graders on examination for the transition from secondary to high school education (Teog) through metaphors]. Kalem Eğitim ve
İnsan Bilimleri Dergisi, 7(1), 67-89. https://doi.
Dunn-Rankin, P., Knezek, G.A., Wallace, S., & Zhang, S. (2004). Scaling methods. Lawrence Erlbaum Associates.
Edwards, A. L. (1957). Techniques of attitude scale
construction. Appleton Century Crofts.
Erkuş, A. (2012). Var olan ölçek geliştirme yöntemleri ve ölçme kuramları psikolojik ölçek geliştirmede ne kadar işlevsel: Yeni bir öneri [How much functional are the scale development methods and measurement theories in developing psychological scales: A new proposal]. Eğitimde
ve Psikolojide Ölçme ve Değerlendirme Dergisi, 3(2), 279-290. https://dergipark.org.tr/en/pub/
epod/issue/5802/77218
Eurydice (2020). Description of national education
systems. https://webgate.ec.europa.eu/fpfis/
mwikis/eurydice/index.php/Countries
Fraenkel, J.R. & Wallen, N. E. (2006). How to design
and evaluate research in education (6th Ed.).
McGraw Hill Companies.
Guilford, J. P. (1954). Psychometric methods. Mc Graw-Hill Book Co.
Hanımoğlu, E. (2010). The analysis of the relation among
test anxiety, perfectionism and the attitudes of parents of the secondary students who will pass placement test. [Master’s Thesis, Çukurova
University]. Council of Higher Education Thesis Center.
Hannum, E., An, X., & Cherng, S. H. (2011). Examinations and educational opportunity in China: Mobility and bottlenecks for the rural poor. Oxford
Review of Education, 37(2), 267-305. http://
dx.doi.org/10.1080/03054985.2011.559387
İncikabı, L., Pektaş, M., & Süle, C. (2016). Ortaöğretime geçiş sınavlarındaki matematik ve fen sorularının pisa problem çözme çerçevesine göre incelenmesi [An analysis of SSIPE mathematics and science items in terms of Pisa problem solving framework]. Ahi Evran
Üniversitesi Kırşehir Eğitim Fakültesi Dergisi, 17(2),
649-662.
Ip, W.C., Kwan, Y. K., & Chiu, L. L. (2007). Modification and simplification of Thurstone scaling method, and its demonstration with a crime seriousness assessment. Social Indicators Research, 82(3), 433-442. https://doi.org/10.1007/s11205-006-9040-z
Kahraman, İ. (2014). Merkezi ortak sınav uygulamasının etkilerine ilişkin öğretmen görüşleri [The effect of common implementation that related to teachers’ opinion]. Tunceli Üniversitesi Sosyal
Bilimler Dergisi, 2(4), 53-73. https://dergipark.org.
tr/tr/pub/tusbd/issue/42133/506878
Karadeniz, O., Er, H. & Tangülü, Z. (2014). 8. sınıf öğrencilerinin sbs’ye yönelik metaforik algıları [The metaphorical perceptions of the 8th grade students for Pt]. Uluslararası Avrasya
Sosyal Bilimler Dergisi, 5(15), 64-81. http://
www.ijoess.com/Makaleler/2113918669_5-o%c4%9fuzhan%20karadeniz.pdf
Kılıçkaya, F. (2016). Washback effects of a high-stakes exam on lower secondary school english teaches’s practices in the classroom. Lublin
Studies in Modern Language and Literature, 40(1), 116-134. https://eric.ed.gov/?id=ED569921
Koçak, D., Doğan-Gül, Ç., Gül, E. & Çokluk-Bökeoğlu, Ö. (2017). Öğrencilerin sınav kavramına yönelik metaforlarının incelenmesi [Examining students’ metaphors for the “exam” concept]. Ahi Evran
Üniversitesi Kırşehir Eğitim Fakültesi Dergisi, 18(3), 415-434. http://dx.doi.org/10.29299/
kefad.2017.18.3.022
Koğar, H., & Gelbal, S. (2015). Üniversite öğrencilerinin sosyal beğenirlik tercihlerinin yargıcı kararları ile ölçeklenmesi [The scaling of social desirability with judgmental decision among college students]. Amasya Üniversitesi Eğitim Fakültesi
Dergisi, 4(1), 136-152. https://dergipark.org.tr/en/
pub/amauefd/issue/1732/21255
Krippendorff, K. (2004). Content analysis: An
introduction to its methodology (2nd Ed.). Sage
Publications.
Kumandaş, H. & Kutlu, Ö. (2014). Yükseköğretime öğrenci seçmede ve yerleştirmede kullanılan sınavların oluşturduğu risk faktörlerinin okul başarısı üzerindeki etkileri [The risk factors caused by exams used for student selection and placement into higher education on the academic performance]. Türk
Psikoloji Dergisi, 29(74), 15-31. https://www.
psikolog.org.tr/tr/yayinlar/dergiler/1031828/ tpd1300443320140000m000046.pdf
Kutlu, Ö., & Kumandaş, H. (2012). The determination of the predictive variables that the 6th, 7th and eighth-grade students’ status about the exam-oriented pressure towards the transition to secondary education system (in Turkey). Procedia-Social and Behavioral
Sciences, 46, 2601-2604. https://doi.org/10.1016/j.
sbspro.2012.05.531
Lee, M., & Larson, R. (2000). The Korean examination hell: Long hours of studying, distress, and depression.
Journal of Youth and Adolescence, 29(2),
249-271. https://doi.org/10.1023/A:1005160717081 Madaus, G. F. (1988). The distortion of teaching and testing:
High stakes testing and instruction. Peabody
Journal of Education, 65(3), 29-46. https://www.
jstor.org/stable/1492818?seq=1#metadata_info_ tab_contents
Madaus, G. F., Russell, M. K., & Higgins, J. (2009).
The paradoxes of high stakes testing: How they affect students, their parents, teachers, principals, schools and society. Information Age
Publishing Inc.
Ministry of National Education. (2005). 2005 ortaöğretim kurumları öğrenci seçme sınavı hakkında genel açıklama [General explanation about placement exam in 2005]. MoNE
Ministry of National Education. (2007). 64 soruda ortaöğretime geçiş sistemi ve seviye belirleme sınavı örnek sorular [Transition to secondary education system in 64 questions and item examples for placement exam]. MoNE
Ministry of National Education. (2010). Seviye belirleme sınavının değerlendirilmesi [Evaluation of the placement exam]. Department of Research and Development of Education. https://www. meb.gov.tr/earged/earged/sbs_deger.pdf Ministry of National Education. (2013). Temel
eğitimden ortaöğretime geçiş sistemi ile ilgili sıkça sorulan sorular [Frequently asked questions about the system for transition to secondary education]. MoNE http:// www.meb.gov.tr/duyurular/duyurular2013/ b i g b/ te g i t i m d e n o o g ret i m e g e c i s / M E B _ SSS_20_09_2013.pdf
Ministry of National Education. (2018). 2009-2017 yılları arası eğitim göstergeleri [Educational indicators for the years 2009-2017]. Provincial Directorate for National Education.
Merriam, S. B. & Tisdell, E. J. (2016). Qualitative research:
A guide to design and implementation.
Jossey-Bass.
Mora, R. (2011). “School is so boring”: High-stakes testing and boredom at an urban middle school.
PennGSE Perspectives on Urban Education, 9(1),