230 Ahmet UZUN1 Latif Aydos2 Metin KAYA2 Ulunay KANATLI3 Erdinç ESEN3
DISTRIBUTION OF SOLE PRESSURE IN FEMALE
FOOTBALL PLAYERS
41234ABSTRACT
Objective: The purpose of this study is to investigate the effect of football on sole peak
pressure, average maximal pressure and pressure–time integral soles of professional female football players and healthy individuals.
Methods: 22 female football players (18,80 ± 2,2 age) and 28 female volunteers (27,5 ±6,6
age) (as the control group)having no foot complaints were included in the study. In the research EMED-SF (Novel GmbH, Munich, Germany) plantar pressure analysis system was used. It was examined whether there was any statistically significant difference between the experiment and control group means using non-parametric Mann Whitney U test, the size of the linear relation between physical structure and variables of sole was examined by calculating Pearson’s (r) coefficient. In the measurements 95% reliability range and P < 0.01 – 0.05 were accepted as significance level.
Results: At the end of the measurements, it was found that there were significant
differences between the female football players and control group in right foot 2 left feet 1st, 2nd,3rd,4th metatarsal heads sole 11 contact areas peak pressure and in the 3rd, 4th and 5th toes, at average maximal pressure in right and left foot in 2nd metatarsalheads and time pressure integral in right foot 2nd and 3rd metatarsalheads and left foot heel medial, heel lateral, 2nd,3rd and
4thmetatarsalheads.
Conclusion: In our findings, it was found that the pressure in football players’ sole front
interior regions was higher than both the control group and the other regions in their own feet. It was determined that the particularly the crampons used by the football players were insufficient to protect the sole and failed to prevent permanent sole pressure parameters. As a result, Football players’ excessive pressing against their soles in forcing movements in long term exercises and matches are indicated to cause change in the sportsmen’s sole pressure regions and values.
BAYAN FUTBOLCULARDA AYAK TABANI
BASINÇ DAĞILIMLARININ ARAŞTIRILMASI
ÖZET
Amaç: Bu araştırmanın amacı profesyonel bayan futbolcular ile sağlıklı kişilerin ayak tabanı
zirve basınç, ortalama maksimal basınç ve basınç–zaman integrali karşılaştırılarak futbolun ayak tabanı üzerine etkisinin araştırılmasıdır.
Gereç ve Yöntem: Çalışmaya ayak şikâyeti olmayan 22 bayan futbolcu (18,80 ± 2,2yaş) ve
kontrol gurubu olarak 28 bayan gönüllü (27,5 ±6,6yaş) dâhil edilmiştir. Araştırmada EMED-SF (NovelGmbH, Münih, Almanya) plantar basınç analiz sistemi kullanılmıştır. Denek ve kontrol grubu ortalamaları arasında istatistiksel olarak anlamlı farkın olup olmadığı non-parametrik Mann Whitney U testi, fiziksel yapı ve ayak tabanına ait değişkenler arasındaki doğrusal ilişkinin büyüklüğü Pearson’un (r) katsayısı hesaplanarak incelenmiştir. Ölçümlerde %95 güven aralığı ile P < 0.01 – 0.05 anlamlılık seviyesi kabul edilmiştir.
Bulgular: Ölçümler sonunda ayak tabanı 11 temas alanı zirve basınç sağ ayak 2., sol ayak
1,2,3,4.metatars başlarında ve 3.4.5 ayak parmaklarında , ortalama maksimum basınçlarında sağ ve sol ayak 2. metatars başlarında ve basınç–zaman integrali ise sağ ayak 2 ve 3. metatars başları ile sol ayak topuk mediali,topuk laterali, 2,3 ve 4. metatars başlarında bayan futbolcularla kontrol gurubu arasında anlamlı farklılıkların olduğunu bulunmuştur.
Sonuç: Bulgularımızda, futbolcuların ayak tabanı ön iç bölgelerindeki basınçların hem
kontrol gurubuna göre hem de kendi ayaklarının diğer bölgelerine göre daha yüksek olduğu görülmektedir. Özellikle futbolcuların kullandıkları kramponların ayak tabanını korumada yetersiz kaldıkları ve ayak tabanı basınç parametrelerinde kalıcı değişiklikleri engelleyemedikleri belirlenmiştir. Sonuç olarak, futbolcuların uzun süreli antrenman ve maçlarda zorlayıcı hareketlerde ayak tabanlarına aşırı yüklenmeleri sporcuların ayak tabanı basınç bölgelerinde ve değerlerinde değişime neden olduğunu göstermektedir.
1 School of Physical Education and Sports, Karamanoğlu Mehmetbey University, Karaman-
Turkey
2
School of Physical Education and Sports, Gazi University, Ankara- Turke
3 Department of Orthopaedics and Traumatology, Gazi University, Ankara- Turkey 4
This study was presedented at The 8th International Conference in Physical Education, Sportand Physical Therapy – From Theory to Practice, November 8-9th, 2013 – Iasi, ROMANIA
231
INTRODUCTAION
Football is accepted as the most popular sport branch of the world and it is the sport branch growing fastest with the proportion of participants in the countries. While proportion of participation of females in football play in the universities in America between 1981-2005 increased by 11 folds up to 39% (NCAA, 2007a) this proportion increased to 49% in males in the university (NCAA, 2007b). And in 2007 the number of female football players in the universities in America is more than the number of male football players. Upon the increase of the number of female football players the proportion of injury in this population increased dramatically (Warden, Creaby, Bryant, & Crossley, 2007). In 2004 Olympic games it was found that the highest injury proportion per match was in female football players (Junge et al., 2006). Football players frequently encounter physical oppression arising from the competitor players. Meanwhile they have to perform forcing movement physically. This situation increases the risk of acute injury of the football players (Rahnama, Reilly, & Lees, 2002). English football federation indicated that the risk of injury for football players was approximately 1000 fold higher than industrial injuries in a research conducted in order to determine the risk of injury for professional football players in England (Hagglund, Walden, Bahr, & Ekstrand, 2005; Hawkins, Hulse, Wilkinson, Hodson, & Gibson, 2001).The highest injury occurs in football in bottom extremity in ankles particularly with a proportion of 31%(Kılıçoğlu, 2009). It was stated that approximately 17% of those injuries were caused by the equipments used and 77% of those equipments was caused by shoes and 23% was caused by shin guard (Wong & Hong, 2005).
The pressure in the soles in football players’ movement is very important. Prevention, rehabilitation of those pressure areas particularly in the soles
as well as the design of shoes and other things worn on the foot are extremely effective(Wong, Chamari, Chaouachi, Wisløff, & Hong, 2007). Although Football shoe producers approach shoe production systematically, insufficiency of scientific researches caused the scientific results not to affect the producers sufficiently. In pressing against the knee joint, and in disabling of knee and foot shoe bottom surface, nails and ordering may have a key role (Torg, 1982). Function of the sole became particularly significant in sportive events (Ackland, Elliot, & Bloomfield, 1994).A significant aspect of plantar pressure analysis is detection of distribution of pressure on various anatomicparts of the foot. High pressure occurs in the big toe and lower pressure occurs in middle parts of the foot (Bennett & Duplock, 1993). This form order of distribution of pressureis a very similar case for he observed adults (Cavanagh, Hewitt Jr, & Perry, 1992).Solewas designed for force, flexibility and coordinated movements. The main role of those body parts is providing transmission of force in order the motor activities including walking, running and jumping to be created (Wong, Chamari, Chaouachi, et al., 2007).Significant portion force in the body is produced by the pressure applied by the foot on ground (Rad & Aghdam, 2012; Stokes, Hutton, & Stott, 1979). It continues through all organs including muscles, joints and bones (Rad & Aghdam, 2012).
Primary sole disorder is metatarsalgia (Kang, Chen, Chen, & Hsi, 2006). Metatarsalgia is a problem which arises after repeated pressing against of the metatarsus heads and which is observed widely in the society. The load carried by metatarsus heads during walking differs from one person to another (Eils et al., 2002; Kılıçoğlu, 2009). It is known that the imbalances between load distribution and load increase in metatarsus heads is
232 one of the primary reasons for
metatarsalgia (Kang et al., 2006). Various foot problems including metatarsi stress breaking, neuroma, metatarsalgia sesamoid pathology are the results of repeated pressing against of sport. Stress breaking is one of the most common disabling reasons among particularly amateur and professional football players. 1994 FIFA World Cup reported as well that 38% of disabling events were caused by stress breaking (Knapp, Mandelbaum, & Garrett, 1998). The stress breaking of metatarsi is micro breaking caused by the loads commonly coming on bones of sportsmen exceeding physiological limits. The stress breaking of foot occurs more frequently in runners, sports branches that require jumping and dancers(Kılıçoğlu, 2009).
Upon new methods developed in recent years in sole pressure measurement getting more common it became possible to measure load per metatarsus quantitatively. Despite the speed in the development of those methods, knowledge on pressure
distribution forms in metatarsus heads are still debated(Kanatli et al., 2008; Kang et al., 2006;Queen, Haynes, Hardaker, & Garrett, 2007). Foot pressure measurements became significant for preventing, treatment and rehabilitation of the deformities that could occur in the foot and providing suitable shoe(Patil, Thatte, & Chaskar, 2009).
Football has a different and special place in terms of foot and sole variables compared to all other sports branches particularly for being a sports branch performed with foot. The purpose of this research is to compare peak pressure, average maximal pressure and time pressure integral pedobarographic parameters of various sole regions of female football players and healthy individuals during walking on bare foot and to search for the effect of football on female football players ‘sole. It contributes to the further future studies on this issue as well as the studies for using and developing shoes suitable for football by detecting the loads on metatarsus heads in the sole.
METHODS Subjects
The study included 22 professional female football players of Turkish University National Team who had no previous foot injury and complaints (aged 18,80 ±2,2 years) and a control group of 28 female volunteers (aged 27,50±6,6 years). The average age at which the athletes started playing football was 10 years. Those with a foot disorder, a neurological disease affecting the movement system, a peripheral neuropathy, players with previous foot or ankle surgery and fracture in this area were excluded from the present study.
Age, height, weight and BMI values of all the subjects were measured (Table 1).
Instruments
Pedobarographic (sole pressure) measurements of the study participants
were performed using an EMED-SF (Novel GmbH, Munich, Germany) plantar pressure analysis system at the Gazi University Faculty of Medicine Department of Orthopedy and Traumatology walking laboratory. The system uses a 71 Hz sampling frequency; its dimensions are 44.4 × 22.5 cm; it includes two receptors per cm2; and it is mounted on a wooden platform of 7 × 1 m and covered by a thin layer of leather.
Experimental Procedures
The present study was approved by the Local Ethics Committee of the Faculty of Medicine, T.R. Gazi University (February 25, 2008; approval number 074 for non-pharmacological clinical studies).The respondents walked freely on a 7-meter walking band before stepping on the pedobarograph and the
233 area where the measurement was
performed is not stated The measurements were performed with naked feet and two dynamic measurements were performed for each
foot. The sole was divided into 11 areas, each of which was evaluated in terms of peak pressure[N/cm2], average maximal pressure [N/cm2] and time pressure integral [(N/cm2 )*s] (Figure 1).
Figure 1.Mask areas in pedobaography (M01: medial of heel, M02: lateral of heel, M03: midfoot, M04: 1st
metatarsal head, M05: 2nd metatarsal head, M06: 3rd metatarsal head, M07: 4th metatarsal head, M08: 5th metatarsal head, M09: pollex M10: 2nd finger, M11: 3rd 4th and fifth fingers).
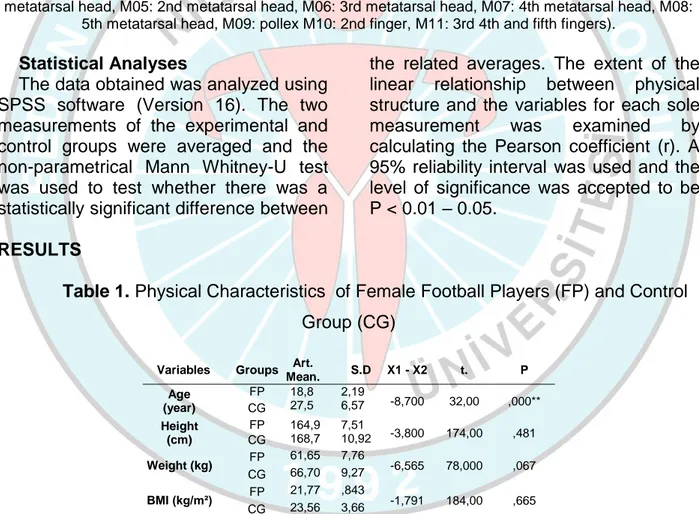
Statistical Analyses
The data obtained was analyzed using SPSS software (Version 16). The two measurements of the experimental and control groups were averaged and the non-parametrical Mann Whitney-U test was used to test whether there was a statistically significant difference between
the related averages. The extent of the linear relationship between physical structure and the variables for each sole measurement was examined by calculating the Pearson coefficient (r). A 95% reliability interval was used and the level of significance was accepted to be P < 0.01 – 0.05.
RESULTS
Table 1. Physical Characteristics of Female Football Players (FP) and Control
Group (CG)
Variables Groups Mean. Art. S.D X1 - X2 t. P Age (year) FP 18,8 2,19 -8,700 32,00 ,000** CG 27,5 6,57 Height (cm) FP 164,9 7,51 -3,800 174,00 ,481 CG 168,7 10,92 Weight (kg) FP 61,65 7,76 -6,565 78,000 ,067 CG 66,70 9,27 BMI (kg/m²) FP 21,77 ,843 -1,791 184,00 ,665 CG 23,56 3,66 ** P<0.01
In averages of age, height, body weight and BMI of the female football players and the control group only the
age difference between the groups was found to be meaningful at P < 0.01 level (Table 1)
234
Table 2.Comparison of Right and Left Feet Peak Pressure of Female Football Players
(FP) and Control Group (CG) [N/cm2]
Variables Group
Right Foot (N/cm2) Left Foot (N/cm2)
Mean S.D Mann-Whitney U P Mean S.D Mann-Whitney U P Foot- TOTAL FP CG 55,92 19,25 168,000 ,386 58,42 17,57 161,000 ,291 58,07 17,94 62,42 18,79
MO1: The medial part of heel
FP 38,27 5,51
178,000 ,552 38,67 7,66 143,500 ,126 CG 39,47 10,72 45,47 13,80
MO 2: The lateral part of heel FP 36,35 5,00 184,500 ,675 35,37 3,73 135,000 ,078 CG 36,65 9,08 42,25 12,93 MO 3: midfoot FP CG 16,37 6,97 140,000 ,725 12,42 5,48 197,500 ,946 21,95 7,93 12,12 7,25 MO 4: The 1st metatarsal head of foot FP 30,47 25,46 187,000 ,104 41,20 18,53 116,000 ,023* CG 12,47 4,76 28,42 13,18 MO 5: The 2nd metatarsal head of foot FP 36,50 11,87 83,500 ,002** 40,35 7,44 114,500 ,021* CG 52,55 17,55 52,07 17,75 MO 6 The 3rd metatarsal head of foot FP 37,42 14,33 143,500 ,126 38,95 19,23 104,500 ,010** CG 42,55 11,20 43,80 10,63 MO 7: The 4th metatarsal head of foot FP 28,77 9,11 159,500 ,273 24,00 6,53 85,000 ,002** CG 32,85 11,86 34,95 13,81 MO 8: The 5th metatarsal head of foot FP 28,87 18,20 175,500 ,507 19,42 10,38 121,000 ,033* CG 30,52 14,24 29,27 17,49 MO 9: pollex FP 31,65 18,11 171,500 ,441 36,40 18,11 175,500 ,507 CG 37,90 21,64 43,10 23,49 MO 10: 2nd finger of foot FP 23,22 11,38 163,000 ,317 18,42 5,70 136,500 ,086 CG 20,00 9,403 15,87 8,31 MO 11 : 3.4.5. fingers of foot FP 18,70 10,88 136,000 ,083 15,40 7,16 119,000 ,028* CG 12,45 5,98 10,80 5,82 *p<0.05, **p<0.01 ve p<0.001.
In the comparisons between female football players and the control group, between right-left foot 11 contact areas peak pressure values the difference between the means of right foot 2nd
metatarsal head and left foot 1st, 2nd, 3rd, 4th metatarsal heads as well as the means in 3rd, 4th, 5th toes were found to be statistically meaningful at (P<0.01-0.05) level (Table 2).
235
Table 3.Comparison of Right and Left Feet Average Maximal Pressure of Female
Football Players (FP) and Control Group (CG) [N/cm2]
Variables Group
Right Foot (N/cm2) Left Foot (N/cm2)
Mean S.D Mann-Whitney U P Mean S.D Mann-Whitney U P Foot- TOTAL FP 15,83 1,54 179,000 ,570 15,72 1,97 179,500 ,579 CG 16,14 3,38 16,38 3,19
MO1: The medial part of heel FP 20,83 2,10 185,000 ,685 21,03 2,70 172,000 ,449 CG 19,99 3,78 22,31 5,24 MO 2: The lateral part of heel FP 18,89 2,36 143,000 ,123 18,61 1,69 192,000 ,829 CG 17,43 2,67 18,59 3,70 MO 3: midfoot FP 6,80 2,31 153,000 ,204 5,86 2,23 165,000 ,344 CG 5,84 2,31 5,40 3,43 MO 4: The 1st metatarsal head of foot FP 13,06 6,33 176,000 ,516 17,35 5,80 107,000 ,012** CG 11,49 4,32 12,85 4,17 MO 5: The 2nd metatarsal head of foot FP 19,93 4,94 91,000 ,003** 22,26 2,36 116,500 ,024* CG 25,33 5,56 26,21 6,49 MO 6 The 3rd metatarsal head of foot FP 19,77 4,96 158,000 ,256 20,80 5,04 145,500 ,140 CG 22,48 6,12 23,08 5,19 MO 7: The 4th metatarsal head of foot FP 15,41 5,08 193,000 ,850 13,98 4,04 154,000 ,213 CG 15,17 4,29 15,52 4,13 MO 8: The 5th metatarsal head of foot FP 13,01 6,44 197,000 ,935 10,25 3,72 168,000 ,387 CG 12,38 3,94 11,63 4,24 MO 9: pollex FP 12,16 5,28 181,000 ,607 12,51 4,18 169,000 ,402 CG 13,37 5,02 13,65 4,32 MO 10: 2nd finger of foot FP 9,38 3,39 160,500 ,285 8,35 3,03 153,000 ,203 CG 8,75 3,21 7,35 3,10 MO 11 : 3.4.5. fingers of foot FP 6,20 2,40 147,500 ,156 5,20 1,94 144,000 ,130 CG 5,00 1,78 4,17 1,51 ** P< 0.01 * P < 0.05
In the comparisons between female football players and the control group, between right-left foot 11 contact areas maximal pressure the difference between the means of right foot 2nd metatarsal
head and left foot 1st and 2ndmetatarsal heads were found to be statistically meaningful at (P<0.01-0.05) level (Table 3).
236
Table 4.Comparison of Right and Left Feet Time Pressure Integral of Female Football
Players (FP) and Control Group (CG) [(N/cm2 )*s]
Variables Group
Right Foot (N/cm2) Left Foot (N/cm2)
Mean S.D Mann-Whitney U P Mean S.D Mann-Whitney U P Foot- TOTAL FP 19,02 3,96 109,000 ,014** 20,06 4,34 112,000 ,017** CG 22,22 4,51 23,43 4,77
MO1: The medial part of heel FP 7,44 1,44 156,500 ,239 7,44 1,20 105,000 ,010** CG 8,57 2,50 9,75 3,22 MO 2: The lateral part of heel FP 7,18 1,46 151,000 ,185 6,87 ,799 100,500 ,007** CG 8,05 2,06 9,10 3,25 MO 3: midfoot FP 3,76 1,12 193,000 ,850 2,93 1,42 166,000 ,358 CG 3,75 1,77 3,72 2,46 MO 4: The 1st metatarsal head of foot FP 7,03 5,20 181,000 ,607 9,31 3,54 142,000 ,117 CG 6,32 2,26 7,77 3,41 MO 5: The 2nd metatarsal head of foot FP 8,88 2,81 52,000 ,000** 9,55 2,17 64,000 ,000** CG 13,77 3,08 13,59 3,73 MO 6 The 3rd metatarsal head of foot FP 9,70 3,75 91,000 ,003** 9,81 4,66 76,000 ,001** CG 12,34 2,45 12,39 2,50 MO 7: The 4th metatarsal head of foot FP 7,75 2,04 141,000 ,110 6,67 1,53 56,000 ,000** CG 9,29 2,40 10,05 3,16 MO 8: The 5th metatarsal head of foot FP 6,79 3,47 160,000 ,279 5,06 2,31 109,000 ,014** CG 7,96 3,64 7,87 4,03 MO 9: pollex FP 6,29 4,72 155,000 ,223 8,09 6,12 165,000 ,344 CG 8,57 6,10 9,27 5,59 MO 10: 2nd finger of foot FP 3,89 2,05 197,500 ,946 3,16 ,994 199,000 ,978 CG 4,07 2,03 3,47 2,05 MO 11 : 3.4.5. fingers of foot FP 3,48 1,84 161,000 ,291 2,87 1,74 175,500 ,507 CG 2,86 1,50 2,47 1,34 ** P< 0.01 * P < 0.05
In the comparisons between female football players and the control group, between right-left foot 11 contact areas time pressure integral values the difference between the means of right
foot 2nd and 3rd metatarsal heads and left foot heal medial, heal medial heal lateral, 2nd, 3rd,4th,5th metatarsal heads were found to be statistically meaningful at (P<0.01-0.05) level(Table 4).
237
Table.5: Correlation between Physical Structure and Foot-Sole Variables of Female
Football Players (FP) and Control Group (CG)
Variables Age Height Body Weight BMI
FP CG FP CG FP CG FP CG
Right Feet Peak Pressure Total
r ,057 -,555* ,303 ,235 ,317 ,085 ,370 -,107 p ,811 ,011 ,193 ,318 ,270 ,723 ,108 ,653
Left Feet Peak Pressure Total
r -,374 -,506* ,083 ,303 ,125 ,242 ,294 ,000
p ,105 ,023 ,729 ,194 ,672 ,304 ,209 ,999
Right Feet Average Maximal Pressure.
r ,007 -,254 ,719** ,237 ,597* ,404 ,427 ,220 p ,977 ,280 ,000 ,315 ,024 ,077 ,060 ,350
Left Feet Average Maximal Pressure.
r ,245 -,128 ,440 ,156 ,341 ,376 ,390 ,243 p ,297 ,590 ,052 ,511 ,233 ,102 ,089 ,301
Right Feet Time Pressure Integral
r ,065 -,538* ,508* ,515* ,510 ,379 ,454* -,034 p ,785 ,014 ,022 ,020 ,063 ,099 ,044 ,887
Left Feet Time Pressure Integral
r -,395 -,351 ,141 ,344 ,331 ,458* ,396 ,177 p ,085 ,129 ,553 ,137 ,248 ,042 ,084 ,456
In female football players in the comparison of right foot Average Maximal Pressure with height and body weight, and between right foot Time
Pressure Integral and height and BMI meaningful relations were detected at the level of (0,01 and 0,05) (Table 5).
DISCUSSION
In this research peak pressure, mean maximal pressure and time pressure integral of various parts of the sole in professional female football players were examined and the differences with control group composed of healthy individuals were compared for right and left feet and assessed accordingly. The difference between age, height, body weight and body mass index of the football players participating in the research and the control group was found to be meaningful only in age. Since the female football players composing the research group were the sportswomen of female national football team studying in the university the difference between age was found to be significant. However there is no difference between height, weight and BMI’s directly affecting the sole(Table 1).This may be deemed as an indicator of those groups having a homogeneous structure in physical terms.
Football fields are made of sand, earth, natural lawn and synthetic game field surface. 12 of the 31 fields used in American National Football league (2005) synthetic lawn fields (NFLPA, 2006). In a study performed on 17 male football players where the effects of natural lawn and synthetic lawn field surface on the sole inside the shoe were examined using slalom test, meaningful relations were found between various regions of the foot and the two field surfaces. It was determined that game field surface affected significantly the distribution of pressure created in the sole, the highest relative pressing against was on synthetic lawn and in medial foot front part and more frequently observed disabling occurred on natural lawn surface. Stress breaking depending on repeated aversion movements, Jones breaking and lateral peak pressing against occurred on grassFord et al. (2006).Eric Eils, et.al. (2004) detected in their research that
238 there was a significant relation between
football movements and the distribution of pressure created in the sole, and there was no difference between the condition of the football field and the distribution of pressure inside the shoe in terms of pressure parameters (2004). In the study made on football players where the distribution of pressure in the sole was researched using quickness test in three different technical applications composed of interior side transfer, exterior side transfer and speeding movements, the pressure was detected to increase in the side part of the foot in exterior side transfer, interior and front part in interior side transfer and medium part of the foot in speeding (Queen et al., 2007)
And in our study it was found in the comparisons between 11 contact points peak pressure values of right and left foot in female football players and the control group the difference between the mans in right foot 2ndmetatarsus head, left foot 1st, 2nd, 3rd and 4th metatarsus heads and 3rd, 4th, 5th toes was significant (Table 2). There are similar studies. EMED-SF (Novel GmbH, Munich, Germany) suggested in the study performed using plantar pressure analysis system participated by 25 professional basketball players and 25 male volunteers as the control group where the effect of players on professional basketball players’ sole in the comparisons right and left foot total peak pressure, among the means while right foot 1st metatarsus head and right foot big toe was found to be small in basketball players right foot 4th metatarsus head was more than the control group (Uzun, 2012). In the research performed by Eilset.alon40 healthy individuals (25.3 age, 70.8 kg and 176.5 cm) using EMED-SF (Novel GmbH, Munich, Germany) plantar pressure analysis system similarity was observed between peak pressure distribution results, it was suggested that the distribution results of basketball players was found to be lower than the control group results (Eils et al., 2002). At
the end of the study where the effect of wrestling on sole was searched it was suggested that the differences between the means, between the wrestlers and the control group in sole peak pressure comparisons, were higher in the control group than the wrestlers in left foot total, heel medial, heel lateral, 2,3,5th. Metatarsus heads and left foot total, heel medial, heel lateral, 2, 3, 5th. Metatarsus heads (Aydos, 2011). Although all of the sportsmen participating in the study used their right feet actively higher differences were observed particularly in left foot peak pressure values. Since football is a sport performed with foot, for the sportsmen using their right feet actively have to use left feet as balancing feet. For solid balance in exercises and matches they need to press left foot on the ground more strongly and solidly. And as a result of this difference arises between football players’ left feet. Particularly the peak pressure values in sole 3-4-5th toes and the 1st metatarsus head just under the big toe are higher in footballplayers than the control group. In order the football players to react more quickly to active movements press against front part of foot, try to get balance on front part of foot and establish the exercises and matches rather on quickness and speed and this causes increase in left foot peak pressure revalues.
There is a powerful relation between shaking the body to the right and left through maximal pressure increase in the sole, poor imbalance, decrease and corruption in sensing functions of the sub-members and increase of age (Lord, Mclean, & Stathers, 1992). Foot pressures caused by imbalanced anatomic positions are among reasons for physiologic disorders in human body and muscle joint system. Those abnormal effects repeated continuously are direct reasons for spine disorders and a direct relation was found between the increase in the degree of scoliosis and pressure increase in various sole regions(Park et al., 2009). Those
239 studies indicate the existence of powerful
relations between balance and sole. We found similar result in our study as well and we can say that the changes in the balance food are the results of efforts offer male football players to keep themselves in balance in exercises and matches.
Aydos (2011) suggested in the research on wrestlers that the difference in average maximal pressure comparisons between means, in right foot total, heel medial, 2nd and 3rd metatarsus heads were lower in the control group of the wrestlers. And in left foot, left foot total, heel medial, 2nd 3rd and 5th metatarsus heads were reported to be higher in the control group of the wrestlers (Aydos, 2011). In the study participated by male football players between at the age of 25,5 and 25 males using the Pedar mobile systems football players were made to perform movements containing running, walking, shooting, drip ling and maneuver and the planter pressures of the parts of sole contacting the shoe were measured during the movements. At the end of the study it was detected that the pressure values during running and walking were close to the normal values (Eils et al., 2004). And in basketball players in the comparison of left and right foot average maximal pressure the difference between means, right foot 1stmetatarsus head and big toes was reported to be small and right foot 3rd and 4thmetatarsus heads were more than the control group(Uzun, 2012).It was found in the study that average maximal pressure of football players, in right and left foot 2ndmetatarsus head had smaller value than the control group and left foot 1st metatarsus head was higher than the control group (Table 3).The reason for particularly average maximal pressure values of sportsmen in left foot in 1stmetatarsus head being higher than individuals not performing sports can be defined as being the balance foot. Similar studies indicate that average maximal pressure values affected differently according to different sports branches. In
those studies the findings support our detection that football causes certain changes in the sole of female football players compared to individuals not performing sports.
In the study it is found that among the groups the highest change insole parameters occurred in time pressure integrals. In both right and left foot total and in left foot meaningful differences were detected in 5 regions of left and 2 regions of right sole. In sole time pressure integrals, in right foot 2nd metatarsus head, and in the left foot total heel medial, heel lateral,2,4 and 5th metatarsus heads the time pressure integrals of football players are lower than the control group. However in both right and left foot the values in 3rd metatarsus head were found higher in female footballplayers than individuals not performing sports. Female sportswomen’s timepressure integrals to be lower in general are both expected and required situation. This can be justified by football players ‘changing place quickly and fast from the moment their solecontact the ground, the works done to minimize the reaction periods of the foot staying on the ground and physical properties required by football.
In the study where plantar areas and pressures in the sole in 4 different movements were searched for football players, on 15malefootball players peak pressure and pressure-time integrals in the sole during running, running to the side with maximal speed, jumping and direction change movement with an angle of450 were searched. At the end of the study it was suggested that side parts of middle sole being sloping may be a factor preventing injury of football players and that they could be in harmony with flexing and twisting of the soles. It was further concluded that minimizing the pressure on sole and injury risks should be considered in the design of crampons and special muscle exercises(Wong, Chamari, Wisløff, & Hong, 2007).
240 It is suggested that pressure areas and
time pressure integrals in the sole in different shoes during walking were different (Chen, Nigg, & Dekoning, 1994). Fong et al. (2008), in the research where 15 persons were made to wear cloth shoes and walk on walking way on 5 meters long, dry, sandy, wet and oily wood with 10 trial walks and pressure time integral was assessed and 9 regions of the sole were compared in terms of slippery and non-slippery surfaces, while peak pressure increased by 30%, pressure time integral increased by 79% in big toe, and by 34% in lateral toes. Peak pressure in medial and lateral heel decreased by 20-24%. In walking on oily ground, peak pressure increased from exterior to interior and pressure time integral increased from interior to exterior. Those results and the results of the study indicate of pressure time integral ‘speak pressure walking ground may be affected by other variables (age, height, body weight) (Fong, Mao, Li, & Hong, 2008). In the comparison of basketball players and control group’s left and right feet and pressure–time integral between the means 1st metatarsus head and toe were found to be small in basketball players, and right foot 2nd metatarsus head was more than the control group (Uzun, 2012). An in the wrestlers it was suggested that right foot heel medial, 2nd and 3rd metatarsus head, left foot2nd and 3rd and 5th metatarsus heads were lower than the control group(Aydos, 2011).
In total results in the research of the relation between age, height, body weight and body mass index and average maxima lpressure, peak pressure and pressure–time integral meaningful relations were detected in female football players between right foot Average Maximal Pressure and height and body weight, right foot Time Pressure Integral and height and BMI in related comparisons at the level of (0,01 and 0,05). And Birtane and Tuna suggested that there was a positive relation between
body mass index andtotal plantar force, (r = 0.50, P = 0.00) total contact area (r = 0.33, P = 0.019)in the research conducted on obese and non- obese adults using dynamic pedobarographic method (Birtane & Tuna, 2004). According to the research results, in the comparisons in female football players between age, height, body weight and body mass index and average maximal pressure, peak pressure and pressure–time integral in right and left foot a linear and positive relation was found. According to these results height, one may conclude that body weight and BMI values affected sole pressure values but pressure values were not affected by age.
Researchers suggested that there were intensified and significant relations between the sports branch, movement styles peculiar to the branch, field ground (surface) shoes used and foot disabling & disorders.
Football players suffer from movements forcing lower extremity in foot in long lasting exercises and matches. And this unavoidably changes lower extremity biomechanics of the sportsmen and as a result of this causes changes in standing phases of walking and affects sole pressures. The peak pressure, average maximal pressure, peak pressure and pressure–time integral in 1st
metatarsus heads which are M04 region in front part of foot being higher in female football players than other regions of foot and the control group indicates that football players’ foot’s front interior part was applied higher pressure.
CONCLUSION
In our findings, it was found out that the pressures in front inside parts of soles of football players were higher than both the control group and other regions of their own feet. As a result, Football players’ excessive pressing against their soles in forcing movements in long term exercises and matches are indicated to cause change in the sportsmen’s sole pressure regions and values.
241
REFERENCES
1. Ackland T., Elliot B., & Bloomfield J. (1994). Applied anatomy and biomechanics in sport Melborn: Blackwell scientific publication.
2. Aydos L. (2011). Effect of wrestling on the foot sole of elite wrestlers. International Journal of the Physical Sciences, 6(13), 3143–3154.
3. Bennett PJ., & Duplock, L. R. (1993). Pressure Distribution beneath the Human Foot. Journal of the American Podiatric Medical Association, 83(12), 674-678. 4. Birtane M., & Tuna H. (2004). The evaluation of plantar pressure distribution in obese and non-obese adults. Clinical Biomechanics, 19(10), 1055-1059. doi: DOI 10.1016/j.clinbiomech.2004.07.008
5. Cavanagh P.R., Hewitt Jr, F., & Perry, J. (1992). In-shoe plantar pressure measurement: a review. The foot, 2(4), 185-194.
6. Chen H., Nigg B. M., & Dekoning J. (1994). Relationship between Plantar Pressure Distribution under the Foot and Insole Comfort. Clinical Biomechanics, 9(6), 335-341.
7. Eils E., Nolte S., Tewes M., Thorwesten L., Völker K., & Rosenbaum D. (2002). Modified pressure distribution patterns in walking following reduction of plantar sensation. Journal of biomechanics, 35(10), 1307-1313.
8. Eils E., Streyl M., Linnenbecker S., Thorwesten L., Volker K., & Rosenbaum D. (2004). Characteristic plantar pressure distribution patterns during soccer-specific movements. American Journal of Sports Medicine, 32(1), 140-145. doi: Doi 10.1177/0363546503258932
9. Fong D.T.P., Mao D.W., Li J.X., & Hong Y. (2008). Greater toe grip and gentler heel strike are the strategies to adapt to slippery surface. Journal of biomechanics, 41(4), 838-844.
10. Ford K.R., Manson N.A., Evans B., Myer G.D., Gwin R. C., Heidt R. S., & Hewett T.E. (2006). Comparison of In-Shoe Foot Loading Patterns in Football Players on Natural Grass and Synthetic Turf. Medicine and Science in Sports and Exercise, 38(5), S24-S25.
11. Hagglund M., Walden M., Bahr R., & Ekstrand J. (2005). Methods for epidemiological study of injuries to professional football players: developing the UEFA model. British Journal of Sports Medicine, 39(6), 340-346. doi: DOI 10.1136/bjsm.2005.018267
12. Hawkins R.D., Hulse M.A., Wilkinson C., Hodson A., & Gibson M. (2001). The association football medical research programme: an audit of injuries in professional football. British Journal of Sports Medicine, 35(1), 43-47. 13. Junge A., Langevoort G., Pipe A., Peytavin A., Wong F., Mountjoy M., Dvorak, J. (2006). Injuries in team sport tournaments during the 2004 Olympic games. American Journal of Sports Medicine, 34(4), 565-576. doi: Doi 10.1177/0363546505281807
14. Kanatli U., Yetkin H., Simsek A., Ozturk A.M., Esen E., & Besli K. (2008). Pressure distribution patterns under the metatarsal heads in healthy individuals. Acta Orthop Traumatol Turc, 42(1), 26-30.
15. Kang J.H., Chen M.D., Chen S.C.,& Hsi W.L. (2006). Correlations between subjective treatment responses and plantar pressure parameters of metatarsal pad treatment in metatarsalgia patients: a prospective study. BMC musculoskeletal disorders, 7(1), 95.
16. Kılıçoğlu Ö. (2009). Sporcularda Ayak ve Ayak Bileği Sorunları (in Turkish). Klinik Gelişim, 22(1), 78-87. 17. Knapp T.P., Mandelbaum B. R., & Garrett W.E. (1998). why are stress ınjurıes so common ın the soccer player?*. Clinics in Sports Medicine, 17(4), 835-853.
18. Lord S.R., Mclean D., & Stathers G. (1992). Physiological Factors Associated with Injurious Falls in Older-People Living in the Community. Gerontology, 38(6), 338-346.
19. NCAA. (2007a). 1981–82–2004–05 NCAA
sportssponsorship and participation rates report. Indianapolis, IN: National CollegiateAthletic Association,
14 March 2007, from
http://www.ncaa.org/library/research/participation_rates/1 982-2005/1982_2005_participation_rates.pdf
20. NCAA. (2007b). Injury surveillance system: women’ssoccer 2002–03. Indianapolis, IN: National Collegiate Athletic Association, 14 March 2007, from http://www.ncaa.org/library/research/participation_rates/1 982-2005/1982_2005_participation_rates.pdf
21. NFLPA. (2006). NFL players playing surfaces opinion survey. National Football League Players Association.
22. Park J.H., Noh S.C., Jang H.S., Yu W.J., Park M.K., & Choi H.H.(2009). The Study of Correlation between Foot-pressure Distribution and Scoliosis. 13th International Conference on Biomedical Engineering, Vols 1-3, 23(1-3), 974-978.
23. Patil S., Thatte M., & Chaskar U. (2009). Development of Planter Foot Pressure Distribution System Using Flexi Force Sensors. Sens. Trans. J, 108(9), 73-79.
24. Queen R.M., Haynes B. B., Hardaker W. M., & Garrett W. E. (2007). Forefoot loading during 3 athletic tasks. American Journal of Sports Medicine, 35(4), 630-636. doi: Doi 10.1177/0363546506295938
25. Rad A.G., & Aghdam E.M. (2012). The Medical Insole Effects in Kinetic Patterns of Vertical Jumping for Heading between Flatfoot Male Football Players. Annals of Biological Research, 13(1), 162-169.
26. Rahnama N., Reilly T., & Lees A. (2002). Injury risk associated with playing actions during competitive soccer. British Journal of Sports Medicine, 36(5), 354-359.
27. Stokes I., Hutton W., & Stott J. (1979). Forces acting on the metatarsals during normal walking. Journal of anatomy, 129(Pt 3), 579.
28. Torg J. (1982). Athletic footwear and orthotic appliances. Clin Sports Med, 1, 157-175.
29. Uzun A. (2012). Investigate of the effect of basketball on the sole of professional basketball players. Energy Education Science and Technology Part B: Social and Educational Studies, 4(4), 2611-2620.
30. Warden S.J., Creaby M.W., Bryant A.L., & Crossley K.M. (2007). Stress fracture risk factors in female football players and their clinical implications. British Journal of Sports Medicine, 41, I38-I43. doi: ARTN i38-i43
31. DOI 10.1136/bjsm.2007.037804
32. Wong P., Chamari K., Chaouachi A., Wisløff U., & Hong Y. (2007). Difference in plantar pressure between the preferred and non-preferred feet in four soccer-related movements. British Journal of Sports Medicine, 41(2), 84-92.
33. Wong P., Chamari K., Wisløff U., & Hong Y. (2007). Higher plantar pressure on the medial side in four soccer-related movements. British journal of sports medicine, 41(2), 93-100.
34. Wong P., & Hong Y. (2005). Soccer injury in the lower extremities. British Journal of Sports Medicine, 39(8), 473-482.