1
Comparing Photocatalytic Activity of ZnO and Nanospherical ZnO/Bentonite Catalyst: Preparation, Structural Characterization and their Photocatalytic Performances using Oxytetracycline Antibiotic in Aqueous Solution
Ali İmran VAİZOĞULLAR
Vocational School Health Care, Medical Laboratory Programme, Muğla Sıtkı Koçman University, Muğla, Turkey. e-mail: [email protected]. Phone: +9 252 211 55 30
Received July 31, 2017; Accepted November 17th, 2017.
ISSN 1870-249X
2
Abstract. Photocatalytic degradation of Oxytetracycline (OTC) in aqueous solution was performed using pure ZnO and ZnO/Bent composites. Both catalysts were synthesized trough a simple one-step chemical precipitation method. The prepared samples were characterized using SEM-EDAX and XRD analysis. Due to the
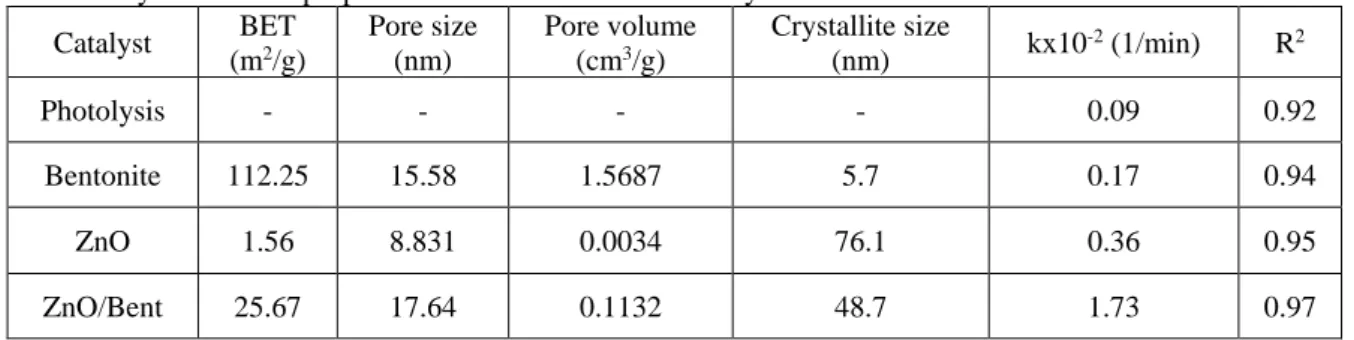
immobilization of ZnO nanospheres upon bentonite surface, 25.67 m2 g-1 of specific surface area was obtained
for the ZnO/Bent which lower than the specific surface area of the raw bentonite (112.25 m2 g-1). ZnO/Bent
catalyst showed the best photocatalytic performance than ZnO for OTC degradation under UV light.
Keywords: Organic contaminants; Pharmaceuticals; Photo-enhanced toxicology; ZnO/Bentonite catalyst; HRMS analysis.
Resumen. Se desarrolló la fotodegradación catalítica de oxitetraciclina (OTC) en disolución acuosa usando ZnO puro y compositos de ZnO/Bentonita. Ambos catalizadores se sintetizaron mediante un método simple de precipitación en un solo paso. Las muestras se caracterizaron por SEM-EDAX y análisis XRD. Se obtuvo un área superficial para ZnO/Bent de 25.67 m2 g−1 que es menor que para ZnO (112.25 m2 g-1) debido a la
inmovilización de las nanoesferas de ZnO en la superficie de la bentonita. ZnO/Bent mostró un mejor desempeño como fotocatalizador que ZnO en la degradación bajo luz UV.
Palabras Clave: contaminantes orgánicos; compuestos farmacéuticos: toxicología foto mejorada: catalizadores ZnO/Bentonita; análisis HRMS.
3
Introduction
In recent years, antibiotics in the aquatic medium have largely increased [1].The growth of aquaculture industry has supported by some applications which damaging to human health [2].Antibiotics can be seen due to poor removal ability in various water sources such as surface water, sea water and drinking water [3,4]. Its chemical stability and low biodegradability in the water medium is a priority problem related to these organic compounds in waste water [5]. Several researchers have expressed that antibiotics, for example norfloxacin, affect to environment negatively. In addition, they can cause allergy and toxicity and lead to the improving of antibiotic-resistant bacteria [1,2]. OTC negatively affects the human health. For example, tetracycline in blood plasma is transported as a calcium complex that forms a complex, that once linked to magnesium found in the cells of bacteria, is linked to the ribosome. In this case, it is known that the binding of magnesium to the ribosome complex inhibits protein synthesis by triggering bacteriostatic effect but does not kill microorganisms [6]. Also, all tetracyclines have the same spectrum and mechanism of action, adverse effects and similar tolerances by resilient organisms. Hämäläinen and co-worker [7] have expressed that there was no significant effect of oxytetracycline on plasma total or free T plasma hormones. In addition, they suggested that enterohepatic recycling and intestinal metabolism in estrogens may be important in men. The mechanism of action of antibiotics on estrogen metabolism probably resulted in reduced hydrolysis of estrogen conjugates by intestinal contents of P-glucuronidase, estrogen conjugate aglycones reabsorption and fecal loss of steroids. Therefore, to decrease the amount of such organic materials in an aquatic medium, several techniques have been developed. One of them is advance oxidation process (AOPs). Among the different AOPs, heterogeneous semiconductor materials have been used and TiO2 is the most popular catalyst for degradation of organic molecules [5].ZnO
has been used as photo-catalyst for multiple samples such as viruses, dyes, pesticides and volatile organic compounds (VOC). Photocatalytic effect of ZnO depends on their size and morphology [8]. Fang and co-worker were expressed that spherical ZnO is more active than flower-like shape of ZnO. Therefore, morphologic structure of ZnO has an important role to efficient degradation in photocatalytic reaction [9].
Clay minerals have been largely applied for removal of toxic materials from waters, and likely it is an optimal alternative material for studied in these days [10,11].Uğurlu and Karaoğlu (2011) [12]have implied that clay assisted metal oxides have enhanced photoactive materials than bare metal oxide. Immobilization of ZnO in a clay surface can cause long time reusability. In addition, the adsorption capacity of clays also generates better catalytic efficiency as compared to bare nanoparticles producing bifunctional nature for these composites [13]. Bentonite clay has multiple advantages, for example it is inexpensive, nontoxic and widely available and is mainly composed of montmorillonite which is an aluminosilicate mineral [14]. Bentonite exhibits high adsorptive ability for organic dyes via an ionic exchange, and this property is an advantage for the photocatalytic reaction when a semiconductor is fixed onto a clay surface [15,16].
In this study ZnO and ZnO/Bent nanospherical catalysts were synthesized via chemical precipitation method and their photoactivity was investigated. Oxytetracycline (OTC) antibiotic was chosen as a model pollutant. The catalysts were characterized by SEM, and XRD advanced analytical techniques. Surface properties were evaluated with BET results. Solution pH, catalyst dosage, and initial OTC concentration were selected as operational parameters. Our focus in this paper is on the comparative study by synthesizing a clay/catalyst composite. Its degradation yield and most efficient degradation conditions were investigated. Our study presents an academic understanding of a new effective catalyst structure.
Results and Discussion SEM and EDAX analysis
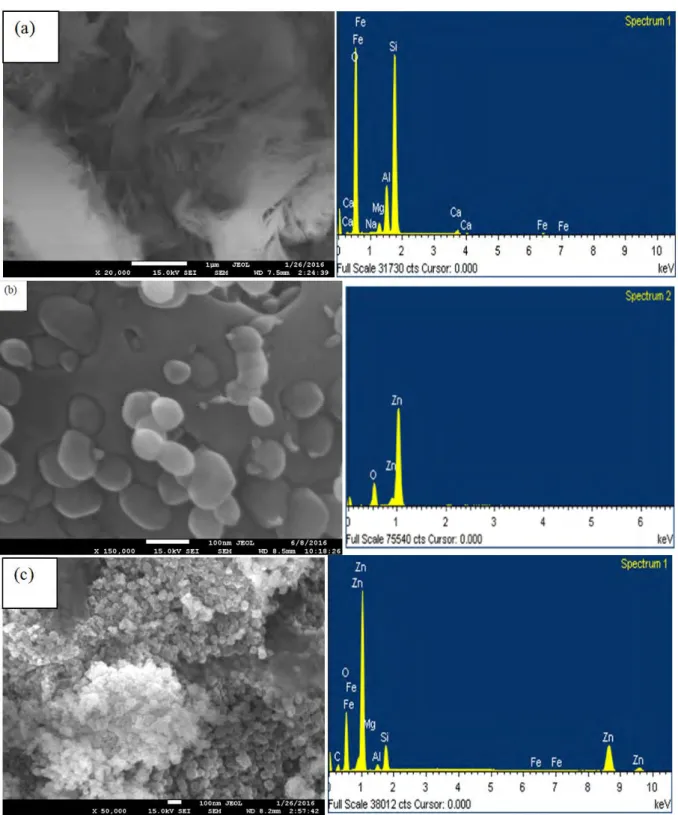
In order to explain morphology and shape of the catalysts, SEM and EDAX analysis were carried out. Fig. 1 shows SEM image of Bentonite, ZnO and ZnO/Bent particles respectively.
From the Fig. 1(a), raw bentonite exhibits cottony-like and amorphous structure. Its particle size is not determined from the SEM image. As-synthesized ZnO particles have irregular shapes, jagged and uneven surface structure; its particle size is 70-80 nm approximately (Fig. 1b). Nearly spherical ZnO particles can be clearly seen on the bentonite surface (Fig. 1c). The particle size of ZnO on bentonite is 40-50 nm approximately (Fig. 1c). The size of the bare ZnO particles is larger than that of ZnO nano-sphere particles on the Bentonite surface. This result indicates that the immobilization of ZnO nanoparticles on the surface of bentonite led to the formation of nanoparticles with lower particle size [17]. Khataee and coworkers have obtained similar results using TiO2 nanoparticles on the surface of montmorillonite clay [18]. In addition, Kocí and coworkers also have
expressed that the bentonite clay can modify the surface properties of the catalyst (e.g acidity or basicity) and thus it prevents the largely agglomeration of the synthesized catalyst [19]. Decreasing the particle size of
ISSN 1870-249X
4
ZnO/Bentonite provides higher surface area and consequently, higher active sites on the catalyst. EDAX analyses of ZnO and nanosphere ZnO/Bent particles reveal the presence of target components.
Fig. 1. SEM images and EDAX analysis raw Bentonite (a) ZnO (b) and ZnO/Bent (c)
(a)
5
XRD analysis
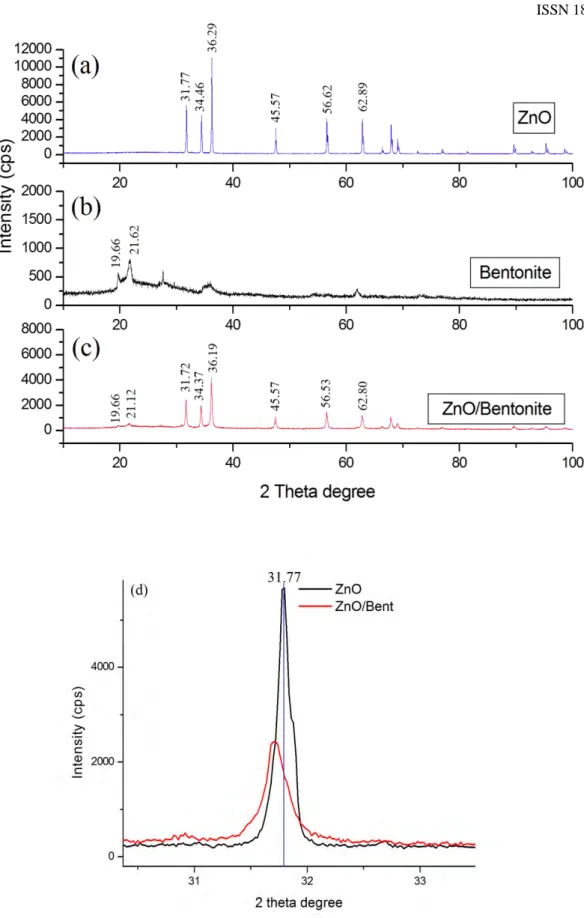
Fig. 2 represents the XRD pattern of raw ZnO (a), bentonite (b) and ZnO/Bent (c) catalyst respectively. The diffraction peaks around at 2𝜃𝜃 = 31.77o, 34.46o, 36.29o, 47.57o, 56.62o 62.89o have been attributed to the
hexagonal wurtzite phase of ZnO (JPDS 36-1451). The strong and narrow diffraction peaks confirm that the ZnO was well in crystallinity (Fig. 2a). Fig. 2(b) shows the XRD pattern of bentonite clay with main peaks at 19.66°,
21.62°2𝜃𝜃 degree. The XRD diffraction peaks of ZnO/Bent catalyst shows both ZnO and Bentonite peaks. They
are 10.12°, 19.66°, 21.78°, 31.72°, 34.37°, 36.19°, 47.47°, 56.53° and 62.80° 2𝜃𝜃 values (Fig. 2c). These results confirm that the wurtzite structure of ZnO did not change during the synthesis of ZnO/Bent catalyst. In addition, the lattice parameters for the ZnO catalyst in the ZnO/Bent system are calculated as 𝑎𝑎 =0.325 nm and 𝑐𝑐 =0.532 nm (Standar values are 𝑎𝑎 =0.326 nm and 𝑐𝑐 =0.522 nm). The obtained values slightly deviate from the standard values which implies an intra-granular coupling between ZnO and bentonite. The (100) peak of ZnO/Bent shifted slightly towards a lower angle side when compared with pure ZnO which indicates formation of intercalated composites (Fig. 2d) [12]. Furthermore, the main peaks of bentonite (at 2𝜃𝜃=19.66° and 21.78°) remained with the same form; this implies that the main structure of bentonite is intact after ZnO immobilizing. When compared to the XRD spectrum of bentonite and ZnO/Bent, the intensity of some characteristic peaks of bentonite disappeared, this is because the bentonite surface was covered by ZnO effectively (Fig. 2c) [20]. The sharp XRD diffraction peaks for ZnO/Bent catalyst shows high crystalline and efficient incorporation of ZnO into Bentonite structure [17].
ISSN 1870-249X
6
Fig. 2. (a)XRD spectrum of ZnO, (b)Bentonite, (c) ZnO/Bent and (d)shifting of the (1 0 0) peak.
The size of particles was calculated using Eq 1. The peak intensity and full-width at half maximum (FWHM) values were determined from the XRD diffraction peaks. FWHM values which located in Debye-Scherer formula are derived from the most intense peak for the catalysts. Average crystallite size of bentonite, ZnO and ZnO/Bent was found 5.75, 80 and 45 nm respectively. This implies that the crystallite size of ZnO in the
12000 10000 8000 6000 4000 .- 2000 Cl) 0 a.. (.)
-
_z-
2000·
en
C 1500 (l)-
C 1000 500 0 8000 6000 4000 2000 0(a)
20(b)
20(c)
'°
~'°
.
~N 20 (d) 4000en
a. ~-~
rJ) C: 2 2000 C: 0°'
N \0 M t--r--:'°
- -st "''Sf' M '.:'.:: \0 ~ r-C-')_,,,
M'Sf' M 31 40 40 40 N°'
r--'°
~ ": \0 N'°
.,.,
"'
-st 60 60 r-- M 0 ":"'
00"'
\0"'
c--i -st'°
602 Theta degree
31 77 --ZnO - -ZnO/Bent 32 2 theta degreeizno
l
80 100I
Bentonite
I
80 100ZnO
/
Bentonite
80 100 337
ZnO/Bent system was lower indicating a crystalline defect (slightly lower crystallinity) which reveals higher FWHM value in the ZnO/Bent structure. This shows that Bentonite clay acted both as a supporting material and as a size controlling material. This is in good agreement with the XRD results.
Fig. 3 shows adsorption-desorption isotherms and BJH pore size distribution of synthesized catalysts. As shown in this figure the shape of the isotherm is similar to type IV isotherm according to the IUPAC classification. The isotherm of ZnO showed H1 hysteresis loops in the relative range between 0.75-1.0 which is mainly due to the sorption of mesoporous by nitrogen via capillary condensation (Fig. 3b). For ZnO/Bent, the isotherm exhibited type H3 hysteresis loop confirming some degree of mesoporosity which originated from stacking defects of clay at high relative pressure between 0.5 and 1.0 value (Fig. 3d). In addition, this usually demonstrates an aggregation of spherical particles or adsorbents containing slit pores [20]. Also, pore size distribution of all catalysts suggests an increasing of adsorption ability of ZnO/Bent catalyst than that compared to ZnO. BET surface area is reported in Table 1. It is clear that BET surface area of ZnO/Bent catalyst is higher than that of ZnO. Decreasing the surface area of bentonite clay confirms that ZnO particles, which were generated by chemical precipitation method, deposited on the bentonite surface efficiently. This result could be attributed to a good dispersion of ZnO and the pore blocking due to the nanosize and homogeneous morphology of ZnO particles. the pore size distribution of Bentonite and ZnO/Bent samples shows that bentonite clay has higher pores than that of the ZnO/Bent catalyst. The most prevalent pore size was 35-40 nm; few pores were greater than 80 nm. These results are likely to be related to blocking of the macropores and some larger mesoporous by ZnO particles, resulting in the smaller mesoporous [21]. When compared with pure ZnO and ZnO/Bent catalyst, the surface area of ZnO/Bent is 25 times larger than pure ZnO. In this case ZnO/Bent displays higher adsorption consequently higher degradation efficiency.
ISSN 1870-249X
8
Fig. 3. Pore size distribution of bentonite and ZnO/Bent (a) Adsorption-desorption profile of Bentonite (b), ZnO (c) and ZnO/Bent (d) samples
Table 1. Physiochemical properties and kinetic results of catalyst Catalyst BET (m2/g) Pore size (nm) Pore volume (cm3/g) Crystallite size (nm) kx10 -2 (1/min) R2 Photolysis - - - - 0.09 0.92 Bentonite 112.25 15.58 1.5687 5.7 0.17 0.94 ZnO 1.56 8.831 0.0034 76.1 0.36 0.95 ZnO/Bent 25.67 17.64 0.1132 48.7 1.73 0.97 UV-DRS Analyses
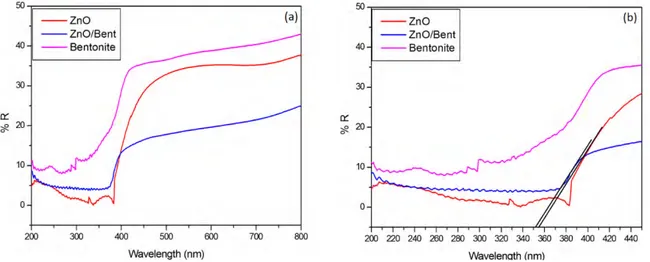
Fig. 4 shows UV-DRS analysis of Bentonite, ZnO and ZnO/Bent catalyst. As can be seen from the Fig. 4, pure ZnO and ZnO/Bent samples have a strong absorbance between 300-400 nm. Raw bentonite clay exhibited little adsorption in the range of visible light. The absorption spectrum of ZnO/Bent is slightly shifted to lower wavelengths. The edge of the band gap of ZnO and ZnO/Bent is 354 and 352 nm, respectively. The band gap
0.20 (a) 0.18 - zno/Bent
-
~
4:
____._ Bent ~ 0.16 ..,E 0.14 2-<V O 12•
E -:Jo
0.10I
~
> <V 0.08 .... 0 a.I
o.oo~
-g> 0.04I
.
_Ji
/
-0>
0.02 • I -0•
•
0.00 0 20 40 60 80 100 1208 0 - - , - - - 7
(d) 70I
-
ZnO/BentI
i:L 60 I-f/) ~ 50 7= :; 40 <V .0g
30 'O <( z, 20 :g (tJ8
10 0.2 0.4 0.6 Relative Pressure (p/p0)•
0.8 1.0 i:' n Ol[
CJ <V C .... 0"'
0 ::( 2:' ~ (tJ :::, J 00 80 70 60 50 40 30 20 10 120, - - - 7 (b)•
100 - Bentonite 80 60 40 20 o-t:~::;:~~0-2---.--7o.4----.--~o.~e-.--o~.s-;;---.-;1·0 o.o Relative Pressure (p/p0 ) (c) 1- z n ol ooJ_o~~--=--or.2--,---oT.4-~-70.-6--r---::o~.8---,-;1.o Relative Pressure (p/p0)9
energy, which can be calculated from the onset of the absorption edge (𝜆𝜆𝑔𝑔) using the 𝐸𝐸𝑔𝑔= 1240 𝜆𝜆
𝑔𝑔
� formula, is 3.51 and 3.53 eV for the ZnO and ZnO/Bent catalysts, respectively (Slight blue shift). These results are likely to be related to particle confinement effect which is originated from the immobilization of nanosize ZnO [22, 23].
Fig. 4. UV-DRS spectra of Bentonite, ZnO and ZnO/Bent catalyst ((expanded scale (b))
Operational Parameters and Photo-catalytic Studies Effect of pH
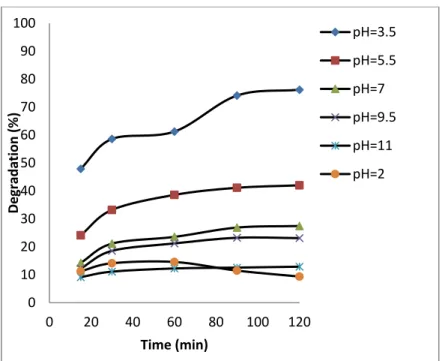
The influence of pH was conducted from 3 to 11 adjusted with HCl (0.1N) and NaOH (0.1N) solutions. For this, 50 mL of OTC (10 mg L-1) and 0.1 g of ZnO/Bent catalyst were added and started the photocatalytic reaction in
the UV reactor at different pH. The obtained results are shown in Fig. 6. It can be seen from the Fig. 6, that the maximum degradation rate was found at pH=3.5. The isoelectric point of OTC is about 5.4 [24] and at pH=2-3, OTC is fully protonated as [H3OTC]+ form. Fig. 5 shows isoelectric titration graph of ZnO/Bent catalyst. It can
be seen that the surface charge of ZnO/Bent catalyst is in its negative form almost at every pH value. This indicates a strong electrostatic attraction between the catalyst surface and the OTC molecules at lower pH values. This attraction caused an increase in the degradation efficiency of the catalyst at pH=3.5. The existing form of [OTC] is [H3OTC]+ (1%), [H2OTC] (98%), [HOTC]- (1%) at pH=5.5, [H2OTC] (76%), [HOTC]- (24%) at pH=7,
H2OTC (8%), [HOTC]- (88%), [OTC]2- (4%) 7 at pH=8.5 and HOTC- (7%), [OTC]2- (93%) at pH=11 [25]. This
implies that the surface charge of OTC is negative when the pH is increased. In this case, electrostatic repulsion occurred between the catalyst surface and OTC molecules at high pH value. Thereupon, low adsorption and degradation are observed at high pH values. In addition, when ZnO dissolution is considered at highly acidic conditions, ZnO reacts with HCl and transforms to Zn2+ and H
2O [26].In contrast, at high alkaline conditions
ZnO suspension is in equilibrium with [Zn(OH)3-] and [Zn(OH)42-] ions [27]. Because of that, the degradation
efficiency may be obtained as minimum values at high and low acidic conditions. Furthermore, the obtained degradation percentage at above pH=7 may come from photolysis; the increase in molar absorptive of [OTC] at 254 nm confirms this phenomenon [28].Because negatively charged OTC molecules tend to make possible [OTC] photolysis, they revealed a smaller role of photo-catalysis at such higher pH levels (Table 2) [29].
50 50
- -ZnO (a) - -ZnO (b)
- -ZnO/Bent - -ZnO/Bent
40 - -Bentonite 40 - -Bentonite 30 30 a:: a:: ,F. 20 ~ 20 0 10 10 o o 200 300 400 500 600 700 800 200 220 240 260 200 300 320 340 360 380 400 420 440
ISSN 1870-249X
10
Fig. 5. Isoelectric titration graph of ZnO/Bent catalyst at different pH value
Fig. 6. Effect of pH on degradation of OTC by ZnO/Bent (experimental conditions: OTCo=10 mg L-1, catalyst
dose=0.1 g, λ=251 nm)
Table 2. Molar absorption coefficients at 254 nm of OTC at different pH values
pH 𝜀𝜀 (M-1cm-1) 3.5 23586.1 5.5 18223.5 7 19476.4 0 10 20 30 40 50 60 70 80 90 100 0 20 40 60 80 100 120 Deg ra da tio n ( % ) Time (min) pH=3.5 pH=5.5 pH=7 pH=9.5 pH=11 pH=2 0 -5 -10
>
-15 ;S 1§ -20 c <I> 0 Q_ -25 <II Q) N -30 -35 -40 2 4 6 8 10 pH+
-11
9.5 20152.1
11 21114.3
Catalyst dosage and initial concentration
In order to determine optimum catalyst dosage, 0.1-1 g of ZnO/Bent and 50 mL of OTC (10 mg L-1) were added
to UV reactor for 120 min. From the results, the degradation rate increased with the concentration of ZnO/Bent up to 0.2 g, and then decreased (Fig. 7). This can be explained if, due to light scattering, the entrance of UV light decreased at high catalyst concentration. The reduction of light intensity did not inhibit an increase of electron (𝑒𝑒−) hole (ℎ+) recombination rate which is responsible for the degradation process. Therefore, lower light transparency caused by a reduction of 𝑂𝑂𝑂𝑂• radicals which, in turn, decreased degradation efficiency [30]. Fig. 8 shows the efficiency of degradation at initial OTC concentration. From the Fig. 8, it can be observed that maximum degradation was obtained at 20 mg L-1 of catalyst concentration. Further increase in OTC
concentration resulted in no change in its degradation. This implies that when the further amount of OTC is added, UV light was adsorbed by OTC instead of the active sites of the catalyst [31].
Fig. 7. Effect of catalyst dosage on degradation of OTC by ZnO/Bent (experimental conditions: (OTCo=10 mg
L-1 t=120 min msolid
mliquid=
0.1 g
50 mL and pH=3.5)
Fig. 8. Effect of initial concentration on degradation of OTC by ZnO/Bent (experimental conditions: msolid
mliquid=
0.1 g
50 mL and pH=3.5 and t=120 min)
0 20 40 60 80 100 0 0,2 0,4 0,6 0,8 1 Deg ra da tio n ( % ) Catalyst Dosage (g) 0 20 40 60 80 100 0 5 10 15 20 25 Deg ra da tio n ( % ) Initial cons. (mg L-1)
ISSN 1870-249X
12
Kinetic and photocatalytic studies
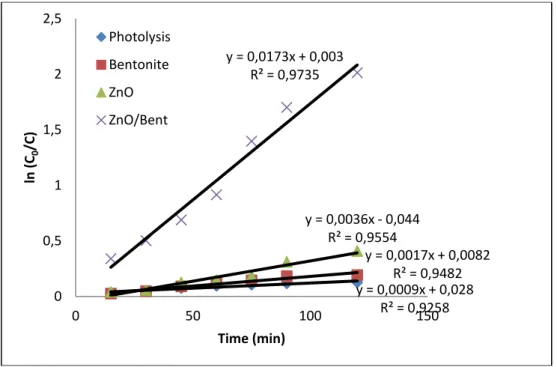
The pseudo first order equation can be used to explain the kinetics of photocatalytic degradation of OTC. The first order kinetic rate k (1/min) for OTC degradation can be calculated by plotting ln (𝐶𝐶𝐶𝐶
𝐶𝐶) versus time (t). In
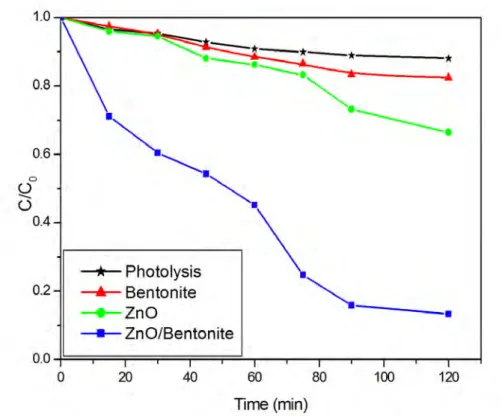
this investigation, the photo-degradation of OTC was evaluated at the obtained optimal conditions. The kinetic results were in good agreement with pseudo first-order isotherm for both ZnO and ZnO/Bent catalysts (Fig. 9). The correlation constants for the lines are calculated to be R2=0.92, 0.94, 0.95 and 0.97 for photolysis of OTC,
bentonite, pure ZnO and ZnO/Bent, respectively; in addition, appearing rate constant value of ZnO/Bent is approximately 5 times faster than for bare ZnO (Table 1). Bentonite clay showed very low catalytic activity as well as OTC exhibited little photolysis effect under UV light. The obtained results, which relate to direct photolysis of OTC, are consistent with previous study by Shaoujun and co-worker [32] and Piraya and co-worker [33]. These results reveal that ZnO/Bent was more photoactive than bare ZnO. It highly degraded OTC molecules in a period of 120 min. It can be attributed to textural properties of ZnO/Bent catalyst when considered the surface area and pore volume. These properties gain a photocatalytic activity superior to the pure oxide semiconductor.
Fig. 9. Degradation of OTC using ZnO and ZnO/Bent catalyst
0.8 0.6 a 0
0
0.4 ~ Photolysis 0.2 _ . _ Bentonite ~ ZnO ---ZnO/Bentonite - - - • 0.0 -+0~=;==20r====r===,=40==,=~60~---.~8~0:----.--~100~---~1~20;---Time (min)13
Fig. 10. Plots of ln (𝐶𝐶𝑜𝑜
𝐶𝐶)versus the irradiation time (t)
Effect of Scavengers
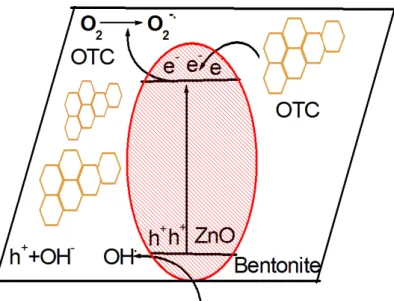
In order to explain charge transfer pathway and main reactive species, potassium iodide (KI), isopropyl alcohol (IPA) and ascorbic acid (AA) were used as hole (ℎ+), hydroxide radical (𝑂𝑂𝑂𝑂•) and superoxide (𝑂𝑂2−•) radical scavengers respectively [34]. Fig. 11 shows the effect of scavengers using ZnO/Bent catalyst on the OTC degradation. It can be seen that catalytic degradation largely decreased when KI and AA scavengers were used. When IPA was used, degradation efficiency tiny decreased implying less effective on OTC degradation. This confirms that hole (ℎ+) and superoxide radical (𝑂𝑂2−•) is main oxidative species on OTC degradation. According to the above results the schematic illustration of the oxidative species pathway was shown in Figure 12.
Fig. 11. Effect of different scavengers on degradation of OTC in the presence of ZnO/Bent photocatalyst y = 0,0009x + 0,028 R² = 0,9258 y = 0,0017x + 0,0082 R² = 0,9482 y = 0,0036x - 0,044 R² = 0,9554 y = 0,0173x + 0,003 R² = 0,9735 0 0,5 1 1,5 2 2,5 0 50 100 150 ln (C0 /C) Time (min) Photolysis Bentonite ZnO ZnO/Bent 0 10 20 30 40 50 60 70 80 90 100 No scavenger IPA KI AA Deg ra da tio n Ef fic ien cy (% )
ISSN 1870-249X
14
Fig. 12. Schematic illustration of oxidative species in the catalytic degradation process
Fig. 13 shows UV-vis absorption spectra of OTC samples at different degradation times. The initial OTC solution shows two absorption peaks and the prominent peak is 251 nm. The peak at 251 nm decreases gradually and almost arrives to zero absorbance intensity within 120 min. This confirms that OTC molecules were highly degraded using ZnO/Bent catalyst. To reveal mineralization of OTC some oxidant was used during the degradation process. The catalytic reaction conditions did not change (OTCo=20 mg L-1, msolid
mliquid=
0.2 g 50 mL and
pH=3.5). The degradation of OTC was studied by adding hydrogen peroxide (H2O2), and potassium
peroxodisulfate (K2S2O8) together with sodium carbonate (Na2CO3) as pH buffer. The obtained results are
reported in Table 3. These oxidants produce the photo-activated formation of OH, SO4- and CO3-/HCO3 radicals
during the degradation reaction. It was found that most active species were H2O2 followed by K2S2O8 and
Na2CO3. Lower effect of Na2CO3 may be attributed to basification of the reaction pH [35]. From Fig. 13, the
absorbance of OTC at 251 nm decreased. Also, the percentages of chemical oxygen demand (COD) reduction were observed as 73.6, 84.3, 76.7 and 61.6 % for no oxidant, H2O2, K2S2O8, Na2CO3 respectively. These results
indicated that high mineralization was carried out within 230 min. The more detailed investigation was carried out with High Resolution Mass Spectroscopy (HRMS) analysis.
0 2 - 0 · ·
OTC
2@Y
15
Fig. 13. UV-Vis spectra of OTC on ZnO/Bent at different times (OTCo=20 mg L-1, msolid
mliquid=
0.2 g
50 mL and pH=3.5)
Table 3. The effect of different oxidants for degradation of OTC using ZnO/Bent under UV light
Oxidant Removal (%) Time (min)
Approximately COD Reduction (%)
No oxidant 99.8 230 73.6 H2O2 99.1 60 84.3 K2S2O8 98.5 90 76.7 Na2CO3 99.5 95 61.6
HRMS (High Resolution Mass Spectroscopy) analyses
Fig. 14 shows HRMS analyses of degradation results for 30, 60, 120 min respectively. As can be seen from the Fig. 14(a), The main intermediate at m/z 338.3418 was quickly formed, reachinged the maximum amount after 30 min of irradiation and then was largely degraded after 120 min of irradiation (Fig. 14c). In addition, new degradation intermediates are seen for 60 and 120 min of degradation time (m/z 149, 105, 114). It can thus be suggested that the species of main intermediates increase time dependently and are almost converted to nontoxic intermediates within 120 min. Moreover, the following ions were monitored too: m/z 107.9603, m/z 166.9432. The final molecules that can be identified in the proposed HRMS results were maleic acid and other carbonyl compounds. These results show that ZnO/Bent catalyst is an efficient photoactive material for the decomposition of organic molecules which have high molecular mass under optimal conditions. The possible degradation intermediates are given in Fig. 14.
1,50
- -
0min 1,25 - - 15min 251 nm - - 30min - - 60min 1,00 - - 90min - -120 min 1/) 0,75 .0 <( 0,50 0,25 0,00 200 300 400 500 600 Wavelength (nm)ISSN 1870-249X
16
Fig. 14. HRMS results of different degradation times for 30 min (a), 60 min (b) and 120 min (c)
Experimental
Preparation of ZnO, ZnO/Bent nanosphere
ZnO particles were synthesized by chemical precipitation method. 13 g Zn(Ac)2.6H2O (Merck ≥97%) was
dissolved in 100 mL of H2O (Solution A). Then 0.1 molL-1 of NaOH solution (Carlo Erba 97%) was added drop
by drop to the solution A and stirred for 4 hours. After this time, it was filtered and washed with distilled water, dried at 80oC for 4 hours and calcined at 300oC for 3h.
In order to synthesize ZnO/Bent catalyst, raw bentonite (obtained from the Ordu region of Anatolia Turkey) was washed to remove contaminants and then dried in oven 80 °C for 4 hours. Approximately 15 g of 150 mesh size of Bentonite was added to Zn(Ac)2.6H2O and H2O mixture (13 𝑤𝑤
100 𝑉𝑉) and stirred for 3 h (Solution B). Then, 0.1 mol
L-1 of sodium hydroxide (NaOH) solution was added drop by drop to solution B. The obtained
Zn(OH)2/Bentonite powders were dried in an oven for 4 h. The powders were calcined at 300 °C for 3 h. The
dried ZnO/Bent particles were then used for the photocatalytic experiments. The mole ratio of ZnO to Bentonite clay (ZnO/Bent) was approximately (1/1).
Characterization
The crystalline phase was examined by XRD (Rigaku Dmax 350) using copper-Kα radiation (λ = 0.154056 nm). The microstructure and shape of the particle were investigated using SEM (JEOL JSM-7600F). The elemental analyses were determined with (JEOL JSM-7600F) EDAX analyzer with SEM measurement. The Brunauer-Emmett-Teller (BET), pore volume, and pore size were measured using ASAP2010 (Micromeritics Instrument Corporation, USA) with N2 adsorption at 77.35 K. The isoelectric point of ZnO/Bent was obtained with a
zetasizer (Nano S, Malvern Instruments). DRS analysis was performed using Perkin Elmer Lambda 35
UV-100 (a) ~ 64 9371 0 60 100 (b) 338.3418 105·9635 114 0911 149.9533 139 9248 98.9621 d ,, I 80 100 120 140 105.9630
y0
107 9603 0 114 0908 100.0750 80.9322 151 9503 153.9491 166.9432 264 8483 195 9949 220.8588 245.0768 313.2732 288 2896 353 2664 381 2977 354.2706 415.2408439.2067 160 180 200 220 240 260 280 300 320 340 360 380 400 420 440 460 480 149.9525¢6
0 166.9429 170.9392 2119829222.0103 285.1128 264.8476 288.2891 299 8403 338.3408 339.3444o
--~-~-~
---
-~
----
--
~
---100 105.9630 149.9525 (c)y0
0 107 9603 OH OH 0¢0
"
¢6
'I'- 114 0908 OH 0 100.0750 166.9429 0 84.9373 80.9322 84.9592 170 9392 017
Vis Spectrophotometer. In addition to the experiments, in order to identify OTC, decomposition intermediates were also evaluated. For that purpose, UV-visible spectroscopy and HRMS (High Resolution Mass Spectroscopy) analyses were performed for 30, 60, 120 min degradation time. HRMS analyses were carried out using a Waters SYNAPT G1 MS system with experimental conditions as; Sampling cone 30 V, extraction cone 4 V, source temp 80 °C, desolvation temperature 250°C and capillary voltage 2 kV.
The crystallite size of all catalysts was calculated using Scherrer equation
θ
β
λ
Cos
B
d
2 / 1=
(1)Where d is the average particle size, B is the Scherer constant (0.91), λ is the wavelength of the X-Ray (0.154 nm), β1/2 is full width at half maximum of the diffraction peak and θ is the diffraction angle. Surface physical
properties of prepared catalyst including pore volume, surface area, and surface morphology have been examined and the results are summarized in Table 1.
Photocatalytic Experiments
In the photolytic experiments, a specially designed UV reactor with light a source (a series of six Philips UV lamps 20 W having a center wavelength of 254 nm positioned at 15 cm a distant over the sample surface) at ambient temperature and atmospheric pressure was used. The photocatalytic studies were performed as follows: A stock solution of OTC (10 mg L-1) was freshly prepared and 50 mL portion and 0.1 g of catalyst were
transferred into the UV reactor and stirred for 60 min in dark to allow adsorption/desorption equilibrium. After degradation began, 1 mL of sample was withdrawn and filtered to determine degradation rates. The absorbance of the supernatant was determined by Dr Lange 2800 Spectrophotometer. The spectrophotometric measurements at the maximum wavelength of 251 nm were used to monitor the degradation rate of OTC. The degradation percentage of OTC was calculated at below equation:
%𝐷𝐷𝑒𝑒𝐷𝐷𝐷𝐷𝑎𝑎𝐷𝐷𝑎𝑎𝐷𝐷𝐷𝐷𝐷𝐷𝐷𝐷 =𝐶𝐶𝑜𝑜−𝐶𝐶
𝐶𝐶𝑜𝑜 × 100 (2)
Where Co is the initial concentration of OTC and C is the OTC concentration at the time. The UV-Vis absorption was measured by Shimadzu 1601 spectrophotometer. The molar absorption activity of OTC at 254 nm is calculated this formula 𝜀𝜀𝑂𝑂𝑂𝑂𝐶𝐶= 𝐴𝐴 (𝑐𝑐.𝑙𝑙)� where 𝐴𝐴 measured absorbance at 254 nm, 𝑐𝑐 is the molar concentration and 𝑙𝑙 is the cell path (0.5 cm) [16].
Conclusion
ZnO and ZnO supported bentonite (ZnO/Bent) photo-catalyst were synthesized using a chemical precipitation method and characterized by FTIR, SEM, and XRD. The photocatalytic degradation of OTC was investigated using these catalysts. ZnO/Bent showed higher degradation efficiency than pure ZnO. The photocatalytic data followed a first-order kinetic model. The optimal reaction conditions were 3.5, 0.2 g and 20 mg L-1 for pH,
catalyst dosage and initial OTC concentration, respectively. This work demonstrates that pH is an important parameter for OTC degradation. At high pH value, photolysis may be taking place instead of the photocatalytic degradation. Possible degradation products were proposed according to HRMS analysis data. Under the optimum reaction conditions, 87% degradation was obtained within 120 min of UV light.
Acknowledgement
This manuscript is supported by Mugla Sitki Kocman University coordination of scientific research projects 15/139.
References
1. Chen, M.; Chu, W. J. Hazard. Mater. 2012, 219, 183.
2. Palominoss, R.; Freer, J.; Mondaca, M.A.; Mansilla, H.D. J. Photoch. Photobio. A, 2008, 193, 139. 3. Batt, A.L.; Bruce, I.B.; Aga, D.S. Environ. Pollut 2006, 142, 295.
4. Xu, W.H.; Zou, S.C,, Li, X.D.; Liu, Y.C. Environ. Pollut, 2007, 145, 672. 5. Fatimah, I.; Wang, S.; Wulari, D. Appl. Clay. Sci 2011, 53, 553.
6. Borghi, A. A.; Palma, M. S. A. Braz. J.Pharm. Sci. 2014, 50(1), 25. 7. Hämäläinen, E.; Korpela, J. T.; Adlercreutz, H. Gut 1987, 28(4), 439.
ISSN 1870-249X
18
8. Lin, J.; Wang, D.; Chen, D.; Ge, Q.; Ping, G.; Fan, M.; Qin, L.; Shu, K. Environ. Prog.Sustain. Energ 2015, 34,1.
9. Fang, L.; Zhang, B.; Li, W.; Li, X.; Xin, T.; Zhang, Superlattices and Microstructures 2014, , 324. 10. Abollino, O.; Giacomino, A.; Malrino, M.; Mentasti, E. Appl. Clay Sci 2008, 227.
11. Bhattacharyya, K.G.; Gupta, S.S. Adv. Colloid Interf. Sci 2008, 140, 114. 12. Uğurlu, M, Karaoğlu, M.H. Chem. Eng. J ,2011, 166, 859.
13. Meshram, S.; Limaye, R.; Ghodkec, S.; Nigama, S.; Sonawanea, S.; Chikate, R. Chem. Eng. J, 172, 1008.
14. Zhang, S.; Yang, J.; Xin, X.; Yan, L.; Wei, Q.; Du, B. Environ. Prog. Sustain. Energ 2015, 34, 39. 15. Zhang, A.; Zhang, R.; Zhang, N.; Hong, S.; Zhang, M. Kinet. Catal 2010, 51, 529.
16. Meng, X.; Qian, Z.; Wang, H.; Gao, X.; Zhang, S.; Yang, E.M. J. Sol. Gel. Sci. Technol 2008, 46, 195. 17. Soltani, R.D.C.; Jorfi, S.; Safari, M.; Rajaei, M.S. J. Environ. Manage 2016, 179, 47.
18. Khataee, A.; Soltani, R.D.C.; Karimi, A.; Joo, S.W. Ultrason. Sonochem 2015, 23, 219. 19. Kocí, K.; Matejka, V.; Kovar, P.; Lacný, Z.; Obalova, L. Catal. Today 2011, 161, 105. 20. Guo, Y.; Gong, Z.; Li, P.; Zhang, W.; Ga, B. Ceram. Int 2016, 42, 8850.
21. Sánchez-De la Torre, F.; la Rosa, D.; Rivera, J.; Kharisov, B. I.;Lucio-Ortiz, C. J. Materials 2013, 6(10), 4324.
22. Zhi, Y.; Li, Y.; Zhang, Q.; Wang, H. Langmuir 2010, 19,15546.
23. Fern´ez, L.; Garro, N.; El Haskouri, J.; Pe´rez-Cabero, M.; Ά lvarez-Rodr guez, J.; Latorre, J.; Guillem, C.; Beltr, A.; Amor´os, P. Nanotechnology 2008,19, 225.
24. Han, J.; Hu, S.P.; Wang, Y.; Ma, J.J. J. Chem. Soc. Pak 2013, 35, 11.
25. Liu, Y.; He, X.; Duan, X.; Fu, Y.; Dionysios, D.D. Chem. Eng. J 2015, 276,113.
26. Lin, J.; Wang, D.; Chen, D.; Ge, Q.; Ping, G.; Fan, M.; Qin, L.; Shu, K. Environ. Prog. Sustain. Energ 2015, 34, 74.
27. Omar, F.M.; Aziz, H.A.; Stoll, S. J. Colloid Sci. Biotech 2014, 3, 1.
28. He, X.; Mezyk, S.P.; Michael, I.; Fatta-Kassinos, D.; Dionysiou, DD. J. Hazard. Mater 2014, 279, 375. 29. Pereira, J.H.O.S.; Vilar, V.J.P.; Borges, M.T.; Gonza´lez, O.; Esplugas, S.; Boaventura, R.A.R. Solar
Energ 2011, 85, 2732.
30. Kanakaraju, D.; Motti, C.A.; Glass, B.D.; Oelgemöller, M. Chemosphere 2015, 139, 579. 31. Gan, H.; Zhang, G.; Huang, H. J.Hazard. Mater 2013, 250–251, 131.
32. Shaojun, J. I. A. O.; Zheng, S.; Daqiang, Y. I. N.; Lianhong, W. A. N. G.; Liangyan, C. H. E. N. Journal of Environmental Sciences, 2008, 20(7), 806.
33. Priya, B.; Shandilya, P.; Raizada, P.; Thakur, P.; Singh, N.; Singh, P. Journal of Molecular Catalysis A: Chemical 2016, 423, 400.
34. Sherly, E.D.; Vijaya, J.J.; Kennedy, L.J. Chinese J. Catal 2015, 36, 1263.