A Drain or Drench on Biocapacity? Environmental Account of Fertility,
Marriage and ICT in the United States and Canada
Andrew A. Alola1a Abdugaffar Olawale Arikewuyo2 Bahire Ozad3
Uju Violet Alola4 Halima Oluwaseyi Arikewuyo5
Funding
We hereby declare that there is no form of funding received for this study.
Compliance with Ethical Standards
The author wishes to disclose here that there are no potential conflicts of interest at any level of this study
Abstract
In either case of ecological and biocapacity surplus or deficit, the precautionary effort toward optimizing the natural capital is an important framework for environmental sustainability. In studying the environmental account of fertility, marriage, and technological advancement in the United States and Canada, the Pooled Mean Group (PMG) of the autoregressive distributed lad is employed over the experimental period 1990-2014. The result shows a significant and negative
1 Department of Economics and Finance, Faculty of Economics, Administrative and Social Sciences, Gelisim
University, Turkey. Corresponding address: [email protected] Mobile: +90 533 88 66 201
2 Faculty of Communication and Media Studies, Eastern Mediterranean University, E-mail:[email protected]
3 Faculty of Communication and Media Studies, Eastern Mediterranean University, E-mail:[email protected]
4 Department of Tourism Guidance, Faculty of Economics, Administrative and Social Sciences, Gelisim University,
Turkey. E-mail: [email protected]
5 Department of Epidemiology and Community Medicine, University of Ilorin, E-mail: [email protected]
short-run impact of fertility and marriage on biocapacity in the panel countries. On the other hand, the long-run impact which is significant indicates there is no evidence environmental concern. Interestingly, useful information is provided by the impact of the interaction of fertility and marriage on biocapacity. Moreover, a 1% increase in technological advancement improves the biocapacity by 0.007% in the long-run, while energy use will decrease the biocapacity during the same period. The Granger causality further affirms causality from fertility and marriage interaction and technological advancement to biocapacity without feedback. Hence, the study provides policy frameworks for stakeholders that address the environmental peculiarity of the United States being a biocapacity debtor and Canada as a biocapacity creditor.
Keyword: environmental sustainability; biocapacity; fertility rate; marriage rate; ict; United States; Canada
1. Introduction
The scope of sustainable development, especially in the light of global desperation to meeting the Sustainable Development Goals (SDG) 2030 and sustaining life has been extended beyond the global warming and Greenhouse gas (GHG) emissions in the last decades. Because human activity is the focal factor in the discussion of environmental sustainability, the biocapacity, ecological footprint (EFP), and material flow accounting have consistently been employed to describe the component of the natural capital. For instance, biocapacity is presented as the amount of available productive area of land and water to annually produce resources and absorb wastes under the current management practice (Global Footprint Network, 2018). So far, the challenge has remained that the balancing of the ecological budget, thus either in regulating the ecological supply or the overshoot of ecological demand. This tendency account for the reason countries are referred to as
either an ecological creditor or ecological debtor (Ress & Wackernagel, 1996; Wackernagel & Rees, 1997). In most cases, developed countries like the United States (USA) are expectedly experiencing an ecological deficit because their demand for resources is not met by a sufficient domestic supply in the form of biocapacity (Niccolucci et al., 2012). In reality, the biological capacity of the USA is a deficit by 133% (meaning that the ecological footprint is more than the biocapacity) while the biological capacity reserve of Canada is 89% (indicating that the biocapacity is more than the ecological footprint).
Across the nations of the world, the factors that affect the Earth’s capacity and the productive area of the ecosystem to enable it to sustain humanity are mostly the natural factors (including natural occurrences and disasters) and man-made or the human activities. The human activities that are widely known to affect the ecosystem are known to include the resource consumption and waste production rates, technological change, human preferences, lifestyles, institutions, and production structures (Schramski et al. 2015). Although the aforementioned components of human activities formed the basis of selection of the variables in the current investigation, the complex scenarios are believed to consider synergies and the role of other non-economic drivers of the ecological productivity of an area. Previously, immigration, population and/or fertility, political and geographical risk, and others are among the social factors associated with the productivity of the natural capital (Charfeddine & Mrabet, 2017; Alola, 2018; Alola & Alola, 2018a, b). Although the fertility rate is one of the conundrum associated with environmental discussion (Earl et al. 2017; Alola, Bekun & Sarkodie, 2019), its potential impact on the population is almost unarguable. In that regard, a similar relationship such as between marriage rates and environmental sustainability, and between the interaction of marriage with fertility and environmental sustainability is posed to further motivate the objective of the current study.
Therefore, the current study is aimed at investigating the impact of human fertility, marriage, the interaction of fertility and marriage rate, and the use of technology on biocapacity over the period of 1990 to 2014. A dynamic pooled mean Group (PMG) of the autoregressive distributed lag (ARDL) by Pesaran et al (1998) is employed to further advance the case of Earl et al. 2017 such that the current study potentially earned novelty in the following dimensions.
Firstly, although earlier study carefully investigates fertility-environmental dynamics (Earl et al. 2017), the current study has incorporated marriage which is largely believed to be the first of its kind in the literature.
Secondly, the study is designed to add novelty to extant literature in that the interaction of fertility and marriage is employed as an additional variable. This also is the first of its kind to the best knowledge of the authors. The statistical evidence of a high correlation between the interaction variable and biocapacity (see appendix A) is a strong indication.
Lastly, by employing dynamic pooled mean Group (PMG) of the autoregressive distributed lag (ARDL) by Pesaran et al (1998), the long-run and short-run estimates potentially laced the interaction and discussions with further interesting information.
The rest of the sections are presented as follow. An overview of the impact of fertility rate, marriage rate and technology on the environmental space is discussed in section 2. Material and methods are presented in section 3 while the results are discussed in section 4. Section 5 offers concluding remarks with policy implications and recommendation for future study.
2. The environmental account social factors and technology
Toward the effort to decarbonizing humans’ way of life and looking toward a sustainable existence, the perspectives of the United Nations Framework Convention on Climate Change
(UNFCCC, 2015) and other intergovernmental frameworks have translated into enormous studies (Bossle et al. 2016; Alola & Alola, 2018a). Also, in a more innovative approach, ecological footprint, biocapacity, environmental performance index, environmental sustainability index, and human development index are tools or indicators equally being employed to measure the pressure humans exerts while maintaining the current growth trends (Niccolucci et al 2012). For instance, Coscieme et al. (2016) noted the disparity in the Gross Domestic Product per Capita GDPc) of countries when ecological footprint and biocapacity is employed. The study (of Coscieme et al., 2016) opined that while the correlation between GDPc and the footprint balance of the ecological creditor countries is weak, the reverse is the case for countries considered as ecological debtors. As such, similar view is being held for the relationship of fertility, marriage and the ICT with environmental sustainability.
2.1 Fertility and the Environment
Against the backdrop for the support of ‘population engineering’ on the ground of climate change (Cafaro, 2012; Earl et al., 2017; Alola, Bekun & Sarkodie, 2019), opposing viewpoint reasoned from the economic perspective (Prettner et al. 2013; The Wharton School, University of Pennsylvania, 2014). In the view of Earl et al. (2017), the high risk associated with the humanity’s plan of dealing with climate change is the reason for employing a new dimension and strategies of tackling climate change by using the principle fertility-reduction alongside other decarbonization efforts. In a different opinion, The Wharton School, University of Pennsylvania (2014) observed the problem associated with a declining population. Specifically, the report indicated that Japan’s population will fall to 97 million by 2050 from 127.50 million people in 2012. The challenge associated with such a significant decline in Japan’s birth rate is the accumulation of Japan’s
government debt profile. Hence, studies on the relationship between fertility rate and environmental indicators have mostly yielded divergent views.
Moreover, studies have continued to express divergent view of the relationship between ecological sustainability and the extent of population growth or forecast of fertility and the world population (Charfeddine & Mrabet, 2017; Crist, Mora & Engelman, 2017; Collins & Page, 2019; Weber & Sciubba, 2019 Uniyal et al., 2020). Specifically, Crist, Mora and Engelman (2017) opined that the growth rate of human population has further deepened the challenges of mitigating the loss of biological diversity irrespective of the success of technological advancement. Hence, in attaining sustainable biodiversity, Crist, Mora and Engelman (2017) suggested policy direction that is aimed at reversing population growth. But, while investigating the impact of population growth on carbon emissions and land use for the 1062 regions of the 22 European countries, Weber and Sciubba (2019) observed variation in the impact of population growth in the Western and Eastern European regions. The aforementioned view is similar to the evidence obtained in the study of Collins and Page (2019). While acknowledging that a wide range of global challenge is associated with population growth, Collins and Page (2019) equally observed that the fertility level in post demographic transition countries is tending toward a long-run mean, thus causing a declining population in the concerned countries.
2.2 The ICT-Environment nexus
The use of energy-saving technology has ensured the closing of the gap between energy consumption and technological advancement, thus suggesting positive impact of technology on the environment. For instance, the recent study of Charfeddine (2019) examined the impact of renewable energy consumption on environmental quality vis-à-vis carbon emissions. The study found that renewable energy consumption positively affects the environmental quality especially
of the Middle East and North Africa (NEMA) countries. Similarly, Wackernagel and Monfreda (2004) and Dias De Oliveira et al (2005) are among few studies that have considered the relationship between energy-saving technologies and alternative energy source in accounting for the ecological footprint. In considering the cases of Brazil6 and the USA, Dias De Oliveira et al (2005) specifically compared the benefits and environmental impacts of using alternative energy source, the ethanol fuel using the ecological footprint tool.
However, the impact of the digital revolution on environmental quality through the ICT regime shift has further affirmed the other side of technological advancement to environmental sustainability (Kemp, 1994; Buhalis, 1997; Yi & Thomas, 2007; Williams, 2011; Kreps et al., 2015). The changing world has continued to experience a shift in the environmental sustainability through the promotion of the information and communication technology (Kreps et al., 2015). In addition to providing ways to mitigate energy use through smart buildings and teleworking, Williams (2011) opined that the ICT has impacted the environment through manufacturing, operations and the management of network devices and equipment. In a related argument, Buhalis (1997) and Yi and Thomas (2007) further presented the significant role of the state of the art technology such as in e-business on the environment. As such, Buhalis (1997) acknowledged that the introduction of e-business platform such as the Destination Integrated Computer Information Reservation Management Systems did not only enhance the development and profitability of tourism enterprises in the destination country, the system is believed to reduce the negative effect of social, cultural, and most importantly the environmental challenges.
2.3 The Environmental side of Marriage
Although there is sparse literature on marriage-environmental nexus, recent studies have indicated the relationship between the state of the environment and distribution of social groups (Downey, 2005; Downey & Hawkins, 2008; Torgler, Garcia-Valiñas & Macintyre, 2008; Downey, Crowder & Kemp, 2017). On one hand, Downey, Crowder and Kemp (2017) observed that there is a gap between the level of neighborhood pollution experienced by single parents and two-parent families. Downey, Crowder and Kemp (2017) further observed that the level of neighborhood pollution experienced by single mother and single‐father families are respectively greater than those of the two-parent families by 46% and 26%. On the other hand, the female‐headed family, male‐headed family, and married‐couple family were observed to be good predictor of the estimated toxic concentration levels (Downey & Hawkins, 2008). Downey and Hawkins (2008) and Downey (2005) both noted that the percentage of single‐mother families is a significant predictor of estimated toxic concentration levels.
3. Material and methods
The drive toward a sustainable development has been globally advanced by the United Nations member states since 2015. In its draft, the member nations adopted the 17 core goals as the 2030 Sustainable Development Goals 20307 (SDGs 2030, 2015). By association, the effective implementation of the factors considered in the current study is potentially related to the components of the SDGs 2030. Specifically, energy use is an essential component of the 7th goals of the SDGs 2030, the use of information and communication technology is closely associated with quality education (4th goal of SDGs 2030) while also linked with the 7th goals of SDGs 2030.
7 Detail description of the (17) Sustainable Development Goals 2030 is available in
Considering the concern of rapid urbanization and population expressed as the 11th goal of SDGs 2030, this is closely associated with human fertility and marriage. Lastly, the ecological biocapacity is a component of the 15th goal of the SDGs 2030. In Figure 3, these interrelationships between the examined factors and the SDGs 2030 is further presented.
<Insert Figure 3> 3.1 Data description and statistics
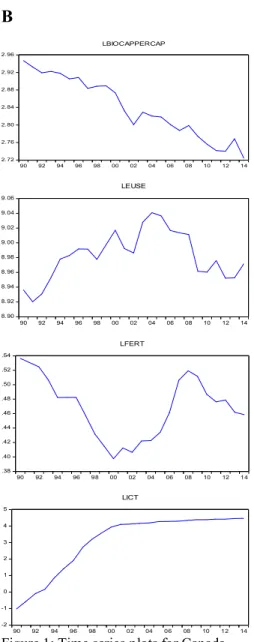
This study employs unbalanced annual panel data for the United States and Canada over the period 1990-2014. Biocapacity8 which is used as a proxy for environmental degradation is the dependent variable. Also, the independent variables employed are the Energy use, human fertility rate, information and communication technology (ICT), and marriage rate. Additionally, the interaction of human fertility rate and marriage rate (fertmar) was equally employed as an independent variable. In Table 1(Upper upper), the classification with units, sources of the variables and further details are presented while their descriptive statistics are also presented in Table 1(Upper lower). Also, the correlation matrix (Table A) and the Time series plot for Canada (see Figure B1) and the USA (see Figure B2) are presented in the appendix.
<Table 1> 3.2 Empirical method
A wide scope of methodology framework has been designed in underpinning the principal drivers of anthropogenic environmental disturbances. For instance, from using IPAT to STIRPAT environmental concepts (Wackernagel et al., 1999; Dietz & Rosa, 1994; York et al, 2003a, b; Rosa et al., 2004), further studies have continued to the argument the earlier identified principal drivers
8 Biocapacity is the capacity of the ecosystems to regenerate what people demand from those surfaces. The Biocapacity
of the surface represents its ability to renew what people demand. Biocapacity is measured in global hectares. Further details on Biocapacity are available on https://data.footprintnetwork.org/#/abouttheData.
of environmental factors. The incorporation of non-economic factors and ecological footprint as a measure of environmental quality has recently been re-prioritized (Dubey et al. 2015; Charfeddine & Mrabet, 2017; Alola, 2019; Destek & Sarkodie, 2019). In this case, the current study further advances Charfeddine and Mrabet (2017) which considers non-economic factors of ecological footprint that include a political institutional index, fertility rate, and life expectancy at birth. Hence, decomposing the population factor (P) of the STIRPAT model (I = α Pb Ac Td e), we now have fertility rate, marriage rate, and the interaction of the two factors all incorporated in lieu of population to account for the biocapacity of the panel countries. The energy use per capita (euse) is employed to control for other potential factors. As such, the model under investigation in the current study is given as:
Bcap i, t = f (ferti,t, marri,t fertmari,t, eusei,t, icti,t e) (1)
Then, the transformation of the above expression (equation 1) to natural logarithmic (l) is given by:
lbcap i, t = α + β1lferti, t + β2 lmarri,t + β3l fertmari t + β4licti,t + + β5leusei,t + εi,t (2)
for all t = 1990, …, 2014, i = 1 (USA) and 2 (Canada), and ε is the error term. Also, βs are the degree of response of the logarithms of the explanatory variables (fert for fertility, marr for marriage, and fertmar for the interaction of fertility and marriage) to bcap (biocapacity) for each I and t, given that ε is iiid ~ N (μ, σ2).
3.2.1 Dynamic Pooled Mean Group test
Given the slightly mixed order integration of the variables and given that the Time period (T) is clearly greater than the number of the cross-section (N), a Pooled Mean Group (PMG) of the dynamic heterogeneous panel is preferably employed (Pesaran, Shin & Smith, 1999). Pesaran, Shin and Smith (1999) implied that (although N is significantly smaller than T in the current study)
the PMG is preferred when N (provided N > 1) is significantly less than T because it provides a robust long-run estimate of the coefficient. As a preferred and more robust model to Generalized Method Moments (GMM) and Mean Group (MG) in this investigation, the Pooled Mean Group (PMG) estimation adopts the cointegration form of the ordinary ARDL model as indicated by Pesaran, Shin and Smith (1999). When the equation (2) is estimated according to the aforesaid model, the represented expression is given as:
Δyi, t = ϕ i EC i, t + + + εi, t (3)
where ECi, t = yi, t-1 – X i, t θ is the error correction, ϕ is the adjustment coefficients and θ is the
long-run coefficients such that X (vector of the independent variable) = f (lfert, lmarr, lfertmar, lict, leuse) in the models. The dependent variable in the models Y = lbcap such that the estimation output of the model specifications is shown in Table 3.
<Insert Table 2> <Insert Table 3> 3.2.2 Empirical diagnostic tests
First, the Wald test is employed as a diagnostic and an immediate follow-up test to the PMG test indicated earlier. The test further beam light on the short-run relationship in the panel by employing the null hypothesis of no short-run relationship using the F-statistics and chi-square values. In the lower part of Table 3, the results of the Wald test (reject the null hypothesis) and the normality test (given the skewness = 0.61 and kurtosis = 7.40) are presented.
Secondly, in the process of affirming the significance of the introduction of the interaction variable (fertmar), a redundant test is performed. In doing, the null hypothesis of fertmar is jointly not significant is rejected. As indicated in the lower part of Table 3, the F-statistics (28.43*), T-statistic
(5.33*), and the Likelihood ratio (24.02*) are all statistically significant, thus rejecting the null hypothesis.
Lastly, this study employs a heterogeneous non-causality test of Granger causality by Dumitrescu and Hurlin (2012) to investigate the causality between the variables. The dataset has a larger T dimension (25 years) compared to the dimension of N (2 countries), thus the use of asymptotic distributions is justified. Preferably, this test technique is considered since the Monte Carlo simulation created through the approach is suitable even in the presence of a cross-section dependency (CSD) without affecting the robustness of the estimates. In addition, this model is built on vector autoregressive model (VAR) and suitable for a balanced and heterogeneous panel The panel linear model where a pair-up of the variables as yi,t and xi,t is presented as:
yi, t = ∑ ( ) , + ∑
( )
, + , (4)
such that k denotes the lag length, β(k ) is the autoregressive parameter, and γ( k is the regression coefficient that adjusts within the group with a normal, independent and identically distributed error term (εi,t) for each cross section (i) at the time (t). Given that the null hypothesis for non-causality and the alternative hypothesis are respectively Ho and H1, the expression is given as:
H0 = γi = 0, ∀ i = 1, 2, …, N
H1 = γi = 0, ∀ i = 1, 2, …, N1; γi ≠ 0, ∀ i = N1 + 1, N1 + 2, …, N
given that γi = ( , …, ), N1 = N indicates that causality of any member of the panel but N1 = 0
indicates causality within cross-sections as the value N1/N is reasonably less than one9. The
estimate of the Granger causality test is presented in Table 4. <Insert Table 4>
9 Further detail of Granger causality by Dumitrescu E I and Hurlin C (2012) is available in Dumitrescu, E.I. and
Hurlin, C., 2012. Testing for Granger non-causality in heterogeneous panels. Economic Modelling, 29(4), pp.1450-1460.
4. Results and discussion
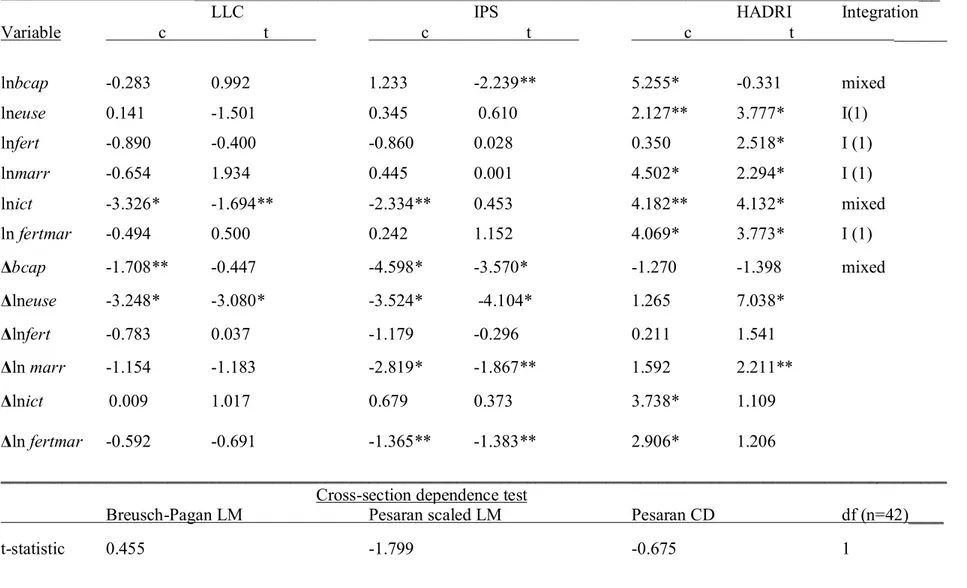
Foremost, the descriptive statistics of Table 1 shows that there is empirical evidence of significant normal distribution of the series in the two countries (the USA and Canada). Because the statistical evidence fails to reject the null hypothesis of normality as observed with the Jacque-Bera statistics. Thus it implies all the series oscillate about the mean with the same degree and variance. Also, from the common statistics, there is the higher potential of the biologically productive area (biocapacity) to perpetually generate/supply renewable resources and absorbs spillover wastes in Canada than in the USA. The difference in biocapacity of the two countries is very high i.e given the illustration from the mean, maximum and minimum values for Canada (17.14, 19.06, and 15.55 respectively) and the USA (3.825, 4.221, and 3.501 respectively). The energy use per capita in Canada is also relatively higher than in the USA as obviously illustrated in the mean, maximum and minimum estimates. The disparity is expected because Canada is a net oil-exporting country while the USA is net oil-importing (Charfeddine & Mrabet, 2017). Although the USA currently consume the highest energy in the world, in this case, it is energy use per capita, thus it higher in Canada than in the USA. The reason for this could not be far from the fact that the larger proportion of energy use (primary energy before consumed by end-users) in the USA are in the industrial, manufacturing, production, transports and services sectors. Also, the population of Canada (about 36 million people) is far lower (almost 10 times lower) compared to that of the USA (about 325 million people). As evident from the statistics of the mean, maximum and minimum, the fertility rate and marriage in the USA are obviously higher than that of Canada. But, the ICT usage in Canada is slightly higher than obtainable in the USA. Importantly, the result observed that there is no statistical evidence of the distribution or spillover of shock in the cross-section. The evidence is from the cross-section dependency test (see the lower part of Table 2). In the result, the null
hypothesis of no crosssection dependency is not rejected by the Pesaran CD test (t statistics is -0.675) and similarly with the other two Lagrange Multiplier (LM) category tests.
Now, concerning the relationships, it is observed that the error correction term ( -1) is negative and statistically significant -0.86. Hence, it establishes the cointegration relationship among the variables and that the short-run deviation from long-run is adjusted at a fast speed. The long-run impact of energy use per capita on biocapacity in the panel is -0.0003. Although the value is low, it shows that the ecological capacity (of the natural capital) will decrease over a long period of energy use (i.e 1% increase in energy use per capita resulting in 0.03% decrease in the biocapacity of the USA and Canada as a pooled series. However, the short-run impact of energy use on Biocapacity in the panel, in the USA and Canada (respectively, 0.0004, 0.0005, and 0.0002) are statistically significant and positive. One would expect the Biocapacity of the two countries (the USA and Canada) to decline with energy use. But the reason for the small increase is expected to be related with the ‘land’ or ‘natural capital’ grapping of the small and middle-income countries, thus the developed countries is less-dependent on own natural capital. In the affirmation to this finding, Coscieme et al (2016) opined that Biocapacity is often transferred from low and middle-income countries to high-middle-income countries. This obviously account for why the economic activity of most advanced countries influences the availability of environmental resources of other (less-developed) countries.
Charfeddine and Mrabet (2017) observed a complicated relationship between environmental degradation and fertility rate. Although Weber and Sciubba (2019) observed a variation in the environmental impact of population growth, the high fertility rate is seen as a causative factor of population growth, thus causing depletion of the natural resources or the reproductive ability of the ecological nature (biocapacity) (Crist, Mora & Engelman, 2017). Hence, in the current study
and in the short run (see Table 3), 1% increase in fertility rate is observed to cause 27.59% decline in the panel’s biocapacity (statistically significant), 24.47% decline in the USA’s biocapacity (not statistically significant), and 30.70% decline in the Canada biocapacity (not statistically significant). However, the long-run impact of fertility rate on biocapacity is unexpected. It is observed that a 1% increase in the fertility rate of the panel will cause 7.42% increase in biocapacity. Unlike Luck (2007) which noted a positive association between biodiversity and human population density such as in the current study, findings from Crist, Mora and Engelman (2017) and Earl et al (2017) both implied a dissimilar result of the relationship between biodiversity and population dynamics (a function of fertility rate). Moreover, the results of the marriage rate-biocapacity long-run and short-run relationships in the panel, and in the USA and Canada are all similar to that of fertility rate-biocapacity relationship. The unexpected results might not be far from the increasing rate of single parenting, divorce in the USA and Canada and the increasing acceptability of homosexual marriage which was not accounted for in the marriage rate series. For instance, the 2016 census in the USA and Canada respectively noted that children 27% and 19.2% of children under 18 lives with a single parent. As such, 80% and 87.1% of the USA and Canadian households are respectively headed by mothers (The spaced-out Scientist, 2018). Hence, putting these factors into account, the increase in fertility might not necessarily translate to depletion of the nature capita, thus biocapacity of the countries could remain unperturbed. After all, the Time series plots (see Figures B1 & B2 of the appendix) for fertility rate for the two countries have consistently experienced sharp decline especially since about 2007.
But, the interaction of fertility rate and marriage rate i.e fertmar (as estimated) provides yet interesting result (also in Table 3). The short-run estimates for the panel, in the USA and Canada, indicates that biocapacity respectively respond positively to 1%b increase in fert*marr by 3.55%,
3.03%, and 4.06%. Whereas the long-run estimate of the same variable is in opposite direction. The interaction is expected to address the factor of single parenting and divorce as earlier observed and as such could potentially translate to population growth. And, in the long-run, the observed impact of fertmar on biocapacity is statistically significant and negative. Although the sustainability of the biocapacity might be well-managed in the immediate (as observed in the short-run estimates), it suggests being more herculean to sustaining such in the long-short-run especially as
fertmar results in population growth.
Advance technology (here proxy as ICT) is observed to be statistically significant and have a negative impact on biocapacity of the panel, and the two examined countries in the short-run. It implies that 1% increases in the ict usage will reduce biocapacity by 0.02% in the panel, 0.03% in the USA, and 0.002% in Canada. On the other hand, the elasticity of biocapacity with respect to a change in ict is 0.008 in the long-run. This implies that the effect of improved technology on the environment and ecosystem is in progression, thus it improves the productive area of the natural capital with minimal environmental degradation. Romejko and Nakano (2017) and McBain et al (2018) are few of the recent studies that have identified the impact of advanced technologies in causing minimal damage to the environment, ecosystem, and the natural capital.
Lastly, the current study also carried out a series of diagnostic tests (see the lower part of Table 3) to further affirm the validity of the aforementioned results. The results of the Wald test (F-statistics = 953.50 and Chi-square = 4767.50), skewness and kurtosis are all desirable. Also, the null hypothesis of no joint significant with fertmar is rejected, thus suggesting that the introduction of
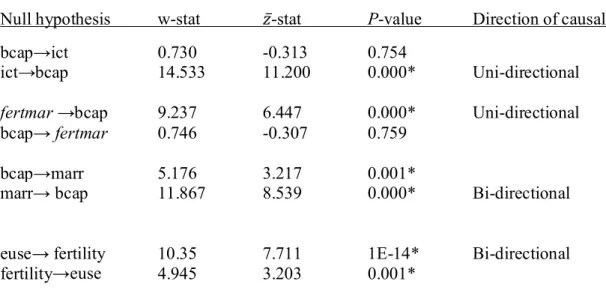
fertmar to the model of biocapacity is desirable. Moreover, there is empirical evidence of Granger
hand, statistically significant evidence of Granger causality between biocapacity and marriage, and energy use and fertility without feedback is observed.
5. Conclusions, outcomes and outlooks
The current study investigates the dynamic impacts of fertility, marriage, the use of ict, and the interaction of fertility and marriage on the biocapacity of the USA and Canada. In this case, and over the period 1990-2014, the capacity or perpetual renewal of the natural capital (biocapacity) is investigated in respect to the enormous human activity in both countries. Here, the interaction of fertility and marriage is employed to account for the potential discrepancies that might have aroused by not accounting for single parents that are equally fertile. Also, it is an inference from the segmentation of households as “single-person-based and “non-single-person-based households” in Besagni and Borgarello (2018). From the estimate, the fertility rate and marriage rate are both not likely to cause a decline in biocapacity in the long-run. It then suffices that the fertility of individual and the rate of marriage in the USA and Canada (as pooled estimate) are also not likely to drive the population of the panel countries, especially in the long-run. Whereas, the interaction of both factors i.e. fertility rate and marriage rate (fertmar) is statistically significant in the short-run and long-run. Interestingly, the interaction is observed to cause a reduction in the production capacity of the ecosystem (biocapacity), thus an expected result that fertility endangers the global climate ensues (Earl et al., 2017). Similarly, the impact of energy use on the productive area of the ecosystem (biocapacity) was unexpectedly positive in the short-run. The reason for such result would not be far from the use of energy-saving technologies (associated with countries like the USA and Canada) which is believed to rather improve environmental quality rather than degrading the earth’s biocapacity. Also, the biocapacity importation ideology of the advanced economies (the USA and Canada inclusive) is linked with the biocapacity savings rather than
degradation of these countries (Kissinger & Rees, 2010). Moreover, the impact of technological advancement (ict) on the biocapacity of the panel countries and separately on each the USA and Canada is not necessarily improving the quality of the ecosystem at the immediate (short-run). However, a long period (long-run) adaptation to the use of technology in production, manufacturing, service, transportation, and in other economic-driven sectors is observed to significantly improve the biocapacity of the panel countries. The broader perspective of the interrelationship of fertility, marriage, energy use, and ict is embedded in the Sustainable Development Goals 2030. On a general note, the study suggests that the USA and Canada have more to do in regard to attaining cleaner environment. For instant, an energy policy that targets energy companies as indicated by Mozumder et al (2011) could be enforced by energy experts and all stakeholders in the USA and Canada. Importantly, in considering frameworks of the government of the USA and Canada especially that are geared toward the SDGs 2030, the components of the investigated factors (biocapacity, fertility, marriage, and ict) should be prioritized. This is because of the importance of the aforementioned factors to the SDGs 2030 components (see Figure 3). Meanwhile, some of these frameworks could be more effective in one country than the other, thus country-specific understanding is also vital.
5.1 The outcome and outlook
The USA
The outcome of the estimations and statistical inference posits potential factors that aids the production of waste and the susceptibility to environmental risk in the USA and the partner countries. For instance, the incessant reliance of the USA on imports from specific countries around the world endangers the area of terrestrial ecosystems in those countries rather than ecosystems the USA (Kissinger & Rees, 2010). But, even in the USA, the consumption of the
imported goods by households, depending on the segmentations (Besagni & Borgarello, 2018) contributes to the increase in environmental wastes. Evidently, the fertility rate (average of 2.005 per person) and marriage rate (average of 7.917 per 1000 persons) are relatively high, thus causing more usage of human capital, energy and other resources. Also, this is on the premise that the socio-demographic variables such as the variation of the number of child born to a couple is significant to household energy consumptions as recently presented by Besagni and Borgarello (2019). Also, the use of advanced technology (denoted as ict) is observed to significantly improve the biocapacity of the USA in the long run. This implies that access to quality education (one of the SDGs 2030) plays a vital role in improving the quality of the environment of the country.
From the indications expressed above, policy frameworks that promote the sustainability development of the USA’s natural capital, efficient energy utilization and technologies are essential. Considering that the USA is currently known as an ecological deficit country, more effective and environmental policy would be essential toward further preserving the natural capital. In addition, a long-term policy like the ‘population engineering’ framework might be appropriate to mitigate the risk of dangerous climate change or optimize the ecological footprint and biocapacity of the USA. In the case of objection to such “population engineering” proposals, the USA for example (Earl et al., 2017), other population driven framework like immigration policy, could be revisited by the government of the USA. In doing so, such policy could indirectly affect the fecundity rate dynamics of the countries and in turn the productive area of the environment. Since the use of ict is a consequential procedure to improving the country’s biocapacity, more research should be encouraged to ensure that the USA adapt the use of modern effective and cleaner technologies across the main sectors of the economy like the energy sector. These technologies which include waste management could be part of the policy mechanism that is
driven by sustained innovations, investment in education, research and development (Lee et al., 2016).
Canada
Unlike the USA, the fact that Canada is reported to have abundant reserve of the ecological biocapacity seems to suggest safe havens. In spite of the Canada’s biocapacity reserves, the impacts from other factors such as the socio-demographic, energy use, human capita imbalance, and others could posit threat to the country’s productivity and sustainable development drive. Typically, sustainability of Canada’s economy with low, stable and predictable inflation has remained the target of the country’s fiscal policies (Bank of Canada, 2015). The main drawback to attaining a defined economic stability has been largely attributed to the country’s labour shortage over decades. For instance, the Canadian Federation of Independent Business (CFIB, 2018) reported that about 400, 000 unfilled job positions were reported in Canada in the fourth quarter of 2017. Evidently, the aforesaid observation is a potential reflection of the effects of low fertility rate (average of 1.598 per person/couple) and marriage rate (average of 5.147 per 1000 people) in Table 1. Because of Canada’s low fertility rate (per couple), energy consumption per household or couple (Besagni & Borgarello, 2018), human capita availability, and resources utilization are unlikely to translate to a sustainable development.
The current immigration policy especially that encourages skilled workers to migrate to Canada is one of the policy frameworks that is designed to mitigate the labour force shortage, thus improving the outlook of the economy. Since, ict is observed to play significant role like in the USA, in addition to the Canada’s labour force shortage, a specified education policy framework might be suitably productive. Importantly, the potential population implosion in Canada could be addressed by reforming social policies such that encourages more childbearing and motivates more women
to join the workforce. These policies could also include maternity protection, parental leave, child care services, and child benefits as strongly been considered in most Western European countries (Neyer, 2003).
Future studies to be considered may include:
Using household survey that is designed to collect information that may not be readily available. This concept may account for population and demography segmentation (like sexuality classification) although classified as important determinants of household energy expenditures, they depict hidden or evolving information (Besagni & Borgarello, 2018). The unexpected results for the impact of fertility and marriage on biocapacity suggest a
future contextual investigation. As such, another look of the study by employing an asymmetric methodology could be employed.
In any case, the study could be extended to a state-level or metropolitan statistical areas (MSA) of the United States and to the provincial level in Canada. This is because the policy direction could vary across the states or regions of the USA and the Canadian provinces.
Reference
Alola, A. A. (2018). The trilemma of trade, monetary and immigration policies in the United States: Accounting for environmental sustainability. Science of The Total Environment. https://doi.org/10.1016/j.scitotenv.2018.12.212.
Alola, A. A., & Alola, U. V. (2018a). Agricultural land usage and tourism impact on renewable energy consumption among Coastline Mediterranean Countries. Energy & Environment, 0958305X18779577. doi.org/10.1177/0958305X18779577.
Alola, A. A., & Alola, U. V. (2018b). The Dynamics of Tourism—Refugeeism on House Prices in Cyprus and Malta. Journal of International Migration and Integration, 1-16.
Alola, A. A., Bekun, F. V., & Sarkodie, S. A. (2019). Dynamic impact of trade policy, economic growth, fertility rate, renewable and non-renewable energy consumption on ecological footprint in Europe. Science of The Total Environment, 685, 702-709.
Bank of Canada (2015). Minding the Labour Gap.
https://www.bankofcanada.ca/2015/02/minding-labour-gap/. (Accessed 5 January 2019). Besagni, G., & Borgarello, M. (2018). The determinants of residential energy expenditure in
Italy. Energy, 165, 369-386.
Besagni, G., & Borgarello, M. (2019). The socio-demographic and geographical dimensions of fuel poverty in Italy. Energy Research & Social Science, 49, 192-203.
Bossle, M. B., de Barcellos, M. D., Vieira, L. M., & Sauvée, L. (2016). The drivers for adoption of eco-innovation. Journal of Cleaner Production, 113, 861-872.
Buhalis, D. (1997). Information technology as a strategic tool for economic, social, cultural and environmental benefits enhancement of tourism at destination regions. Progress in tourism
and hospitality research, 3(1), 71-93.
Cafaro, P. (2012). Climate ethics and population policy. Wiley Interdisciplinary Reviews: Climate
Change, 3(1), 45-61.
Canadian Federation of Independent Business (CFIB, 2018). Young workers could alleviate Canada’s labour shortage, but they need help. https://www.cfib-fcei.ca/en/media/young-workers-could-alleviate-canadas-labour-shortage-they-need-help. (Accessed 5 January 2019).
Charfeddine, L., & Kahia, M. (2019). Impact of renewable energy consumption and financial development on CO2 emissions and economic growth in the MENA region: A panel vector autoregressive (PVAR) analysis. Renewable energy, 139, 198-213.
Charfeddine, L., & Mrabet, Z. (2017). The impact of economic development and social-political factors on ecological footprint: A panel data analysis for 15 MENA countries. Renewable
and Sustainable Energy Reviews, 76, 138-154.
Coscieme, L., Pulselli, F. M., Niccolucci, V., Patrizi, N., & Sutton, P. C. (2016). Accounting for “land-grabbing” from a biocapacity viewpoint. Science of The Total Environment, 539, 551-559.
Crist, E., Mora, C., & Engelman, R. (2017). The interaction of human population, food production, and biodiversity protection. Science, 356(6335), 260-264.
Collins, J., & Page, L. (2019). The heritability of fertility makes world population stabilization unlikely in the foreseeable future. Evolution and Human Behavior, 40(1), 105-111. Dias De Oliveira, M. E., Vaughan, B. E., & Rykiel, E. J. (2005). Ethanol as fuel: energy, carbon
dioxide balances, and ecological footprint. AIBS Bulletin, 55(7), 593-602.
Dietz, T., & Rosa, E. A. (1994). Rethinking the environmental impacts of population, affluence and technology. Human ecology review, 1(2), 277-300.
Destek, M. A., & Sarkodie, S. A. (2019). Investigation of environmental Kuznets curve for ecological footprint: The role of energy and financial development. Science of The Total
Downey, L. (2005). Single mother families and industrial pollution in metropolitan America.
Sociological Spectrum, 25(6), 651-675.
Downey, L., Crowder, K., & Kemp, R. J. (2017). Family structure, residential mobility, and environmental inequality. Journal of Marriage and Family, 79(2), 535-555.
Downey, L., & Hawkins, B. (2008). Single‐mother families and air pollution: A national study.
Social science quarterly, 89(2), 523-536.
Dubey, R., Gunasekaran, A., & Ali, S. S. (2015). Exploring the relationship between leadership, operational practices, institutional pressures and environmental performance: A framework for green supply chain. International Journal of Production Economics, 160, 120-132. Dumitrescu, E. I., & Hurlin, C. (2012). Testing for Granger non-causality in heterogeneous
panels. Economic Modelling, 29(4), 1450-1460.
Earl, J., Hickey, C., & Rieder, T. N. (2017). Fertility, immigration, and the fight against climate change. Bioethics, 31(8), 582-589..
Global Footprint Network (2018). http://data.footprintnetwork.org/#/. (Accessed 22 December 2018).
Hadri, K. (2000). Testing for stationarity in heterogeneous panel data. The Econometrics
Journal, 3(2), 148-161.
Im, K. S., Pesaran, M. H., & Shin, Y. (2003). Testing for unit roots in heterogeneous panels. Journal of econometrics, 115(1), 53-74.
Kemp, R. (1994). Technology and the transition to environmental sustainability: the problem of technological regime shifts. Futures, 26(10), 1023-1046.
Kissinger, M., & Rees, W. E. (2010). Importing terrestrial biocapacity: The US case and global implications. Land Use Policy, 27(2), 589-599.
Kreps, D., Kimppa, K., Lennerfors, T. T., Fors, P., & van Rooijen, J. (2015). ICT and environmental sustainability in a changing society. Information Technology & People. Lee, C. T., Klemeš, J. J., Hashim, H., & Ho, C. S. (2016). Mobilising the potential towards
low-carbon emissions society in Asia. Clean Technologies and Environmental Policy, 18(8), 2337-2345.
Levin, A., Lin, C. F., & Chu, C. S. J. (2002). Unit root tests in panel data: asymptotic and finite-sample properties. Journal of econometrics, 108(1), 1-24.
Luck, G. W. (2007). A review of the relationships between human population density and biodiversity. Biological Reviews, 82(4), 607-645.
McBain, B., Lenzen, M., Albrecht, G., & Wackernagel, M. (2018). Reducing the ecological footprint of urban cars. International Journal of Sustainable Transportation, 12(2), 117-127.
Mozumder, P., Vásquez, W. F., & Marathe, A. (2011). Consumers' preference for renewable energy in the southwest USA. Energy economics, 33(6), 1119-1126.
National Oceanic and Atmospheric Administration (2017). The international report confirms that 2016 was the warmest year on record for the globe. https://www.noaa.gov/news/international-report-confirms-2016-was-warmest-year-on-record-for-globe. (Accessed 11 December 2018).
Pesaran, M. H. (2004). General diagnostic tests for cross section dependence in panels.
Pesaran, M. H., Shin, Y., & Smith, R. P. (1999). Pooled mean group estimation of dynamic heterogeneous panels. Journal of the American Statistical Association, 94(446), 621-634. Neyer, G. (2003). Family policies and low fertility in Western Europe.
Niccolucci, V., Tiezzi, E., Pulselli, F. M., & Capineri, C. (2012). Biocapacity vs Ecological Footprint of world regions: A geopolitical interpretation. Ecological Indicators, 16, 23-30. Organization for Economic Co-operation and Development (OECD, 2018). http://www.oecd.org/els/family/database.htm?fbclid=IwAR1y5qoZcDQ158vV9bbdFq2x 8hFjyPwZPWFJUHy2Y6K5bll7KTRb1j6ETJs. (Accessed 22 December 2018).
Pesaran, M. H., & Shin, Y. (1998). An autoregressive distributed-lag modelling approach to cointegration analysis. Econometric Society Monographs, 31, 371-413.
Prettner, K., Bloom, D. E., & Strulik, H. (2013). Declining fertility and economic well-being: Do education and health ride to the rescue? Labour economics, 22, 70-79.
Ress, W. E., & Wackernagel, M. (1996). Ecological footprints and appropriated carrying capacity: Measuring the natural capital requirements of the human economy. Focus, 6(1), 45-60. Romejko, K., & Nakano, M. (2017). Portfolio analysis of alternative fuel vehicles considering
technological advancement, energy security and policy. Journal of Cleaner
Production, 142, 39-49.
Rosa, E. A., York, R., & Dietz, T. (2004). Tracking the anthropogenic drivers of ecological impacts. AMBIO: A Journal of the Human Environment, 33(8), 509-512.
Sarkodie, S. A., & Adams, S. (2018). Renewable energy, nuclear energy, and environmental pollution: Accounting for political institutional quality in South Africa. Science of The
Total Environment, 643, 1590-1601.
The Wharton School, University of Pennsylvania (2014). The graying of Japan: Tough choices on
the population dilemma. Knowledge@Wharton.
http://knowledge.wharton.upenn.edu/article/graying-japan-tough-choices-population-dilemma/. (Accessed 2 November 2018).
Schramski, J. R., Gattie, D. K., & Brown, J. H. (2015). Human domination of the biosphere: Rapid discharge of the earth-space battery foretells the future of humankind. Proceedings of the
National Academy of Sciences, 112(31), 9511-9517.
Sustainable Development Goals (SDGs, 2015). The 2030 Agenda for Sustainable Development. https://sustainabledevelopment.un.org/?menu=1300. (Accessed 5 January 2019).
UNFCC, C. (2015). Paris agreement. FCCCC/CP/2015/L. 9/Rev.1. (Accessed 20 November 2018).
Uniyal, S., Paliwal, R., Kaphaliya, B., & Sharma, R. K. (2020). Human Overpopulation: Impact on Environment. In Megacities and Rapid Urbanization: Breakthroughs in Research and
Practice (pp. 20-30). IGI Global.
The spaced-out Scientist (2018). https://spacedoutscientist.com/2017/07/18/single-parents-worldwide-statistics-and-trends/. (Accessed 25 December 2018).
Torgler, B., Garcia-Valiñas, M. A., & Macintyre, A. (2008). Differences in preferences towards the environment: The impact of a gender, age and parental effect.
Wackernagel, M., & Monfreda, C. (2004). Ecological footprints and energy. Encyclopedia of
energy, 2(1), 1-11.
Wackernagel, M., Onisto, L., Bello, P., Linares, A. C., Falfán, I. S. L., Garcıa, J. M., & Guerrero, M. G. S. (1999). National natural capital accounting with the ecological footprint concept. Ecological economics, 29(3), 375-390.
Wackernagel, M., & Rees, W. E. (1997). Perceptual and structural barriers to investing in natural capital: Economics from an ecological footprint perspective. Ecological economics, 20(1), 3-24.
Weber, H., & Sciubba, J. D. (2019). The Effect of Population Growth on the Environment: Evidence from European Regions. European Journal of Population, 35(2), 379-402. Williams, E. (2011). Environmental effects of information and communications technologies.
nature, 479(7373), 354.
World Bank Development (WDI, 2018). World Bank. https://data.worldbank.org/indicator. (Accessed 22 December 2018).
Yi, L., & Thomas, H. R. (2007). A review of research on the environmental impact of e-business and ICT. Environment international, 33(6), 841-849.
York, R., Rosa, E. A., & Dietz, T. (2003). Footprints on the earth: The environmental consequences of modernity. American sociological review, 279-300.
York, R., Rosa, E. A., & Dietz, T. (2003). STIRPAT, IPAT and ImPACT: analytic tools for unpacking the driving forces of environmental impacts. Ecological economics, 46(3), 351-365.
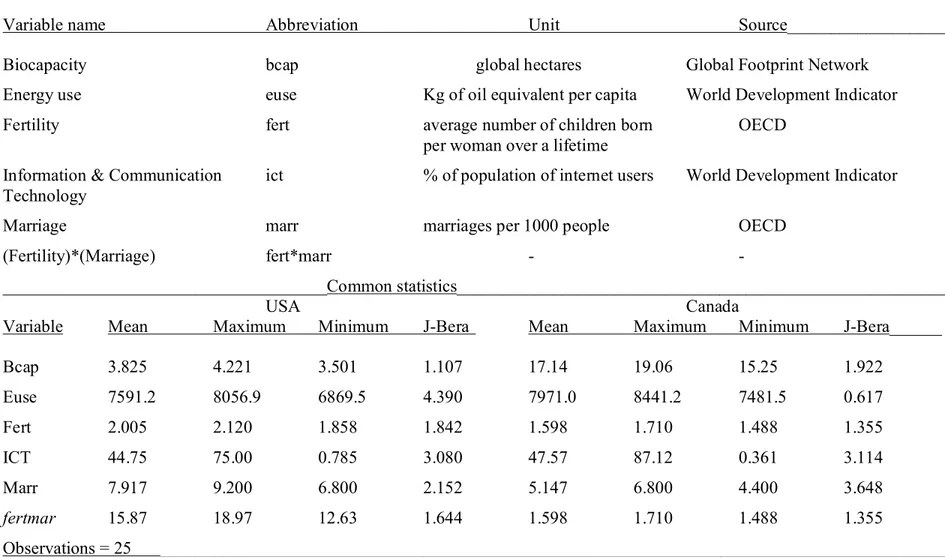
Table 1: Data description and common statistics of the series___________________________________________________________
Variable name Abbreviation Unit Source__________________
Biocapacity bcap global hectares Global Footprint Network
Energy use euse Kg of oil equivalent per capita World Development Indicator
Fertility fert average number of children born OECD
per woman over a lifetime
Information & Communication ict % of population of internet users World Development Indicator Technology
Marriage marr marriages per 1000 people OECD
(Fertility)*(Marriage) fert*marr - -
_____________________________________Common statistics________________________________________________________
USA Canada
Variable Mean Maximum Minimum J-Bera Mean Maximum Minimum J-Bera______
Bcap 3.825 4.221 3.501 1.107 17.14 19.06 15.25 1.922 Euse 7591.2 8056.9 6869.5 4.390 7971.0 8441.2 7481.5 0.617 Fert 2.005 2.120 1.858 1.842 1.598 1.710 1.488 1.355 ICT 44.75 75.00 0.785 3.080 47.57 87.12 0.361 3.114 Marr 7.917 9.200 6.800 2.152 5.147 6.800 4.400 3.648 fertmar 15.87 18.97 12.63 1.644 1.598 1.710 1.488 1.355 Observations = 25 __________________________________________________________________________________________
Note: Fertility rate is the average number of children born per woman over a lifetime given current age-specific fertility rates and assuming no female mortality
during reproductive years, Marriage rate is the marriages per 1000 people, 1960-2016, Biocapacity is the capacity of the ecosystems to regenerate what people demand from those surfaces, Energy use is the Kg of oil equivalent per capita, and ICT is the % of population of internet users. J-Bera is the Jacque-Bera values.
Table 2: Panel unit root test_____________________________________________________________________________________
LLC IPS HADRI Integration
Variable c t c t c t ______ lnbcap -0.283 0.992 1.233 -2.239** 5.255* -0.331 mixed lneuse 0.141 -1.501 0.345 0.610 2.127** 3.777* I(1) lnfert -0.890 -0.400 -0.860 0.028 0.350 2.518* I (1) lnmarr -0.654 1.934 0.445 0.001 4.502* 2.294* I (1) lnict -3.326* -1.694** -2.334** 0.453 4.182** 4.132* mixed ln fertmar -0.494 0.500 0.242 1.152 4.069* 3.773* I (1) Δbcap -1.708** -0.447 -4.598* -3.570* -1.270 -1.398 mixed Δlneuse -3.248* -3.080* -3.524* -4.104* 1.265 7.038* Δlnfert -0.783 0.037 -1.179 -0.296 0.211 1.541 Δln marr -1.154 -1.183 -2.819* -1.867** 1.592 2.211** Δlnict 0.009 1.017 0.679 0.373 3.738* 1.109 Δln fertmar -0.592 -0.691 -1.365** -1.383** 2.906* 1.206 ____________________________________________________________________________________________________________ Cross-section dependence test
Breusch-Pagan LM Pesaran scaled LM Pesaran CD df (n=42)____
t-statistic 0.455 -1.799 -0.675 1
____________________________________________________________________________________________________________
Note: * and ** are statistical significance at 1% and 5% respectively. Δ indicates first difference. Lag selection by SIC of maximum lag of 4 for unit root estimations. LLC, IPS and HADRI are respectively the Levin, Lin and Chu (2002); Im, Pesaran and Shin (2003) and Hadri (2000) panel unit root tests.
Table 3: Pooled Mean Group Test with Dynamic ARDL specifications___________________________________________________ Dependent variable is lnbcap Model: PMG ARDL (1, 2, 2, 2, 2, 2)
Panel Long-run lneuse lnfert lnmarr lnict ln fertmar Adjustment parameter
-0.0003** 7.42* 2.58* 0.007* -1.01* -0.86** Panel Short-run 0.0005** -27.59* -7.02* -0.02 3.55* Short-run of cross-sections USA 0.0005* -20.47 -6.71** -0.02* 3.01* -0.78* CANADA 0.0002* -30.70 -7.03 -0.002* 4.06 -0.66* Diagnostic Tests
Wald Test F-statistics = 953.50* Chi-square = 4767.50*
Redundant Test F-statistics = 28.43* T-statistic = 5.33* Likelihood ratio = 24.02* (For fertmar)
Normality Test Skewness = 0.61 Kurtosis = 7.40
____________________________________________________________________________________________________________
Note: Number of observations = 39, Schwarz Information Criteria (AIC) with optimum lag length of 2. The redundant test’s null hypothesis is fert*marr (i.e interaction of fertility and marriage) are jointly insignificant. Wald test null hypothesis is no short-run relationship in the model. Also, lbcap, leuse, lfert, lmarr, lict, lfert*marr are the respective logarithmic values of biocapacity, energy use per capita, fertility rate, marriage rate, information and communication
Table 4: Panel Granger causality results by Dumitrescu and Hurlin (2012)____________ Null hypothesis w-stat ̅-stat P-value Direction of causality
bcap→ict 0.730 -0.313 0.754
ict→bcap 14.533 11.200 0.000* Uni-directional
fertmar →bcap 9.237 6.447 0.000* Uni-directional
bcap→ fertmar 0.746 -0.307 0.759
bcap→marr 5.176 3.217 0.001*
marr→ bcap 11.867 8.539 0.000* Bi-directional
euse→ fertility 10.35 7.711 1E-14* Bi-directional fertility→euse 4.945 3.203 0.001*
Note: * and ** are statistical significance level at 1% and 5% respectively and it indicates evidence of Granger causality.
(a)
Note: The 4th, 7th, 11th, and 15th Sustainable Development Goals (SDG) 2030 are respectively to ensure inclusive and
equitable quality education and promote lifelong learning opportunities for all, ensure access to affordable, reliable, sustainable, and modern energy for all, make cities and human settlements inclusive, safe, resilient and sustainable, and lastly protect, restore and promote sustainable use of terrestrial ecosystems, sustainably manage forests, combat
desertification, and halt and reserve land degradation and halt biodiversity loss.
(b)
Figure 3: (a) The association of the social-economic-environmental factors with SDGs 2030 and (b) is the relationships between the observed factors and the decomposed (components of the)
SDGs 2030.
SDGs
2030
Energy use Fertility and Marriage Biocapacity ICT 7th goal of SDGs 2030• Energy use
4th &7th goal of SDGs 2030• Information and Commuincation
Technology (ICT)
11th goal of SDGs 2030• Fertility
• Marriage
15th goal of SDGs 2030• Biocapacity
Appendix A
Variables lbcap leuse lfert lmarr lict l fertmar____
lbcap 1.00 leuse 0.55* 1.00 lfert -0.93* -0.47* 1.00 lmarr -0.86* -0.43* 0.91 1.00 lict -0.28*** 0.05 0.05 -0.18 1.00 l fertmar -0.90* -0.45* 0.96* 0.99* -0.11 1.00
Note: lbcap, leuse, lfert, lmarr, lict, lfert*marr are the respective logarithmic values of biocapacity, energy use per
capita, fertility rate, marriage rate, information and communication technology, and the interaction of fertility and marriage rates (fertmar). Also, * and *** are respectively the 1% and 10% statistical significance levels
B 2.72 2.76 2.80 2.84 2.88 2.92 2.96 90 92 94 96 98 00 02 04 06 08 10 12 14 LBIOCAPPERCAP 8.90 8.92 8.94 8.96 8.98 9.00 9.02 9.04 9.06 90 92 94 96 98 00 02 04 06 08 10 12 14 LEUSE .38 .40 .42 .44 .46 .48 .50 .52 .54 90 92 94 96 98 00 02 04 06 08 10 12 14 LFERT -2 -1 0 1 2 3 4 5 90 92 94 96 98 00 02 04 06 08 10 12 14 LICT
Figure 1: Time series plots for Canada
1.250 1.275 1.300 1.325 1.350 1.375 1.400 1.425 1.450 90 92 94 96 98 00 02 04 06 08 10 12 14 LBCAP -1 0 1 2 3 4 5 90 92 94 96 98 00 02 04 06 08 10 12 14 LEUSE .60 .62 .64 .66 .68 .70 .72 .74 .76 90 92 94 96 98 00 02 04 06 08 10 12 14 LFERT -1 0 1 2 3 4 5 90 92 94 96 98 00 02 04 06 08 10 12 14 LICT
C
List of Abbreviations
ARDL Autoregressive Distributed Lag Bcap Biocapacity
CSD Cross-section Dependency EC Error Correction
EFP Ecological Footprint EUSE Energy Use
Fert Fertility
FertMar Fertility and Marriage GDP Gross Domestic Product
GDPc Gross Domestic Product per Capita GHG Greenhouse Gas
GMM Generalized Method Moments
HO Null Hypothesis
H1 Alternative Hypothesis
ICT Information and Communication Technology LM Lagrange Multiplier
Marr Marriage
MG Mean Group
PMG Pooled Mean Group
SDGs Sustainable Development Goals
STIRPAT Stochastic Impacts by Regression on Population, Affluence and Technology UNFCCC United Nations Framework Convention on Climate Change
USA United States