JHEP08(2018)089
Published for SISSA by SpringerReceived: May 7, 2018 Revised: July 23, 2018 Accepted: August 6, 2018 Published: August 16, 2018
Measurements of b-jet tagging efficiency with the
ATLAS detector using t¯
t events at
√
s = 13 TeV
The ATLAS collaboration
E-mail:
[email protected]
Abstract: The efficiency to identify jets containing b-hadrons (b-jets) is measured
us-ing a high purity sample of dileptonic top quark-antiquark pairs (t¯
t) selected from the
36.1 fb
−1of data collected by the ATLAS detector in 2015 and 2016 from proton-proton
collisions produced by the Large Hadron Collider at a centre-of-mass energy
√
s = 13 TeV.
Two methods are used to extract the efficiency from t¯
t events, a combinatorial likelihood
approach and a tag-and-probe method. A boosted decision tree, not using b-tagging
infor-mation, is used to select events in which two b-jets are present, which reduces the dominant
uncertainty in the modelling of the flavour of the jets. The efficiency is extracted for jets
in a transverse momentum range from 20 to 300 GeV, with data-to-simulation scale
fac-tors calculated by comparing the efficiency measured using collision data to that predicted
by the simulation. The two methods give compatible results, and achieve a similar level
of precision, measuring data-to-simulation scale factors close to unity with uncertainties
ranging from 2% to 12% depending on the jet transverse momentum.
Keywords: Hadron-Hadron scattering (experiments)
JHEP08(2018)089
Contents
1
Introduction
1
2
The ATLAS detector and object reconstruction
2
3
Definition of b-tagging algorithms
5
4
Dataset and simulated event samples
5
5
Event selection
8
5.1
Multivariate event discriminant
10
6
Calibration methods
12
6.1
Tag-and-probe method
12
6.2
Combinatorial likelihood method
13
7
Systematic uncertainties
15
8
Results
17
8.1
Generator dependence of the efficiency scale factors
23
8.2
Smoothing of the efficiency scale factors
24
8.3
Reduction of the nuisance parameters
24
9
Conclusion
25
The ATLAS collaboration
30
1
Introduction
The identification of jets containing b-hadrons, referred to as b-jets, is vital for a large
part of the physics programme of the ATLAS experiment [
1
] at the CERN Large Hadron
Collider (LHC), including Standard Model (SM) precision measurements, studies of the
Higgs boson’s properties and searches for new physics beyond the SM. The algorithms
used to identify b-jets are referred to as b-tagging algorithms.
This paper describes a measurement of the b-jet tagging efficiency in proton-proton
collision data recorded at
√
s = 13 TeV during Run 2 of the LHC. A very pure t¯
t sample
is selected, as these events have a high b-jets purity by virtue of the t → W b branching
fraction being close to 100% [
2
]. The number of additional non-b-jets in the sample is
greatly reduced by requiring that both W bosons decay leptonically. Two methods are
used to measure the b-jet tagging efficiency: a new method which uses a tag-and-probe
approach, referred to as the Tag-and-Probe method (T&P); and a combinatorial likelihood
JHEP08(2018)089
approach, referred to as the Likelihood method (LH), which is based upon a method used
during Run 1 (
√
s = 7 TeV and
√
s = 8 TeV) of the LHC [
3
]. Having two methods enables
reciprocal cross-checks to be made between them.
The b-jet tagging efficiency, ε
b, is measured for jets in the pseudorapidity
1range
|η| < 2.5 and with transverse momentum p
T> 20 GeV for several operating points (OP).
Operating points are defined by sets of selection criteria imposed upon the output of the
b-tagging algorithm designed to provide a certain b-jet tagging efficiency. Four operating
points are defined, corresponding to 60%, 70%, 77% and 85% b-jet tagging efficiencies in
simulated t¯
t events. Two sets of four operating points are implemented to provide a
single-cut or a flat-efficiency operating point. The single-single-cut operating point provides the stated
b-jet tagging efficiency when averaged over the transverse momentum distribution of b-jets
in t¯
t events, but the efficiency varies with jet p
T. On the other hand, the flat-efficiency
operating point has a varying cut value, ensuring a constant b-jet tagging efficiency as a
function of the jet p
T. Results are also presented in the form of data-to-simulation efficiency
scale factors, defined as ε
datab
/ε
simb, where ε
databis the efficiency measured in data, while
ε
simbrepresents the efficiency predicted by simulation using Monte Carlo (MC)
generator-level information. In physics measurements, these scale factors can be applied jet by jet
to correct the rate of events after applying a b-tagging requirement. The scale factors
are measured for all operating points; however, this paper presents only results from a
number of selected working points as examples. Separate measurements have also been
made for the tagging efficiencies of jets containing c-hadrons, referred to as c-jets, and for
jets containing neither a b-hadron nor a c-hadron, referred to as light-flavour jets, and are
presented in ref. [
3
].
The paper is organised as follows. In section
2
, the ATLAS detector and physics
object reconstruction are described. Section
3
contains a description of the ATLAS
b-tagging algorithms. In section
4
, the data and simulated samples used in the b-jet tagging
efficiency measurements are presented. Section
5
summarises the event selection criteria
applied for both calibration methods, while in section
6
the T&P and LH methods are
presented in detail. In section
7
, the systematic uncertainties for each method are outlined,
and results are presented in section
8
. Finally, conclusions are given in section
9
.
2
The ATLAS detector and object reconstruction
The ATLAS detector [
1
] at the LHC covers nearly the entire solid angle around the collision
point. The detector comprises an inner tracking detector surrounded by a superconducting
solenoid producing a 2 T axial magnetic field, a system of calorimeters, and a muon
spec-trometer (MS) incorporating three large toroid magnet assemblies. The inner detector (ID)
consists of four layers of silicon pixel sensors and four layers of silicon microstrip sensors,
1ATLAS uses a right-handed coordinate system with its origin at the nominal interaction point (IP) in
the centre of the detector and the z-axis along the beam pipe. The x-axis points from the IP to the centre of the LHC ring, and the y-axis points upward. Cylindrical coordinates (r, φ) are used in the transverse plane, φ being the azimuthal angle around the z-axis. The pseudorapidity is defined in terms of the polar angle θ as η = − ln tan(θ/2). The angular distance ∆R is measured in η–φ phase space and is defined as p(∆η)2+ (∆φ)2, where ∆η and ∆φ are the differences between the φ and η of the two objects respectively.
JHEP08(2018)089
providing precision tracking in the pseudorapidity range |η| < 2.5. The innermost pixel
layer, referred to as the insertable B-layer (IBL) [
4
,
5
], was installed between Run 1 and
Run 2 of the LHC. The IBL provides a hit measurement at an average radius of 33.3 mm,
significantly closer to the interaction point than the closest pixel layer in Run 1 (radius of
50.5 mm). The additional pixel layer has a significant impact on the performance of both
the tracking and vertexing algorithms, resulting in improved b-tagging performance. A
straw-tube transition radiation tracker complements the measurements in the silicon layers
by providing additional tracking and electron identification information for |η| < 2.0.
High-granularity electromagnetic (EM) and hadronic sampling calorimeters cover the
region |η| < 4.9. All electromagnetic calorimeters, as well as the endcap and forward
hadronic calorimeters, use liquid argon as the active medium and lead, copper, or tungsten
absorber. The central hadronic calorimeter uses scintillator tiles as the active medium and
steel absorber. The muon spectrometer measures the deflection of muons with |η| < 2.7
using multiple layers of high-precision tracking chambers located in a toroidal field of
approximately 0.5 T or 1 T in the central and endcap regions of ATLAS, respectively.
The ATLAS detector incorporates a two-level trigger system, with the first level
im-plemented in custom hardware and the second level imim-plemented in software. This trigger
system reduces the output from the detector electronics to about 1 kHz for offline storage.
Vertices are reconstructed using tracks measured by the inner detector [
6
]. Events
are required to have at least one reconstructed vertex, with two or more associated tracks
which have p
T> 400 MeV. The primary vertex is chosen as the vertex candidate with the
largest sum of the squared transverse momenta of associated tracks.
Electrons are reconstructed from energy deposits (clusters) in the electromagnetic
calorimeter matched to tracks reconstructed in the ID [
7
,
8
]. Additionally, candidate
clus-ters in the calorimeter barrel/endcap transition region, defined by 1.37 < |η
cluster| < 1.52,
as well as those of poor quality, are excluded. Muons are reconstructed from track
seg-ments in the MS that are matched to tracks in the ID [
9
,
10
]. Combined muon tracks
are then re-fit using information from both the ID and MS systems. The lepton tracks
must be consistent with coming from the primary vertex of the event: the longitudinal
im-pact parameter z
0must satisfy |z
0sin θ| < 0.5 mm, while the transverse impact parameter
significance, |d
0|/σ(d
0) must be less than 5 for electrons or less than 3 for muons. To
re-duce the contribution from hadronic decays (non-prompt leptons), photon conversions and
hadrons misidentified as leptons, both the electrons and muons must also satisfy isolation
and identification criteria. The loose, medium and tight working points of the isolation and
identification algorithms are defined in ref. [
8
] for electrons, and in ref. [
10
] for muons. Two
types of leptons are defined for the analyses presented in this paper. First, signal lepton
candidates are required to have p
T> 27 GeV and |η| < 2.5, as well as to satisfy tight
track-and calorimeter-based isolation criteria. Signal electrons (muons) are required to pass the
medium electron (muon) identification criteria. Second, loose leptons are required to have
p
T> 7 GeV and |η| < 2.5, as well as to satisfy loose identification and loose track-only
isolation criteria.
Jets are reconstructed from three-dimensional topological energy clusters [
11
] in the
calorimeter using the anti-k
talgorithm [
12
] with a radius parameter of R = 0.4. These
JHEP08(2018)089
jets are referred to as calorimeter-jets. The clusters are calibrated to the electromagnetic
energy response scale prior to jet reconstruction. The reconstructed jets are then calibrated
to the jet energy scale (JES), corresponding to the particle scale,
2using corrections derived
from simulation and in situ corrections based on 13 TeV data [
13
]. Jets are required to have
calibrated p
T> 20 GeV and to be within the acceptance of the inner detector, |η| < 2.5.
Jet cleaning criteria are applied to identify jets arising from non-collision sources or noise
in the calorimeter [
14
,
15
]. Any event containing such a jet is removed. In order to reduce
the contamination from jets arising from additional pp collisions in the same or nearby
bunch crossings, called pile-up, a requirement on the Jet Vertex Tagger (JVT) [
16
] output
is made. The JVT algorithm combines tracking information into a multivariate algorithm
to reject jets which do not originate from the primary vertex, and is applied to jets with
p
T< 60 GeV and |η| < 2.4. Jets with p
T> 60 GeV are assumed to have originated from
the primary vertex.
Jets are also reconstructed from inner-detector tracks using the anti-k
talgorithm with
a radius parameter of R = 0.2. These jets are referred to as track-jets. The tracks used
in jet clustering are required to have p
T> 0.5 GeV and to be matched to the primary
vertex using impact parameter requirements on the tracks. Only track-jets with at least
two tracks and with p
T> 10 GeV and |η| < 2.5 are considered for the purposes of the
b-jet tagging efficiency measurement. The results presented in this paper correspond to
the jets reconstructed from the topological energy clusters in the calorimeter, which are
referred to as jets throughout. Equivalent b-jet efficiency measurements are also performed
for track-jets and the results made available to ATLAS analyses using those jets.
In order to avoid counting a single detector response as originating from two different
objects, an overlap removal procedure is applied to the jet candidates and leptons
pass-ing the loose quality requirement. To prevent double-countpass-ing of electron energy deposits
reconstructed as jets, the closest jet lying ∆R < 0.2 from a selected electron is removed.
Electron candidates that lie ∆R < 0.4 from a jet surviving the selection are discarded to
reduce the background from electrons that originate from heavy-flavour decays.
Further-more, to reduce the background from muons that originate from the decays of hadrons
containing a heavy quark inside selected jets, muon candidates are removed if they are
separated from the nearest selected jet by ∆R < 0.4. However, if this jet has fewer than
three associated tracks, the muon is kept and the jet is removed as it is likely that the
energy is deposited in the calorimeter by the muon.
The missing transverse momentum (with magnitude E
Tmiss) is defined as the negative
vector sum of the transverse momenta of all selected and calibrated physics objects in the
event, with an extra “soft” term added to account for low-momentum contributions from
particles in the event that are not associated with any of the selected objects. This term is
calculated using inner-detector tracks matched to the primary vertex to reduce the pile-up
contamination [
17
].
2The particle scale is defined as consisting of stable particles emerging from the p-p collision before
JHEP08(2018)089
3
Definition of b-tagging algorithms
A new multivariate b-tagging algorithm, referred to as MV2c10, was developed for Run 2,
and utilises a boosted decision tree (BDT). The algorithm is similar to the multivariate
algorithms developed during Run 1 [
3
], but with a dedicated optimisation carried out for
Run 2 to exploit the installation of the IBL and improved tracking software [
18
,
19
]. The
algorithms which provide the input variables for MV2c10 all exploit the relatively long
b-hadron lifetime: a likelihood-based combination of the transverse and longitudinal impact
parameter significances; the presence of a secondary vertex and related properties; and the
reconstruction of the b-hadron decay chain using a Kalman filter to search for a common
direction connecting the primary vertex to both the bottom and the tertiary charm decay
vertices. Additionally, the jet p
Tand jet η are included as BDT training variables to take
advantage of correlations with other variables. In order to avoid any difference between
the kinematic spectra of b-jets and background jets being used as a discriminating variable,
the b-jet p
Tand η spectra are reweighted to match the combined c-jet and light-flavour jet
spectrum. The BDT was trained on a subset of events from a simulated t¯
t sample, produced
with Powheg [
20
–
23
] interfaced with Pythia6 for the parton shower, hadronisation, and
the underlying event [
24
] and using the CT10 [
25
] parton distribution function set, as
described in more detail in section
4
. The BDT training is performed by assigning
b-jets as signal, and c-b-jets and light-flavour b-jets as background. In order to enhance the c-jet
rejection, the c-jet fraction in the training is set to 7%, and the light-flavour jet background
is set to 93%, as described in ref. [
19
].
The MV2c10 output for b-jets, c-jets and light-flavour jets in a t¯
t sample, which is
statistically independent from the training sample, is presented in figure
1(a)
. The rejection
rates for light-flavour jets and c-jets are defined as the inverse of the efficiency for tagging
a light-flavour jet or a c-jet as a b-jet, respectively. Figure
1(b)
shows the corresponding
light-flavour jet and c-jet rejection factors as a function of the b-jet tagging efficiency. The
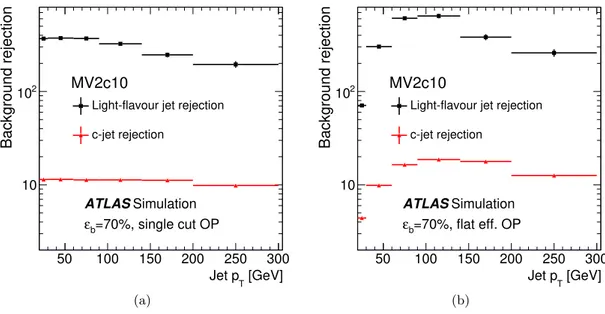
rejection rates for both the light-flavour jets and c-jets as a function of jet p
Tare given in
figure
2(a)
for the single-cut OP and figure
2(b)
for the flat-efficiency OP, both for a 70%
b-jet tagging efficiency.
4
Dataset and simulated event samples
The data used in these measurements were collected by the ATLAS detector from
proton-proton collisions in 2015 and 2016 at a centre-of-mass energy
√
s = 13 TeV with 25 ns proton
bunch spacing. The data correspond to a total integrated luminosity of 36.1 ± 1.2 fb
−1after
offline data quality selection, measured following ref. [
26
].
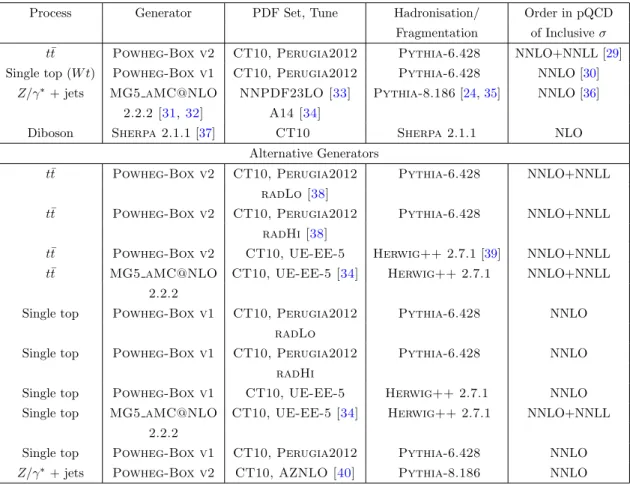
The dominant t¯
t process was modelled using the matrix-element generator
Powheg-Box v2 [
20
–
23
], which provides next-to-leading-order (NLO) accuracy in QCD. It used
the CT10 parton distribution function (PDF) set [
25
] and it was interfaced to Pythia
6.428 [
24
] with the Perugia 2012 set [
27
] of tuned parameters (tune) for the modelling of
the parton shower, fragmentation and the underlying event. The h
dampparameter, which
controls the p
Tof the first additional emission beyond the Born configuration, was set to
JHEP08(2018)089
1 − −0.8 −0.6 −0.4 −0.2 0 0.2 0.4 0.6 0.8 1 MV2c10 BDT output distribution 3 − 10 2 − 10 1 − 10 1 Event fraction |<2.5 η >20 GeV, | T jet p ATLAS Simulation t = 13 TeV, t s b-jets c-jets Light-flavour jets (a) 0.55 0.6 0.65 0.7 0.75 0.8 0.85 0.9 0.95 1 b-jet efficiency 10 2 10 3 10 4 10 Background rejection |<2.5 η >20 GeV, | T jet pLight-flavour jet rejection c-jet rejection
ATLAS Simulation
(b)
Figure 1. (a) The MV2c10 output for b-jets (solid line), c-jets (dashed line) and light-flavour jets (dotted line) in simulated t¯t events. (b) The light-flavour jet (dashed line) and c-jet rejection factors (solid line) as a function of the b-jet tagging efficiency of the MV2c10 b-tagging algorithm. The performance was evaluated on t¯t events simulated using Powheg interfaced to Pythia6.
50 100 150 200 250 300 [GeV] T Jet p 10 2 10 Background rejection
Light-flavour jet rejection c-jet rejection ATLAS Simulation =70%, single cut OP b ε MV2c10 (a) 50 100 150 200 250 300 [GeV] T Jet p 10 2 10 Background rejection
Light-flavour jet rejection c-jet rejection ATLAS Simulation =70%, flat eff. OP b ε MV2c10 (b)
Figure 2. The light-flavour jet (squares) and c-jet rejection factors (triangles) at a b-tagging efficiency of 70% corresponding to (a) the single-cut OP and (b) the flat-efficiency OP as a function of the jet pTfor the MV2c10 b-tagging algorithms in t¯t events simulated using Powheg interfaced
to Pythia6.
m
t= 172.5 GeV, a setting that was found to improve the description of the p
Tof the t¯
t
system when compared to data [
28
].
The dominant non-t¯
t process is the associated production of a single top quark and
a W boson (W t process), which also contains a large fraction of b-jets. Other processes
JHEP08(2018)089
Process Generator PDF Set, Tune Hadronisation/ Order in pQCD
Fragmentation of Inclusive σ
t¯t Powheg-Box v2 CT10, Perugia2012 Pythia-6.428 NNLO+NNLL [29]
Single top (W t) Powheg-Box v1 CT10, Perugia2012 Pythia-6.428 NNLO [30]
Z/γ∗+ jets MG5 aMC@NLO NNPDF23LO [33] Pythia-8.186 [24,35] NNLO [36]
2.2.2 [31,32] A14 [34]
Diboson Sherpa 2.1.1 [37] CT10 Sherpa 2.1.1 NLO
Alternative Generators
t¯t Powheg-Box v2 CT10, Perugia2012 Pythia-6.428 NNLO+NNLL
radLo [38]
t¯t Powheg-Box v2 CT10, Perugia2012 Pythia-6.428 NNLO+NNLL
radHi [38]
t¯t Powheg-Box v2 CT10, UE-EE-5 Herwig++ 2.7.1 [39] NNLO+NNLL
t¯t MG5 aMC@NLO CT10, UE-EE-5 [34] Herwig++ 2.7.1 NNLO+NNLL
2.2.2
Single top Powheg-Box v1 CT10, Perugia2012 Pythia-6.428 NNLO
radLo
Single top Powheg-Box v1 CT10, Perugia2012 Pythia-6.428 NNLO
radHi
Single top Powheg-Box v1 CT10, UE-EE-5 Herwig++ 2.7.1 NNLO
Single top MG5 aMC@NLO CT10, UE-EE-5 [34] Herwig++ 2.7.1 NNLO+NNLL
2.2.2
Single top Powheg-Box v1 CT10, Perugia2012 Pythia-6.428 NNLO
Z/γ∗+ jets Powheg-Box v2 CT10, AZNLO [40] Pythia-8.186 NNLO
Table 1. A summary of Monte Carlo generators used to simulate various physics processes, together with their basic parameter settings and corresponding cross-section order in pQCD at√s = 13 TeV. Whenever Pythia or Herwig++ is used for parton shower simulation, the parton shower PDFs are taken from CTEQ6L1.
such as Z/γ
∗+ jets and diboson production constitute only a small fraction of the sample.
Table
1
summarises the nominal MC generators used to simulate physics processes, along
with the alternative samples used to estimate the systematic uncertainties related to the
choice of MC generator and associated parameter settings. The contamination from t¯
t
produced in association with either a vector boson or a SM Higgs boson, and the
gluon-gluon fusion or vector-boson fusion production of a Higgs boson, which subsequently decays
into a pair of W bosons, were found to be negligible. Therefore, these processes are not
considered further.
Events in which one of the two selected lepton candidates is not a real prompt lepton
(e.g. one coming from a b/c hadron decay, a photon conversion, or a hadron misidentified
as a lepton) are referred to as misidentified lepton events, and are estimated from data by
changing the selection criterion from opposite-charge to same-charge leptons. In order to
avoid double counting the contribution of misidentified leptons which is already reproduced
by Monte Carlo, and to partially take into account a possible difference between
opposite-charge and same-opposite-charge lepton events, the contribution from simulated same-opposite-charge events
is subtracted from data for the estimate of the misidentified lepton background.
JHEP08(2018)089
The EvtGen [
41
] package was used with all the hadronisation/fragmentation
genera-tors, except for Sherpa, to model the decays of b- and c-hadrons. All simulated samples
were processed through the ATLAS detector simulation [
42
] based on GEANT4 [
43
].
Ad-ditional simulated pp collisions generated with Pythia8 [
35
] were overlaid on all simulated
samples to model the expected number of additional pile-up interactions in each event.
Simulated events are corrected so that the lepton and jet identification efficiencies,
en-ergy scales and enen-ergy resolutions match those determined from data control samples at
√
s = 13 TeV.
In the simulated samples, a reconstructed jet is labelled as a b-jet if, within ∆R = 0.3,
there is a matching weakly decaying b-hadron with p
T> 5 GeV. The flavour labelling is
exclusive, with the hadron matched to the closest jet in the ∆R phase space. If no b-hadron
is found, but a c-hadron is matched to the jet, then it is labelled as a c-jet. If there is no
b- or c-hadron, but a τ -lepton is matched to the jet, then it is labelled as a τ -jet, otherwise
it is labelled as a light-flavour jet.
5
Event selection
Events were recorded using triggers requiring at least one lepton, with lepton isolation
requirements and p
Tthresholds that vary depending on the data-taking conditions. In
2015 this threshold was 20 GeV for muons and 24 GeV for electrons, while in 2016 it
was raised to 26 GeV for both the electrons and muons. These triggers are combined
with higher-threshold triggers, of 50 GeV for muons and 60, 120 and 140 GeV for
elec-trons, without isolation requirements, to improve the trigger efficiency for leptons with
high transverse momentum.
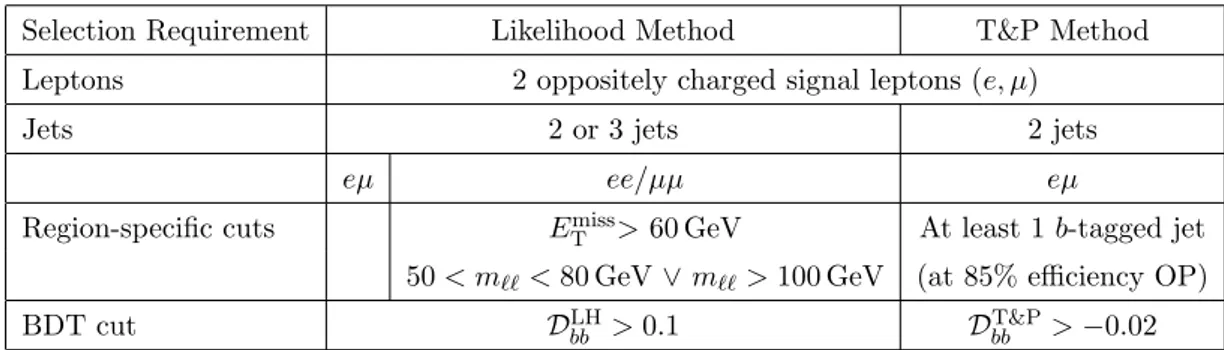
Table
2
summarises the event selection criteria specific to the Likelihood and T&P
methods. The events are selected by requiring two oppositely charged signal leptons (eµ,
ee or µµ) and two or three jets. One of the leptons must also be matched using a ∆R
requirement to one of the objects that triggered the event. A veto is applied to events
which contain one or more additional loose leptons.
The T&P method uses only the
t¯
t → eνµν + 2-jet category, with an additional requirement that at least one jet must be
tagged by the MV2c10 algorithm at the 85% single-cut efficiency OP. The LH method also
exploits events with exactly three jets, as well as events with same-flavour leptons in the
final state. For events with same-flavour leptons in the final state, additional requirements
of E
Tmiss> 60 GeV and dilepton invariant mass 50 < m
``< 80 GeV or m
``> 100 GeV are
applied to suppress the contamination from on-shell Z boson decays, multijet production
and decays of γ
∗, Υ and J/ψ particles. In the eµ + 2-jet channel of the LH (T&P) method,
a t¯
t purity of 82% (90%) is obtained, with sub-dominant contributions from single top,
Z/γ
∗+ jets and diboson processes and events containing a misidentified lepton. In the
eµ + 3-jet, `` + 2-jet and `` + 3-jet channels of the LH method, the t¯
t contribution is
88%, 71% and 79%, respectively. Figure
3
shows the jet p
Tand m
``distributions for
events passing the eνµν + 2-jet selection before any requirement on the MV2c10 output
is applied. Good agreement between the simulation and data is observed within the total
statistical and systematic uncertainties.
JHEP08(2018)089
Selection Requirement Likelihood Method T&P MethodLeptons 2 oppositely charged signal leptons (e, µ)
Jets 2 or 3 jets 2 jets
eµ ee/µµ eµ
Region-specific cuts Emiss
T > 60 GeV At least 1 b-tagged jet
50 < m``< 80 GeV ∨ m``> 100 GeV (at 85% efficiency OP)
BDT cut DLH
bb > 0.1 DbbT&P> −0.02
Table 2. The analysis regions and associated event selection criteria for the LH and T&P methods. The variables DLH
bb and D T&P
bb are BDT output discriminants trained to separate final states with
at least two b-jets from all other events, in the LH and T&P methods, respectively. More details of the training and performance of the BDTs is presented in section 5.1.
[GeV] T Jet p 0 50 100 150 200 250 300 Data/Pred. 0.5 1 1.5
Syst. + MC Stat. Uncertainty
Jets / bin 3 10 4 10 5 10 6 10 Data t t Diboson Misid. leptons Single top Z+jets -1 = 13 TeV, 36.1 fb s ATLAS 2 jets µ e (a) [GeV] ll m 0 50 100 150 200 250 300 350 400 Data/Pred. 0.8 1
1.2 Syst. + MC Stat. Uncertainty
Events / 16 GeV 0 2000 4000 6000 8000 10000 Data t t Diboson Misid. leptons Single top Z+jets -1 = 13 TeV, 36.1 fb s ATLAS 2 jets µ e (b)
Figure 3. The (a) jet pTdistribution and (b) m``distribution for the data (points) and simulated
samples (stacked histograms) for the eµ+ 2-jet selection in the LH method. The simulated samples are normalised to agree with a fit to the data as described in section6.2. The bottom panels show the ratio of the data to the simulated samples, with the dotted uncertainty bands corresponding to the total MC statistical uncertainty and systematic uncertainty.
For the purposes of the calibration methods, simulated events are categorised using
generator level information according to the flavours of the selected reconstructed jets. For
the two-jet selection, three possible jet flavour combinations are considered: bb, bj and jj,
where b represents a b-jet, and j is defined as a non b-jet. In the selected events, the c-jet
contribution is sufficiently small that it can be considered together with the light-flavour
jet component. In the same manner, for the three-jet selection, four possible jet flavour
combinations are considered: bbb, bbj, bjj and jjj. The dominant t¯
t process contributes
mostly to the bb and bj flavour combinations in the 2-jet channels, and to the bbj and
bjj flavour combinations in the 3-jet channels. After adding all background processes,
especially from Z/γ
∗+ jets decays, the fraction of non-b-flavour jets increases. The overall
JHEP08(2018)089
b-jet purity is calculated from simulation as the fraction of jets in the sample that are
labelled as b-jets. In the selected samples of eµ events, it is found to be 72% (82%) in
the two-jet case for the LH (T&P) method, while in the three-jet case it is 53%. For the
events with ee/µµ final states, the overall b-jet purity is 62% and 48% in the two-jet and
three-jet cases, respectively. As the number of background events containing at least one
misidentified lepton is estimated from data, and therefore the jet flavour composition is
unknown, it is assumed that only non-b-jets are produced in these events. A cross-check
was performed assuming that only b-jets are produced in these events, and found to have
a negligible effect on the calibration results.
5.1
Multivariate event discriminant
In order to further enhance the b-jet purity of the selected samples in both methods, boosted
decision trees (BDT) were trained using simulated events to separate final states with at
least two b-jets, defined as the signal, from all other events, classified as a background. Each
of the input variables is designed to select events with at least two b-jets based upon the
topology and kinematics of the event, rather than exploiting any flavour-tagging-related
properties of the jets, to ensure minimal bias in the MV2c10 discriminant. A dedicated
optimisation was performed for each method, leading to a different choice of input variables,
as shown in table
3
. In both the LH and T&P methods, the BDTs are trained using the
Toolkit for Multivariate Data Analysis, TMVA [
44
].
In the LH method, sample-selection BDTs are trained separately for the two- and
three-jet categories. The training samples include not only the nominal t¯
t sample, but also
the alternative t¯
t samples used for evaluating systematic uncertainties. The inclusion of
the alternative t¯
t samples provides a larger training sample and allows the BDT to learn
the topologies of events generated using alternative MC generators, helping to minimise
uncertainties in the calibration due to the choice of generator.
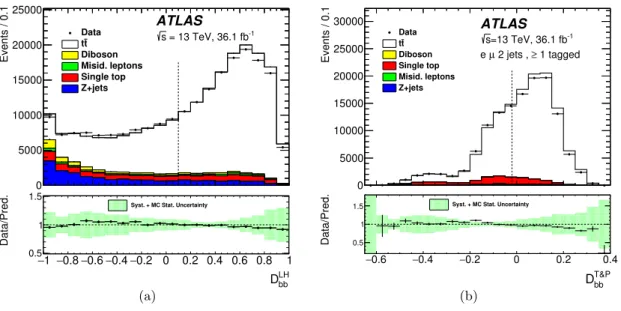
For both the LH and T&P methods, all input variables, as well as D
bbLHand D
T&Pbb, are
well modelled in simulation. The modelling of D
LHbbis shown in figure
4(a)
, combining all
four event categories used in the LH method. Good agreement between the simulation and
data is observed in all four channels. Only events with D
LHbb
> 0.1 are considered in the
measurement. This threshold is found to be optimal, as it minimises the total uncertainty
in the measurement of the calibration scale factor.
The modelling of D
bbT&Pis shown in figure
4(b)
. The selection requirement on the
BDT output was optimised such that it minimises the uncertainty associated with the
data-to-simulation scale factors, and is found to be D
T&Pbb> −0.02.
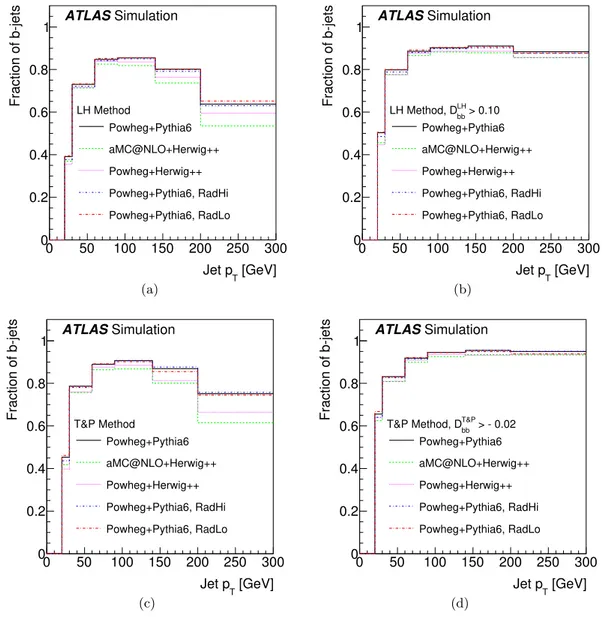
Figure
5
shows the fraction of b-jets in bins of jet p
Tboth before and after applying a
requirement on D
bbLH(D
T&Pbb) for the nominal and alternative t¯
t generators in the eµ + 2-jet
category of the LH (T&P) method.
JHEP08(2018)089
Variable Definition T&P LH
`1pT Leading lepton pT ×
Jet1 pT Leading jet pT × ×
Jet2 pT Sub-leading jet pT × ×
Jet3 pT Third-leading jet pT (events with 3 jets only) ×
ETmiss Missing transverse momentum ×
nFjets Number of jets with 2.5 < |η| < 4.5 ×
∆φ(j1, j2) ∆φ of leading 2 jets ×
min ∆R(j, j) Minimum ∆R of all jet combinations ×
Imbalance (jet1(pT)−jet2(pT))/(jet1(pT)+jet2(pT)) ×
mavgmin(`j) min((m(`1,jeti) + m(`2,jetk))/2), × ×
i, k = 1, 2 (1, 2, 3) for events with 2 (3) jets
min∆R(`1, j) Minimum ∆R separation of leading lepton from all jets × ×
min∆R(`2, j) Minimum ∆R separation of subleading lepton from all jets ×
Table 3. Input variables used in the T&P and LH method BDT algorithms. The “×” symbol in the T&P and LH columns indicates the BDT in which each variable is used. Quantities involving jets labelled ‘j’ correspond to central jets, with |η| < 2.5.
LH bb D 1 − −0.8−0.6−0.4−0.2 0 0.2 0.4 0.6 0.8 1 Data/Pred. 0.5 1 1.5
Syst. + MC Stat. Uncertainty
− − − − − Events / 0.1 0 5000 10000 15000 20000 25000 Data t t Diboson Misid. leptons Single top Z+jets -1 = 13 TeV, 36.1 fb s ATLAS (a) Events / 0.1 0 5000 10000 15000 20000 25000 30000 T&P bb D 0.6 − −0.4 −0.2 0 0.2 0.4 Data/Pred. 0.5 1
1.5 Syst. + MC Stat. Uncertainty
Data t t Diboson Single top Misid. leptons Z+jets ATLAS -1 =13 TeV, 36.1 fb s 1 tagged ≥ 2 jets , µ e (b)
Figure 4. The sample-selection BDT output distribution for the data (points) and simulated samples (stacked histograms) in (a) the combined ee/eµ/µµ + 2/3-jets sample used in the LH method and (b) for the eµ + 2-jets sample used in the T&P method. The simulated samples in the LH method are normalised to agree with a fit to the data as described in section 6.2, while in the T&P method, the normalisation is taken from the theoretical predictions. The cut applied to the DLHbb (DT&Pbb ) discriminant in the LH (T&P) method is indicated by a vertical dotted line. The bottom panels show the ratio of the data to the simulated samples, with the shaded uncertainty bands corresponding to the total MC statistical uncertainty and systematic uncertainty.
JHEP08(2018)089
[GeV] T Jet p 0 50 100 150 200 250 300 Fraction of b-jets 0 0.2 0.4 0.6 0.8 1 Powheg+Pythia6 aMC@NLO+Herwig++ Powheg+Herwig++ Powheg+Pythia6, RadHi Powheg+Pythia6, RadLo ATLAS Simulation LH Method (a) [GeV] T Jet p 0 50 100 150 200 250 300 Fraction of b-jets 0 0.2 0.4 0.6 0.8 1 Powheg+Pythia6 aMC@NLO+Herwig++ Powheg+Herwig++ Powheg+Pythia6, RadHi Powheg+Pythia6, RadLo ATLAS Simulation > 0.10 LH bb LH Method, D (b) [GeV] T Jet p 0 50 100 150 200 250 300 Fraction of b-jets 0 0.2 0.4 0.6 0.8 1 Powheg+Pythia6 aMC@NLO+Herwig++ Powheg+Herwig++ Powheg+Pythia6, RadHi Powheg+Pythia6, RadLo ATLAS Simulation T&P Method (c) [GeV] T Jet p 0 50 100 150 200 250 300 Fraction of b-jets 0 0.2 0.4 0.6 0.8 1 Powheg+Pythia6 aMC@NLO+Herwig++ Powheg+Herwig++ Powheg+Pythia6, RadHi Powheg+Pythia6, RadLo ATLAS Simulation > - 0.02 T&P bb T&P Method, D (d)Figure 5. The fraction of b-jets in the selected sample as a function of the jet pT, (a) before and
(b) after the requirement on DLH
bb , for the nominal and alternative t¯t generators in the eµ + 2-jet
category of the LH method. The fraction of b-jets in the selected sample as a function of the jet pT,
(c) before and (d) after the requirement on DT&Pbb , for the nominal and alternative t¯t generators in the eµ + 2-jet category of the T&P method.
6
Calibration methods
6.1
Tag-and-probe method
The sample used by the T&P method is 90% pure in t¯
t events, providing a high-purity
sample of b-jets. The b-jet tagging efficiency measurement is performed on a set of probe
jets, where a jet is considered a probe jet if the other jet is b-tagged at the 85% efficiency OP.
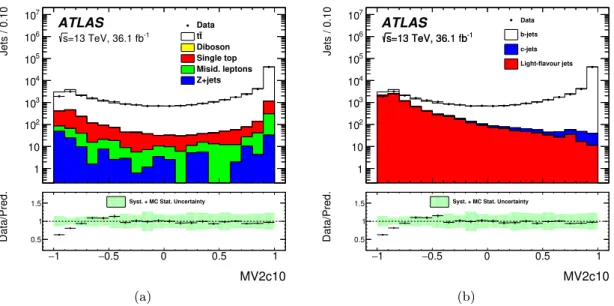
The MV2c10 distributions for probe jets in data and simulation are presented in
fig-ure
6
, broken down by both process and probe jet flavour.
Good agreement between
JHEP08(2018)089
simulation and data is observed in the b-jet dominated MV2c10 output region. In the
light-flavour jet dominated MV2c10 output region, some disagreement between simulation
and data is observed, however, this is accounted for by the light-flavour jet SFs and
as-sociated uncertainties [
3
]. The b-tagging efficiency is measured by first determining the
fraction of the probe jets that satisfy a given b-tagging criterion, f
tagged= N
pass/N , where
N is the total number of probe jets and N
passis the number of probe jets satisfying the
criterion. This fraction is measured in data by subtracting the contribution from non-t¯
t
processes, as predicted by simulation
f
tagged=
N
datapass− N
non-t¯passt,simN
data− N
non-t¯t,sim,
where N
datais the number of probe jets in data and N
non-t¯t,simis the number of probe jets
from non-t¯
t events predicted by simulation. It should be noted that non-t¯
t processes can
contribute b-jets as well as light-flavoured jets.
The determination of the b-jet tagging efficiency relies on the assumption that the
fraction of probe jets containing a tagged jet in data, f
tagged, is given by
f
tagged= f
bε
b+ (1 − f
b)ε
j,
where f
band (1 − f
b) are the fractions of b-jets and non-b-jets in t¯
t events, and ε
band ε
jare
the b-jet and non-b-jet tagging efficiencies. The b-jet tagging efficiency can be determined
by measuring f
taggedin data, and estimating the other parameters from simulation. In
this approach, jets are considered as uncorrelated objects within an event. The b-tagging
efficiency is extracted from f
taggedin bins of the jet p
Tε
b=
f
tagged− (1 − f
b)ε
jf
b.
The main sources of systematic uncertainty arise from the determination of f
band ε
j, as
both of these parameters are taken from simulation.
6.2
Combinatorial likelihood method
The LH method is performed separately for the eµ and combined ee/µµ final states in
the two- and three-jet bin categories due to differences in the background composition.
The yields of t¯
t and Z/γ
∗+ jets events are normalised using dedicated control samples in
data. The selection criteria applied to define these control regions are given in table
4
.
Normalisation factors are determined simultaneously with the maximum-likelihood fit to
the observed number of events in all regions, and used to scale the overall normalisation of
the t¯
t and Z/γ
∗+ jets processes. The values of the fitted normalisation factors, along with
their associated statistical uncertainties, are also presented in table
4
.
Unlike the T&P method, the LH method exploits the per-event jet correlations. For
example, in the case of events with two jets, the fraction of events with one b-tagged jet,
f
1-tag, or two b-tagged jets, f
2-tag, can be measured in data using
f
1-tag= 2f
bbε
b(1 − ε
b) + f
bj[ε
j(1 − ε
b) + (1 − ε
j) ε
b] + (1 − f
bb− f
bj) 2ε
j(1 − ε
j)
f
2-tag= f
bbε
2b+ f
bjε
jε
b+ (1 − f
bb− f
bj) ε
2j,
JHEP08(2018)089
Jets / 0.10 1 10 2 10 3 10 4 10 5 10 6 10 7 10 MV2c10 1 − −0.5 0 0.5 1 Data/Pred. 0.5 11.5 Syst. + MC Stat. Uncertainty
Data t t Diboson Single top Misid. leptons Z+jets ATLAS -1 =13 TeV, 36.1 fb s (a) Jets / 0.10 1 10 2 10 3 10 4 10 5 10 6 10 7 10 MV2c10 1 − −0.5 0 0.5 1 Data/Pred. 0.5 1
1.5 Syst. + MC Stat. Uncertainty
Data b-jets c-jets Light-flavour jets ATLAS -1 =13 TeV, 36.1 fb s=13 TeV, 36.1 fb-1 s (b)
Figure 6. The MV2c10 distribution of the probe jets used for the calibration in the T&P method, (a) broken down by process, and (b) probe jet flavour.
Control sample
eµ
ee/µµ
t¯
t
eµ selections
ee/µµ selections before D
LHbb
requirement
before D
bbLHrequirement
E
Tmiss> 60 GeV
50 < m
``< 80 GeV, or m
``> 100 GeV
NF (2-jet)
0.924 ± 0.004
0.906 ± 0.007
NF (3-jet)
1.010 ± 0.004
0.986 ± 0.008
Z/γ
∗+ jets
Same lepton flavour,
Same lepton flavour,
80 < m
``< 100 GeV
E
Tmiss> 60 GeV, 80 < m
``< 100 GeV
NF (2-jet)
1.104 ± 0.001
1.096 ± 0.005
NF (3-jet)
1.258 ± 0.002
1.281 ± 0.008
Table 4. Definition of the control samples in data used for the determination of the normalisation factors for t¯t and Z/γ∗+ jets processes in the LH method. The obtained normalisation factors (NFs) with their associated statistical uncertainties in each category are also presented.
where f
bjand f
bbare the fraction of events with one b-jet and two b-jets, respectively, and
ε
b(ε
j) is the b- (light-flavour) jet tagging efficiency. Using these equations, ε
bis determined
by measuring f
1−tagsand f
2-tagfrom data, with f
bj, f
bband ε
jdetermined from MC. In
this way, the correlation of the jet flavour information in the 1-tag and 2-tag regions is
added, resulting in a more precise efficiency measurement. A measurement in N kinematic
bins results in 2 × N
2coupled equations. It is possible to solve such a system of non-linear
equations, but in practice it is much simpler to model the same system by using a more
flexible and powerful likelihood function and solve the system numerically by maximising
the likelihood.
Using the probability density functions, P, the per-event likelihood term for the two
jets in the event to have transverse momenta p
T,1and p
T,2and MV2c10 weight outputs
JHEP08(2018)089
w
1and w
2is defined as
L
event(p
T,1, p
T,2, w
1, w
2) = [f
bbP
bb(p
T,1, p
T,2) P
b(w
1|p
T,1) P
b(w
2|p
T,2)
+f
bjP
bj(p
T,1, p
T,2) P
b(w
1|p
T,1) P
j(w
2|p
T,2)
+f
jjP
jj(p
T,1, p
T,2) P
j(w
1|p
T,1) P
j(w
2|p
T,2)
+1 ↔ 2 ]/2 ,
where P
f1f2(p
T,1, p
T,2) is a two-dimensional probability density function for jets of flavour
f
1and f
2to have transverse momenta p
T,1and p
T,2, and P
f(w, p
T) is a probability density
function of the b-jet tagging weight for a jet of flavour f at a given p
T. The factors f
bb, f
bj,
and f
jj= 1 − f
bb− f
bjare the overall flavour fractions in the two-jet case. All probability
density functions are determined from simulation, except the one for the b-jet weight, which
contains the information to be extracted from data.
The b-jet tagging efficiency corresponding to the MV2c10 weight cut of w
cutis given by
ε
b(p
T) =
Z
∞wcut
dw
0P
b(w
0, p
T).
For the extraction of the b-jet tagging efficiency for a single OP, P
b(w
0, p
T) corresponds
to a histogram with two w
0bins for each jet p
Tbin. The bin above w
cutcorresponds to
the b-jet tagging efficiency.
For events containing three jets, the likelihood is constructed in a way analogous to
the two-jet case, resulting in six equivalent likelihood terms instead of four.
A closure test was performed by applying the full method to the simulated events.
This sample of simulated events is normalised to an integrated luminosity of 36.1 fb
−1, and
is treated as “pseudo data” with the expected number of events in each bin taken as the
mean of a Poisson distribution to estimate the statistical uncertainty. The resulting scale
factors are close to unity within the statistical uncertainty of the pseudo data sample for
all bins except the lowest jet-p
Tbin in the 3-jet sample, verifying that the method has no
significant bias. An additional 3% uncertainty is added to cover the observed non-closure
in the lowest p
Tbin for the three-jet sample.
7
Systematic uncertainties
Three categories of systematic uncertainty are considered in the measurements presented.
First, MC generator modelling uncertainties that affect the modelling of kinematic
distri-butions and the jet flavour composition in simulated events. Second, normalisation
un-certainties that account for unun-certainties in the cross-section of simulated samples. Third,
experimental uncertainties, which are related to detector effects and the reconstruction of
the physics objects in the simulated samples.
Uncertainties from the MC generator modelling are evaluated in the simulated
t¯
t, single-top, and Z/γ
∗+ jets samples, by comparing the nominal samples to ones
created with alternative generators and settings.
The alternative generators induce
changes in the event kinematics and flavour composition, thereby affecting the
ex-tracted scale factors.
The difference between the scale factors is taken as the
sys-tematic uncertainty. Uncertainties are estimated for the predictions from the nominal
JHEP08(2018)089
t¯
t sample (Powheg+Pythia6), by altering the choice of parton shower and
hadroni-sation generator (Powheg+Herwig++) or by altering the matrix element generator
(MG5 aMC@NLO+Herwig++). Changing the settings of the nominal generator to
increase or decrease the amount of parton radiation and varying the choice of parton
distribution function (PDF) set (MG5 aMC@NLO+Herwig++ with CT10 PDFs or
PDF4LHC15 NLO PDFs) gives additional sources of uncertainty. Further uncertainties
due to the observed mismodelling of the top quark and t¯
t-system p
Tare evaluated by
tak-ing the difference between the default t¯
t prediction and a sample in which the top quark
and t¯
t-system p
Tdistributions are reweighted to match predictions at NNLO accuracy in
QCD [
45
,
46
]. For W t single-top production, uncertainties are estimated by varying the
parton shower and hadronisation modelling (Powheg+Herwig++) and varying settings
of the nominal generator to increase or decrease the amount of parton radiation. The
un-certainty in the treatment of the interference between W t and t¯
t is assessed by replacing
the nominal diagram removal (DR) scheme with a diagram subtraction (DS) scheme [
47
]
in Powheg+Pythia6. An additional 6% uncertainty is applied to the normalisation of
the single-top samples to account for the uncertainty in the predicted cross-section [
30
].
For the Z/γ
∗+ jets process, the nominal samples (MG5 aMC@NLO) are compared to
the alternative Powheg+Pythia8 sample. In addition an uncertainty is estimated for
the modelling of the jet p
Tspectrum in the Z/γ
∗+ jets events with the same-flavour
lep-tons in the final state by reweighting the spectrum to match the data in the Z/γ
∗+ jets
control sample.
To account for the extrapolation of the Z/γ
∗+ jets normalisation from the control
sample to the sample used in the b-tagging efficiency measurement, a 20% uncertainty in
the Z/γ
∗+jets estimate is applied. The size of this uncertainty is determined by comparing
the data to MC simulation in the relevant kinematic distributions. An additional 50%
uncertainty is applied to the events with at least one b- or c-jet, as observed in Z + b
measurements [
48
]. Due to the small contribution from the diboson backgrounds, only a
normalisation uncertainty is assigned to this sample. This uncertainty is assumed to be
50% in the two-jet channel, and 70% in the three-jet channel, as determined from MC
studies. Likewise for the backgrounds with misidentified leptons, only a normalisation
uncertainty of 50% is considered. Identical normalisation uncertainties are applied in the
LH and T&P methods.
In addition, in the T&P method, which has a tighter event selection than the LH
method, the uncertainties arising from the limited size of the simulated samples have a
non-negligible effect on the order of 1% on the total scale factor uncertainty. They are
evaluated using 10,000 pseudo experiments. In each pseudo experiment the efficiency and
the data-to-simulation scale factor in each jet p
Tbin is computed. The standard deviation
of the scale factor in all of the pseudo experiments is taken as the systematic uncertainty due
to limited MC sample size. The impact of MC statistical uncertainties is significantly lower
in the more inclusive LH method, and therefore the impact of MC statistical uncertainties
in the likelihood model itself is not considered.
The experimental uncertainties include those related to the reconstruction of electrons,
muons, jets and E
Tmiss, uncertainties in the mis-tagging of c- and light-flavour jets as b-jets,
JHEP08(2018)089
uncertainties in the modelling of pile-up and in the integrated luminosity. For both the
electrons [
8
] and muons [
10
], uncertainties are estimated for the energy scale and resolution,
as well as the reconstruction, identification, and trigger efficiencies using 13 TeV data. The
uncertainties in the jet energy scale and resolution are evaluated using 13 TeV data [
13
],
and so is an uncertainty in the efficiency of the JVT selection [
16
]. The uncertainties in
the energy scale and resolution of the jets and leptons are propagated to the calculation
of the E
Tmiss, which also has additional dedicated uncertainties from the momentum scale,
resolution and efficiency of the tracks not associated with any of the reconstructed objects,
along with the modelling of the underlying event. The predicted rate of mistakenly tagging
non-b-jets is corrected using data-to-simulation efficiency scale factors measured separately
for c-jets and light-flavour jets [
3
]. The uncertainty in this prediction is estimated by
varying these scale factors within their associated uncertainties. For Run 2 data, the c-jet
efficiency scale factor uncertainty varies from ∼ 15% for a jet p
Tof 100 GeV, to ∼ 30% for
a jet p
Tof 300 GeV. For light-flavour jets, the uncertainty varies from ∼ 40% for a jet p
Tof
100 GeV, to ∼ 30% for a jet p
Tof 300 GeV. The uncertainty due to the reweighting of the
distribution of the expected average number of interactions per bunch crossing, hµi, from
the simulation to the one measured in data is estimated by varying the nominal reweighting
scale factor by the size of the nominal correction. The uncertainty in the combined 2015
and 2016 integrated luminosity is 3.2%. It is derived, following a methodology similar to
that detailed in ref. [
26
], from a preliminary calibration of the luminosity scale using x–y
beam-separation scans performed in August 2015 and May 2016.
The effect of each source of systematic uncertainty on the b-jet tagging efficiency
data-to-simulation scale factors is computed by replacing the nominal simulated sample with the
sample affected by the systematic variation, and rerunning the fit to data. The uncertainty
is taken as a difference relative to the scale factor measured in the nominal case. When
combining all four channels in the LH method, all single systematic variations are treated
as fully correlated, except for the background modelling uncertainties, for which a 50%
correlation is assumed. This partial correlation is applied, as each modelling variation is
expected to account for more than one effect.
8
Results
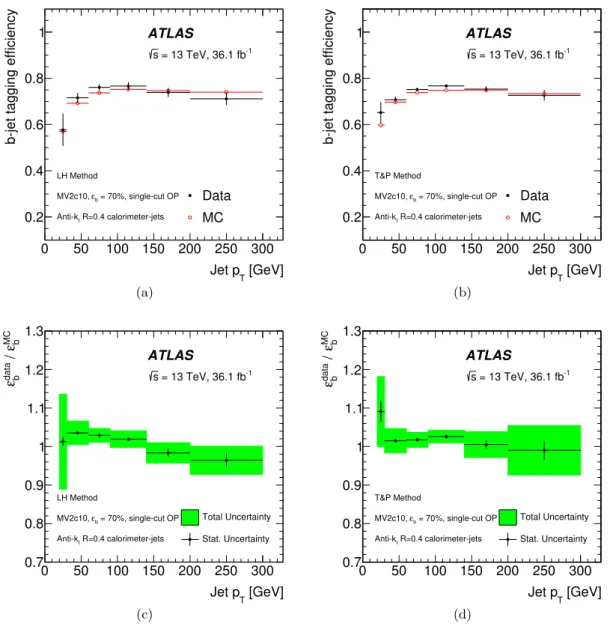
Figure
7
shows the measured efficiency in data and simulation and the data-to-simulation
scale factors as a function of the jet p
Tfor both the T&P and LH methods, corresponding to
the 70% b-jet tagging efficiency single-cut OP, for R = 0.4 calorimeter-jets. The efficiencies
determined in simulation and data agree within their uncertainties, resulting in scale factors
close to unity. It can be seen that the resulting data-to-simulation scale factors are in
agreement between the two methods, with similar central values and uncertainties. Scale
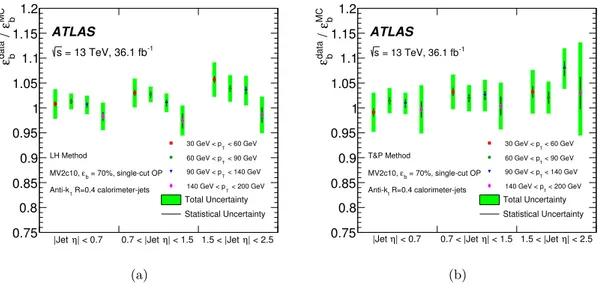
factors were also measured as a function of the average number of interactions per bunch
crossing, in selected p
Tbins, and the jet η, using both the LH and T&P methods, and are
shown in figures
8
and
9
, respectively, for the single-cut OP. The data-to-simulation scale
factors are observed not to have a strong dependence on either variable. The b-jet tagging
JHEP08(2018)089
[GeV]T
Jet p 0 50 100 150 200 250 300
b-jet tagging efficiency
0.2 0.4 0.6 0.8 1 Data MC -1 = 13 TeV, 36.1 fb s ATLAS = 70%, single-cut OP b ε MV2c10, R=0.4 calorimeter-jets t Anti-k LH Method (a) [GeV] T Jet p 0 50 100 150 200 250 300
b-jet tagging efficiency
0.2 0.4 0.6 0.8 1 Data MC ATLAS -1 = 13 TeV, 36.1 fb s T&P Method = 70%, single-cut OP b ε MV2c10, R=0.4 calorimeter-jets t Anti-k (b) [GeV] T Jet p 0 50 100 150 200 250 300 MCεb / dataεb 0.7 0.8 0.9 1 1.1 1.2 1.3 Total Uncertainty Stat. Uncertainty -1 = 13 TeV, 36.1 fb s ATLAS = 70%, single-cut OP b ε MV2c10, R=0.4 calorimeter-jets t Anti-k LH Method (c) [GeV] T Jet p 0 50 100 150 200 250 300 MCεb / dataεb 0.7 0.8 0.9 1 1.1 1.2 1.3 Total Uncertainty Stat. Uncertainty ATLAS -1 = 13 TeV, 36.1 fb s T&P Method = 70%, single-cut OP b ε MV2c10, R=0.4 calorimeter-jets t Anti-k (d)
Figure 7. Top: the b-jet tagging efficiency measured in data (full circles) and simulation (open circles), corresponding to the 70% b-jet tagging efficiency single-cut OP, as a function of the jet pT
using (a) the LH method and (b) the T&P method, for R = 0.4 calorimeter-jets. The error bars correspond to the total statistical and systematic uncertainties. Bottom: data-to-simulation scale factors as a function of the jet pT using (c) the LH method and (d) the T&P method. Both the
statistical uncertainties (error bars) and total uncertainties (shaded region) are shown.
efficiency in simulation varies by less than 1% over the range 0 < hµi < 50, and by up to
5% of the range 0 < |η| < 2.5.
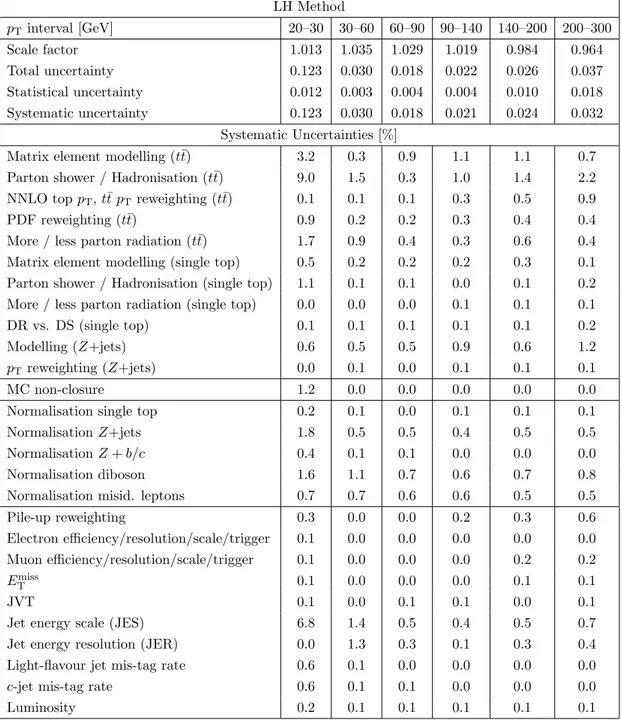
Tables
5
and
6
show the data-to-simulation scale factors, and the statistical, systematic
and total uncertainties separately for each p
Tbin. Depending on the p
Tbin, the total
uncertainties range between 2% and 12% for the LH method and 2% and 9% for the T&P
method, with the statistical uncertainty component ranging between 0.3% and 1.8% for
the LH method and 0.5% and 2.8% for the T&P method. A reduction in the statistical
uncertainty is achieved in the LH method by combining measurements from four channels,
JHEP08(2018)089
0 10 20 30 40 50 〉 µ 〈 0.7 0.8 0.9 1 1.1 1.2 MCεb / dataεb Total Uncertainty Stat. Uncertainty -1 = 13 TeV, 36.1 fb s ATLAS < 60 GeV T 20 < jet p R=0.4 calorimeter-jets t Anti-k LH Method = 70%, single-cut OP b ε MV2c10, (a) 0 10 20 30 40 50 〉 µ 〈 0.7 0.8 0.9 1 1.1 1.2 MCεb / dataε b Total Uncertainty Stat. Uncertainty -1 = 13 TeV, 36.1 fb s ATLAS < 300 GeV T 60 < jet p R=0.4 calorimeter-jets t Anti-k LH Method = 70%, single-cut OP b ε MV2c10, (b) 〉 µ 〈 0 10 20 30 40 50 MCεb / dataεb 0.7 0.8 0.9 1 1.1 1.2 Total Uncertainty Stat. Uncertainty ATLAS -1 = 13 TeV, 36.1 fb s = 70%, single-cut OP b ε MV2c10, < 60 GeV T 20 < jet p R=0.4 calorimeter-jets t Anti-k T&P Method (c) 〉 µ 〈 0 10 20 30 40 50 MCεb / dataεb 0.7 0.8 0.9 1 1.1 1.2 Total Uncertainty Stat. Uncertainty ATLAS -1 = 13 TeV, 36.1 fb s = 70%, single-cut OP b ε MV2c10, < 300 GeV T 60 < jet p R=0.4 calorimeter-jets t Anti-k T&P Method (d)Figure 8. Data-to-simulation scale factors, corresponding to the 70% b-jet tagging efficiency single-cut OP using R = 0.4 calorimeter-jets, as a function of the average number of interactions per bunch crossing, < µ >, for the LH method in the (a) 20 < pT < 60 GeV region, (b) 60 <
pT < 300 GeV region, and for the T&P method in the (c) 20 < pT < 60 GeV region, (d)
60 < pT < 300 GeV region. Both the statistical uncertainties (error bars) and total uncertainties
(shaded region) are shown.
as well as exploiting the correlations in the events, while in the case of the T&P method
only the eµ + 2-jet channel is used. The systematic uncertainty component varies from
1.5% to 8.6% depending on the jet p
Tfor the T&P method, while in the case of the LH
method, the effect of systematic uncertainties ranges between 1.8% and 12%. However, in
the LH method, the total uncertainty is smaller for a larger jet-p
Trange, and this method
is therefore used as the default b-jet calibration. The dominant sources of uncertainty
in both methods relate to the modelling of the t¯
t sample and alter the predicted flavour
JHEP08(2018)089
| < 0.7 η
|Jet 0.7 < |Jet η| < 1.5 1.5 < |Jet η| < 2.5
0.75 0.8 0.85 0.9 0.95 1 1.05 1.1 1.15 1.2 MC b ε / data b ε < 60 GeV T 30 GeV < p < 90 GeV T 60 GeV < p < 140 GeV T 90 GeV < p < 200 GeV T 140 GeV < p Total Uncertainty Statistical Uncertainty R=0.4 calorimeter-jets t Anti-k = 70%, single-cut OP b ε MV2c10, LH Method -1 = 13 TeV, 36.1 fb s ATLAS (a) | < 0.7 η
|Jet 0.7 < |Jet η| < 1.5 1.5 < |Jet η| < 2.5
MC b ε / data b ε 0.75 0.8 0.85 0.9 0.95 1 1.05 1.1 1.15 1.2 < 60 GeV T 30 GeV < p < 90 GeV T 60 GeV < p < 140 GeV T 90 GeV < p < 200 GeV T 140 GeV < p Total Uncertainty Statistical Uncertainty R=0.4 calorimeter-jets t Anti-k = 70%, single-cut OP b ε MV2c10, T&P Method -1 = 13 TeV, 36.1 fb s ATLAS (b)
Figure 9. Data-to-simulation scale factors, corresponding to the 70% b-jet tagging efficiency single-cut OP, as a function of the jet |η|, in (a) the LH method, and (b) the T&P method, for R = 0.4 calorimeter-jets. Both the statistical uncertainties (error bars) and total uncertainties (shaded region) are shown.
composition, to which both methods are particularly sensitive. The application of the
sample-selection BDT reduces the impact of these uncertainties by up to 50% due to the
increase of the b-jet purity and the removal of regions of phase space which have large
modelling uncertainties. At very low and high jet p
T, the uncertainties related to the
measurement of the jet energy scale and resolution also become significant. Normalisation
and modelling of the Z/γ
∗+ jets background, as well as the normalisation of the diboson
backgrounds have a larger effect in the LH method than in the T&P method. This is due
to the inclusion of the events with three jets and events with the same-flavour leptons in
the final state, as these regions have a larger contribution from the Z/γ
∗+ jets and diboson
backgrounds.
An additional uncertainty is included to extrapolate the measured uncertainties to
higher jet p
T, which is not measured here but is of interest in some physics analyses.
This term is calculated from simulated events by considering variations of the quantities
affecting the b-tagging performance such as the impact parameter resolution, percentage
of poorly measured tracks, description of the detector material, and the track multiplicity
per jet. The dominant effect on the uncertainty when extrapolating at high p
Tis related to
the different tagging efficiencies after smearing the tracks’ impact parameters according to
the resolutions measured in data and simulation. The difference in the impact parameter
resolution is due to effects from alignment, dead modules and additional material not
properly modelled in the simulation. The impact of the b-tagging efficiency uncertainty
increases with jet p
Tand reaches 15% above 1.5 TeV.
Similar measurements were conducted for other types of reconstructed jets and other
b-tagging OPs used within the ATLAS physics program, and are used accordingly. As an
additional example, figure
10
presents the measured data-to-simulation scale factors as a
JHEP08(2018)089
LH Method pTinterval [GeV] 20–30 30–60 60–90 90–140 140–200 200–300 Scale factor 1.013 1.035 1.029 1.019 0.984 0.964 Total uncertainty 0.123 0.030 0.018 0.022 0.026 0.037 Statistical uncertainty 0.012 0.003 0.004 0.004 0.010 0.018 Systematic uncertainty 0.123 0.030 0.018 0.021 0.024 0.032 Systematic Uncertainties [%]Matrix element modelling (t¯t) 3.2 0.3 0.9 1.1 1.1 0.7 Parton shower / Hadronisation (t¯t) 9.0 1.5 0.3 1.0 1.4 2.2 NNLO top pT, t¯t pTreweighting (t¯t) 0.1 0.1 0.1 0.3 0.5 0.9
PDF reweighting (t¯t) 0.9 0.2 0.2 0.3 0.4 0.4
More / less parton radiation (t¯t) 1.7 0.9 0.4 0.3 0.6 0.4 Matrix element modelling (single top) 0.5 0.2 0.2 0.2 0.3 0.1 Parton shower / Hadronisation (single top) 1.1 0.1 0.1 0.0 0.1 0.2 More / less parton radiation (single top) 0.0 0.0 0.0 0.1 0.1 0.1
DR vs. DS (single top) 0.1 0.1 0.1 0.1 0.1 0.2
Modelling (Z+jets) 0.6 0.5 0.5 0.9 0.6 1.2
pTreweighting (Z+jets) 0.0 0.1 0.0 0.1 0.1 0.1
MC non-closure 1.2 0.0 0.0 0.0 0.0 0.0
Normalisation single top 0.2 0.1 0.0 0.1 0.1 0.1
Normalisation Z+jets 1.8 0.5 0.5 0.4 0.5 0.5
Normalisation Z + b/c 0.4 0.1 0.1 0.0 0.0 0.0
Normalisation diboson 1.6 1.1 0.7 0.6 0.7 0.8
Normalisation misid. leptons 0.7 0.7 0.6 0.6 0.5 0.5
Pile-up reweighting 0.3 0.0 0.0 0.2 0.3 0.6 Electron efficiency/resolution/scale/trigger 0.1 0.0 0.0 0.0 0.0 0.0 Muon efficiency/resolution/scale/trigger 0.1 0.0 0.0 0.0 0.2 0.2 Emiss T 0.1 0.0 0.0 0.0 0.1 0.1 JVT 0.1 0.0 0.1 0.1 0.0 0.1
Jet energy scale (JES) 6.8 1.4 0.5 0.4 0.5 0.7
Jet energy resolution (JER) 0.0 1.3 0.3 0.1 0.3 0.4
Light-flavour jet mis-tag rate 0.6 0.1 0.0 0.0 0.0 0.0
c-jet mis-tag rate 0.6 0.1 0.1 0.0 0.0 0.0
Luminosity 0.2 0.1 0.1 0.1 0.1 0.1
Table 5. Data-to-simulation scale factors and associated uncertainties for the 70% b-jet tagging efficiency single-cut operating point of the MV2c10 b-jet tagging algorithm using the LH method, for R = 0.4 calorimeter-jets, as a function of the jet pT.
function of the jet p
Tfor both the T&P and LH methods, corresponding to the 85% b-jet
tagging efficiency single-cut OP for R = 0.4 calorimeter-jets.
Scale factors for the anti-k
tR = 0.2 track-jets at the 70% single-cut OP are
pre-sented in figure
11
. The efficiencies determined in simulation and data agree within their
uncertainties, resulting in scale factors close to unity.
JHEP08(2018)089
[GeV] T Jet p 0 50 100 150 200 250 300 MCεb / dataεb 0.7 0.8 0.9 1 1.1 1.2 1.3 Total Uncertainty Stat. Uncertainty -1 = 13 TeV, 36.1 fb s ATLAS = 85%, single-cut OP b ε MV2c10, R=0.4 calorimeter-jets t Anti-k LH Method (a) [GeV] T Jet p 0 50 100 150 200 250 300 MCεb / dataεb 0.7 0.8 0.9 1 1.1 1.2 1.3 Total Uncertainty Stat. Uncertainty ATLAS -1 = 13 TeV, 36.1 fb s T&P Method = 85%, single-cut OP b ε MV2c10, R=0.4 calorimeter-jets t Anti-k (b)Figure 10. Data-to-simulation scale factors, corresponding to the 85% b-jet tagging efficiency single-cut OP, as a function of the jet pT, in (a) the LH method, and (b) the T&P method, for
R = 0.4 calorimeter-jets. Both the statistical uncertainties (error bars) and total uncertainties (shaded region) are shown.
[GeV] T Jet p 0 50 100 150 200 250 MCεb / dataεb 0.7 0.8 0.9 1 1.1 1.2 1.3 Total Uncertainty Stat. Uncertainty -1 = 13 TeV, 36.1 fb s ATLAS = 70%, single-cut OP b ε MV2c10, R=0.2 track-jets t Anti-k LH Method (a) [GeV] T Jet p 0 50 100 150 200 250 MCεb / dataεb 0.7 0.8 0.9 1 1.1 1.2 1.3 Total Uncertainty Stat. Uncertainty ATLAS -1 = 13 TeV, 36.1 fb s T&P Method = 70%, single-cut OP b ε MV2c10, R=0.2 track-jets t Anti-k (b)
Figure 11. Data-to-simulation scale factors as a function of the jet pTusing (a) the LH method
and (b) the T&P method for R = 0.2 track-jets. Both the statistical uncertainties (error bars) and total uncertainties (shaded region) are shown. The results correspond to the 70% b-jet tagging efficiency single-cut operating point of the MV2c10 b-tagging algorithm.