Modeling and Forecasting Meat Consumption per Capita in Turkey Doğukan ÖZEN1, Mustafa Agah TEKİNDAL2, Mustafa Bahadır ÇEVRİMLİ3
1 Ankara University, Faculty of Veterinary Medicine, Department of Biostatistics, Ankara-TURKEY 2 Selçuk University, Faculty of Veterinary Medicine, Department of Biostatistics, Konya-TURKEY
3 Selçuk University, Faculty of Veterinary Medicine, Department of Livestock Economics and Management, Konya-TURKEY Corresponding author: Doğukan ÖZEN ; E-mail: [email protected]; ORCID:0000-0003-1943-2690
How to cite: Özen D, Tekindal MA, Çevrimli MB. Modeling and Forecasting Meat Consumption per Capita in Turkey. Erciyes Üniv Vet Fak Derg 2019; 16(2): 122-129.
Summary: The objective of this study is to model the per capita consumption of red meat in Turkey employing various time series methods, evaluate the forecasting capability of the developed models, and address the variables that may affect the per capital consumption of red meat using the cointegration method on a term basis (short/long). The materi-al of the study consists of the per capita consumption of red meat, totmateri-al annumateri-al population, feed prices, gross domestic product and share of agriculture in gross domestic product in Turkey between 1993 and 2017. ARIMA (0,1,0) and Brown's exponential smoothing method were employed to model the time series data for per capita consumption of red meat, and Johansen method was used to address the cointegration relationship between per capita consumption of red meat and the other variables. The results of the modelling work suggest that per capita consumption of red meat has an increasing trend. Additionally, a statistically significant short-term relationship was found between per capita consumption of red meat and the other variables. Given the relationship between consumption of red meat and level of economic development, the projections concerning red meat consumption are important from the viewpoint of the poli-cies that will be formulated.
Key words: ARIMA, modeling, red meat consumption, time series
Türkiye’de Kişi Başına Düşen Et Tüketiminin Modellenmesi ve Geleceğe Yönelik Tahmini
Özet: Bu araştırmanın amacı Türkiye’de kişi başına düşen kırmızı et tüketiminin çeşitli zaman serisi yöntemleri ile mod-ellenmesi, oluşturulan modellerin öngörü yeteneğinin değerlendirilmesi ve kişi başına düşen kırmızı et tüketim miktarına etki edebilecek değişkenlerin dönemsel bazda (kısa-uzun) kointegrasyon yöntemi ile incelenmesidir. Çalışmanın materyalini 1993-2017 yılları arasında Türkiye’de kişi başına düşen kırmızı et tüketimi, yıllık toplam nüfus, besi yemi fiyatları, gayri safi yurtiçi hasıladan tarım ve hayvancılık sektörünün payı ve toplam gayrisafi yurt içi hasıla bilgileri oluşturmaktadır. Kişi başına düşen kırmızı et tüketimi serisinin modellenmesi için ARIMA (0,1,0) ve Brown üstel düzgünleştirme yöntemleri kullanılmış olup, kişi başına düşen kırmızı et tüketimi ile elde edilen diğer değişkenler arasındaki koentegre ilişki Johansen yöntemi ile incelenmiştir. Modelleme sonuçlarına göre kişi başına düşen kırmızı et tüketiminde artan bir trend öngörülmektedir. Ayrıca kişi başına kırmız et tüketimi ile elde edilen tüm değişkenler arasın-da istatistiksel açıarasın-dan anlamlı kısa dönemli bir ilişki bulunmuştur. Kırmızı et tüketiminin ekonomik gelişmişlik ile olan ilişkisi düşünüldüğünde yapılan projeksiyonların, oluşturulacak politikalar açısından önemli olduğu düşünülmektedir. Anahtar kelimeler: ARIMA, kırmızı et tüketimi, modelleme, zaman serisi
Introduction
As the world population is growing, the demand for meat and meat products that have an important place in human health and nutrition is steadily increasing. Consumption of red meat and meat products is cru-cial for ensuring healthy and balanced nutrition in Turkey where the population is increasing rapidly. The average share of animal production in total agri-cultural production in Turkey in 2017 was 58%. About thirty seven percent of that was production of animal products. The share of red meat production in total production of animal products was 44.1%. Eighty seven percent (87.8%) of the total production of red meat was beef, 9% mutton and 3.1% goat meat (23).
One of the primary criteria used to determine the countries' level of development is the per capita con-sumption of meat and animal protein (27). The per capita consumption of red meat in Turkey is 14.6 kg, which is far below the average values in Europe and the US (19). The primary factor affecting the level of red meat consumption is the structure of the demand for red meat, and the two important factors that con-tribute to the formation of this demand are price of red meat and average income of consumers. Akbay et al. (1) note that the price elasticity and income elasticity of demand for red meat are -1.89 and 0.32, respectively. Some other studies in the literature re-port that the price elasticity of demand for red meat is -1.59 (4) and -1.22 (3).
The dynamic structure of consumption preferences and the socioeconomic changes affect consumption
Geliş Tarihi/Submission Date : 28.02.2019 Kabul Tarihi/Accepted Date : 30.05.2019
Araştırma Makalesi / Research Article 16(2), 122-129, 2019
of foods, including red meat. Hence, the measuring of the level of red meat consumption in different periods and projections based on such data can provide valu-able information that can be used to ensure efficient and sustainable production and formulate policies aimed at consumers.
The previous studies concerning red meat consump-tion in Turkey usually focused on the modelling of supply and demand in an econometric context, em-ploying various statistical analysis methods such as linear approximated almost ideal demand system (LA/AIDS) (3,16,21), linear regression analysis (9), logistic regression (24), Bayesian MCMC (4), and ARIMA (8, 25, 26). However, no study that focuses specifically on the co-integration between various factors that may affect red meat consumption through modelling of per capita consumption of red meat us-ing time series data could be found.
The objective of this study is (i) to model the per capi-ta consumption of red meat in Turkey between 1993 and 2017 employing Box-Jenkins and Brown's Expo-nential Smoothing methods, (ii) to evaluate the fore-casting capability of the developed models, and (iii) to address the variables that may affect the per capita consumption of red meat using the co-integration method on a term basis (short/long).
Material and Methods
Data collection tools and process
The data for the study consist of the total production of red meat (tons), total population (people), feed prices (annual average compound feed prices for growing and fattening), agricultural gross domestic product (share of agriculture, TURKSTAT - constant prices of 1998), total gross domestic product (USD$) and per capita consumption of red meat (kg/person) (14) (19,23,28).
Statistical analyses
Forecasts were made using the Box-Jenkins and Brown's exponential smoothing methods in the time series analyses. The Box-Jenkins method is com-posed of the combination of autoregressive model (AR) and moving average (MA) model of stationary time series. However, the Box-Jenkins method re-quires the time series to be stationary. In order to make the series stationary, d difference of the series is taken. Then, it is included in the ARMA model to obtain the ARIMA (autoregressive integrated moving average) model.
Such non-seasonal models are denoted by ARIMA (p,d,q). In an ARIMA model, p is the degree of the autoregressive model (AR), q is the degree of the moving average model (MA) and d is the degree of the non-seasonal differences taken. The ARMA
mod-el is as given in equation [1] (5,6).
[1] Equation (2) is obtained when the first difference of the nonstationary time series is taken.
[2]
If the time series is still not stationary, its second difference (d=2) is taken.
[3] If the series is still not stationary, the differencing is repeated until it becomes stationary. Thus, the ARI-MA (p,d,g) model is obtained (7).
[4]
After testing the stationarity of the series using ADF (Dickey-Fuller) unit root test, the forecasts of each series for the period 2018-2023 were made using the ARIMA model. The autocorrelation and partial auto-correlation functions of each series were reviewed and the significance of the parameters were checked to determine the best ARMA (p,d,q) model. In select-ing the optimum forecastselect-ing model that gives the best results for the period 2014-2017, the information criteria such as RMSE, MAE, MAPE, and SIC were used, and the forecasts were made using this model. Another method employed to make forecasts in the study was Brown's exponential smoothing method, which is used when the series has a trend. In the exponential smoothing method, the additive model is as follows:
[5] Where
[6]
The equation of the updated trend component is giv-en in equation [7].
[7]
The equations for simple, double and triple exponen-tial smoothing of the updated component are given in
[8], [9] and [10], respectively. [8]
[9] [10] In the formula, denotes the forecast for the next period (t+1), the forecast for the previous period and the smoothing coefficient or weight. Following the completion of the parameter forecasts of the models, the Q-statistic developed by Box-Pierce (Ljung-Box) was used to check the goodness of fit of the model to the data, employing the error terms.
Additionally, the relationships between the per capita consumption of red meat and the total production of red meat (tons), total population (people), feed pric-es, agricultural gross domestic product (share of agri-culture) and gross domestic product (USD$) between 1993 and 2017 were tested by cointegration analysis technique. Prior to the cointegration test, the station-arity of the series was checked using the Augmented Dickey-Fuller (ADF) and Phillips-Perron (PP) unit root tests. After confirming that the series were integrated of the same order, the co-integration test was con-ducted using the Johansen method. The Johansen method uses the maximum likelihood approach to estimate the co-integration vector, and is basically a generalized version of the Dickey-Fuller method.
[11] Here, X denotes the vector of the variables repre-sented by past values. This denotation refers to the variables using the past model values in the VAR model. If we express the model in moving averages, we obtain the following equation.
[12]
The rank r of matrix A gives the number of matched vectors, and in equations where r<p the variable with dimension p can be at most one less than the num-ber of vectors. The error term has white noise pro-cess. [13]
,...,
2
,
1
,
...
1 1
X
X
e
t
X
t t k t k t k ke
e
I
e
A
(
)
1
...
' 1 1...
,
)
(
k eI
e
A
The coefficients matrix П is the sum of the matrices α and with dimension (pxr). α denotes the adjust-ment rate, and denotes the matrix obtained by maximum likelihood method where the number of rows is equal to the number of cointegrating vectors. Then, this method is used to evaluate the hypothesis that there is at most r cointegrating vectors through maximum likelihood estimation.
Q [14]
The critical values to which the statistical values of and , obtained from the tests, are highlighted in the study by Johansen and Juselius (18).
In order to determine the common lag length of the variables in the equation, the Final Prediction Error (FPE), Hannan-Quinn (HQ), Schwarz (SW), Likeli-hood Ratio (LR) and Akaike Information Criterion (AIC) were used. The short- and long-term relation-ships were determined using the Johansen method, and forecasts for per capita consumption of red meat were made using the optimum error correction model. All analyses were conducted using Stata 12 MP4 (Licence: 9869264) and EViews 10 Enterprise Edition (Retrieved 17 June 2017).
Results
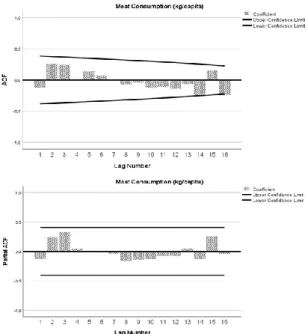
Time series graph of per capita consumption of red meat is given in Figure 1. The data for per capita consumption of red meat between 1993 and 2017 presents a plateau between 1993 and 2007, a de-creasing trend between 2007 and 2009 and an in-creasing trend between 2009 and 2017 (Figure 1). The results of the augmented Dickey-Fuller test con-ducted to check the stationarity of the series after its logarithmic transformation indicate that the series was not stationary before taking its difference (t=-1.254; P=0.758) and became stationary after taking its first difference (D1) (t=-11.258; P=0.001) (Figure 1). In addition to the stationarity tests for the series, the autocorrelation function (ACF) and partial auto-correlation function (PACF) coefficients were calcu-lated and graphed (Figure 2) in an attempt to deter-mine the AR(p) and MA(q) values required to develop a forecast model for red meat consumption.
The graphs of ACF and PACF coefficients indicate that none of the coefficients is outside the confidence
'
'
ln(
2
p r i iT
1)
1
ln(
)
trace
maxinterval (Figure 2). This suggests that the optimum ARIMA model for forecasting the per capita con-sumption of red meat is (0,1,0) model.
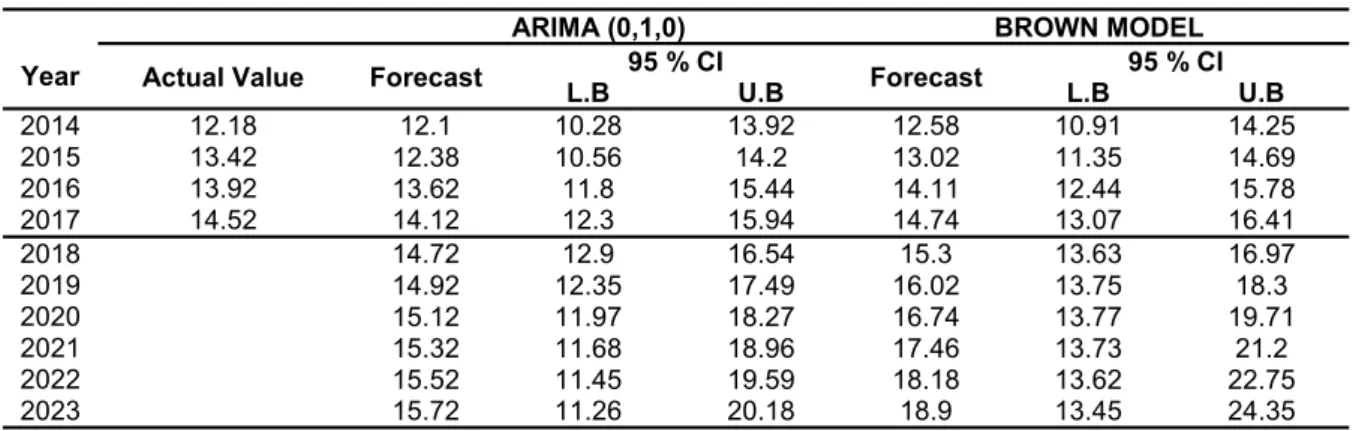
Table 1 and Figure 3 give the forecast values of per capita consumption of red meat for the period 2018-2023. Accordingly, both the ARIMA and Brown mod-els forecast that per capita consumption of red meat has an increasing trend (Table 1).
The results of the Q-test conducted to confirm the suitability of the models for forecasting indicate that both models are suitable (QARIMA=18.51; P=0.423,
QBrown=10.83; P=0.865). The goodness of fit criteria
for both models are given in Table 2.
Although the values of the goodness of fit criteria for the models were quite close to each other, Brown model provided better results in all of the criteria, excluding maximum absolute error (MaxAE) and maximum absolute percentage error (MaxAPE). This suggests that Brown's exponential smoothing model can provide more consistent results than the ARIMA model, as shown by the calculations of the forecast values.
Longitudinal price graphs of the variables are given in supplement data. Accordingly, the share of agricul-ture in gross domestic product has a decreasing trend, whereas the gross domestic product, feed pric-es, amount of red meat production and population have an increasing trend (Supplement data).
The series were checked for stationarity prior to the cointegration test. The results of the ADF and PP tests are given in Table 3. The results in Table 3 indi-cate that all of the variables have a unit root.
The coefficients of the Final Prediction Error (FPE), Hannan-Quinn (HQ), Schwarz (SW), Likelihood Ratio (LR) and Akaike Information Criterion (AIC) calculat-ed to determine the common lag length of the varia-bles in the equation are given in Table 4.
The results in Table 4 indicate that all criteria provide the same result as the optimum lag length. Hence, the necessary synchronization can be used as an optimal lag in a synchronicity study.
The test results obtained by the Johansen method in the co-integration study are given in Table 5. Accord-ing to the results in Table 5, a statistically significant co-integration relationship was found between the variables (P<0.05). At an error margin of 5%, there is a quite short-term relationship between the variables.
Figure 1. Per capita consumption of red meat between 1993 and 2017 (kg/person)
Figure 2. (a) Autocorrelation function (ACF) and (b) partial autocorrelation function (PACF) graphs for per capita con-sumption of red meat
Figure 3. Forecast values for per capita consumption of red meat between 2018 and 2023, obtained from ARIMA and Brown models
Tablo 1. Forecast values of per capita consumption of red meat for the period 2018-2023
ARIMA (0,1,0) BROWN MODEL Year Actual Value Forecast L.B 95 % CI U.B Forecast L.B 95 % CI U.B 2014 12.18 12.1 10.28 13.92 12.58 10.91 14.25 2015 13.42 12.38 10.56 14.2 13.02 11.35 14.69 2016 13.92 13.62 11.8 15.44 14.11 12.44 15.78 2017 14.52 14.12 12.3 15.94 14.74 13.07 16.41 2018 14.72 12.9 16.54 15.3 13.63 16.97 2019 14.92 12.35 17.49 16.02 13.75 18.3 2020 15.12 11.97 18.27 16.74 13.77 19.71 2021 15.32 11.68 18.96 17.46 13.73 21.2 2022 15.52 11.45 19.59 18.18 13.62 22.75 2023 15.72 11.26 20.18 18.9 13.45 24.35
CI: Confidence Interval, LB: Lower Bound, UB: Upper Bound
Tablo 2. Goodness of fit criterias for the models used for forecasting
Model Fit Criteria ARIMA (0,1,0) Brown Model
R-squared 0.833 0.851 RMSE 0.877 0.809 MAPE 7.904 6.915 MaxAPE 23.918 25.536 MAE 0.727 0.63 MaxAE 2.22 2.37 Normalized BIC -0.124 -0.295
RMSE: Root mean square error, MAPE: Mean absolute percentage error, MaxAPE: Maximum absoulte percentage error, MAE: Mean absolute error, MaxAE: Maximum absolute error, BIC: Bayesian information criteria
Variables ADF PP
∆ Meat consumption (OECD), kg/capita -5.381 -5.324
∆ GDP (current US $) -4.747 -4.703
∆ Fixed capital investments on agricultural GDP) (TURKSTAT) - 1998 at fixed prices
-6.742 -9.576
∆ Price of fattening feed -4.423 -4.723
∆Total population (person) -4.428 -4.428
∆Total amount of red meat produced (tonnes) -5.539 -5.551
Tablo 3. Results of ADF ve PP test statistics
∆ Meat Consumption (OECD), kg/capita ∆ GDP (current US$)
∆ Fixed capital investments on agricultural GDP) (TURKSTAT) - 1998 at fixed prices ∆ Price of fattening feed
∆Total population (person)
∆Total Amount of Red Meat Produced (tonnes), variables, first differences were taken, constant and trending were added to unit root research. Critical values for ADF and PP are -3.62% for 5%. ∆HBA variable was taken into regression analysis with first degree difference, not constant and without trend. The critical value for the 5% is 1.96
Discussion and Conclusion
One of the areas in which the agricultural production statistics are the most questionable is the forecast of red meat production. However, it is important to have almost accurate figures concerning red meat produc-tion and formulate producproduc-tion policies accordingly, because there is a significant positive relationship between red meat production and level of economic development (20). The forecasts for total and per capita consumption of red meat were made based on the actual data. This can be accounted for by the fact that unregistered slaughters are actually higher, as highlighted by Yavuz et al. (25), and by the difference of methods employed by national and international organizations such as TURKSTAT, FAO, Agricultural Economics Research Institute (TEAE), etc.
The time series for per capita consumption of red meat do not tend to move around a constant average over time, meaning that they are not stationary. The unit root tests also confirm this finding. The main rea-sons for the structural breaks in the trend of the se-ries include abrupt changes in policy, economic fluc-tuations and crises, factors that cannot be predeter-mined such as import of carcass and livestock for slaughter and breeding, and other socioeconomic developments (22).
Considering the accuracy of the forecasts by the ARI-MA and Brown models for the period 2014-2017, it can be said that both models are quite successful. For the period 2018-2023, the ARIMA model fore-casts a horizontal trend, whereas the Brown model predicts that the increasing trend after 2009 will con-tinue in the same way.
In order to make accurate forecasts, it is essential that the data are accurate and reliable. Additionally, we chose to look into the co-integration relationship between per capita consumption of red meat, GDP and agricultural GDP, as they are among the data taken into account concerning the countries' level of
development, these figures are collected more relia-bly than many other data in Turkey, and they can be obtained retrospectively.
A significant portion of cointegration studies are ra-ther based on hypothesis testing aimed at proving the existence of a cointegration relationship. Hence, such studies consider the purpose of forecasting more rarely. The reason for this is that the presence of long -term relationships between variables is usually a prediction of the theoretical model. The earliest stud-ies concerning forecasting in cointegration systems were conducted by Engle and Yoo (11), Engle et al. (12), Fanchon and Wendel (13), Hall et al. (15), and Hoffman and Rasche (17). Duy and Thoma (10) scru-tinized the relevant literature. The error correction models used to make forecasts in this study may not be considered favourable forecast models in every aspect. Thus, the analysis was conducted to show the presence of the cointegration relationship be-tween only the relevant variables in accordance with the literature.
It was found that there was a short-term cointegration relationship between per capita consumption of red meat and real GDP per capita, prices, population, total red meat production. This short-term relationship should be addressed from two viewpoints. One of them is the factors affecting the organizations that produce red meat, and the other one is the factors affecting the consumers that buy the produced meat. An example of the major factors affecting the red meat producers in Turkey is the import of carcass and livestock for slaughter in various amount and subject to various customs duties since 2010 (2). Another major factor is the decreasing profitability of enterprises due to increasing cost of inputs (feed material, feed price, etc.) because of the fluctuations in the exchange rate, combined with the import of livestock for slaughter, and the subsequent failure to achieve the expected increase in the level of total red meat production, as they gave up the production pro-cess. The decreasing production, which is insufficient Hypothesized
No. of CE(s) Eigenvalue
Trace Statistic 0.05 Critical Value P** 0.389 15.411 15.494 0.0515 0.0389 0.187 4.567 3.841 0.0326 0.0187
Tablo 5. Results of the Johansen cointegration test statistics testi sonuçları
** Trace statistics and maximum eigenvalue statistics show that there is a cointegrated vector at 1% and 5% significance level. The cointegration test does not include linear deterministic constant constraint and trend
Lag LogL LR FPE AIC SC HQ
0 -1298.104 NA 7.15e+41 113.400 113.696 113.474 1 -1179.970 164.361 6.37e+38 106.258 108.331 106.779 2 -1117.100 54.669* 1.35e+38* 103.921* 107.772* 104.890*
* indicates lag order selected by the criterion, LR: sequential modified LR test statistic (each test at 5% level), FPE: Final pre-diction error, AIC: Akaike information criterion, SC: Schwarz information criterion, HQ: Hannan-Quinn information criterion
to meet the demand, brings with it price increases, thereby reducing the consumers' demand for red meat. The demand for red that increases again as a result of suppression of prices as a result of the im-port policy followed during various periods as a measure against the rising prices can account for this short-term relationship from the viewpoint of consum-ers. Among the short-term effects for consumers in Turkey is the falling demand for red meat due to the decreasing purchasing power of consumers as a result of increasing inflation recently. The abovemen-tioned examples account for the upward and down-ward diversity of lower and upper limits of the fore-cast models in this study.
One of the major nutritional problems in Turkey is that people have an unbalanced and inadequate diet. This diet is predominantly composed of cereals and vegetables, and the level of consumption of animal products is below that in developed countries. Moreo-ver, the gap between Turkey's and developed coun-tries' per capita consumption of red meat is even larg-er.
The comparison of the forecasts and actual figures did not provide any clear information concerning the superiority of any of the models to the other one. In order to take right decisions regarding the food and agricultural policies to be followed, there is need for development of suited time series analysis models in the projections aimed at resolution of the sector's structural problems. It can be said that the structural problems have not been able to be resolved for long and that some political practices concerning the live-stock sector are in a vicious circle.
Records should be kept reliably at both macro and micro (enterprise) level in the livestock sector so that time series models can be developed and similar studies can be conducted more soundly. Introduction of a reliable registration system involving the live-stock sub-sectors in Turkey is of great importance. If a proper and reliable registration system is intro-duced to ensure better resolution of the long-standing problems in the livestock sector, more reliable fore-casts can be made for the sub-sectors, thereby allow-ing long-lastallow-ing government policies to be implement-ed. This study will give ideas to future studies focus-ing on different livestock sub-sectors.
References
1. Akbay C, Bilgiç A, Miran B. Demand estimation for basic food products in Turkey. Turkish J Agri Econ 2008; 14(2): 55-65.
2. Akın AC, Arıkan MS, Çevrimli MB. Effect of import decisions in Turkey between 2010-2017 on the red meat sector. First International Health Scienc-es and Life CongrScienc-ess. May,2-5, 2018; Burdur, Turkey.
3. Armağan G, Akbay C. An econometric analysis of urban households’ animal products consumption in Turkey. Appl Econ 2008; 40(15): 2029-36. 4. Bilgic A, Yen ST. Demand for meat and dairy
products by Turkish households: A bayesian cen-sored system approach. Agr Econ 2014; 45(2): 117-27.
5. Box GEP, Jenkins GM, Reinsel GC, Ljung GM. Time series analysis: Forecasting and control. USA: Holden Day Inc, 2015; p:47.
6. Box GEP, Pierce DA. Distribution of residual auto-correlations in autoregrresive integrated moving average time series models. J Am Stat Assoc 1970; 65(332): 1509-26.
7. Brockwell P, Davis R. Introduction to Time Series and Forecasting. Second. Ed., Springer, 2002; p:179.
8. Cenan N, Gurcan IS. Türkiye çiftlik hayvan sayılarının ileriye yönelik projeksiyonu: ARIMA modellemesi. Vet Hekim Der Derg 2014; 82(1): 35-42.
9. Dagdemir V, Demir O, Keskin A. Estimation of supply and demand models for chicken meat in Turkey. J Appl Anim Res 2004; 25(1): 45-8. 10. Duy TA, Thoma MA. Modelling and forecasting
cointegrated variables: Some practical experi-ence. J Bus Econ Stat 1998; 50(3): 291-307. 11. Engle RF, Yoo BS. Forecasting and testing in
cointegrated systems. J Econom 1987; 35(1): 143 -59.
12. Engle RF, Granger CWJ, Hallman JJ. Merging short and long-run forecasts: an application of seasonal cointegrating to monthly electricity sales foreacasting. J Econom 1989; 40(1): 45-62. 13. Fanchon P, Wendel J. Estimating VAR models
under non-stationarity and cointegration: alterna-tive approaches for forecasting cattle prices. Appl Econ 1992; 24(2):107-217.
14. Faostat. Food and Agricultural Organization. http://faostat.fao.org; Access Date: 12.09.2018. 15. Hall DA, Anderson HM, Granger, CWJ. A
cointe-gration analysis of treasury bill yields. Rev Econ Stat 1992; 74(1): 116-26.
16. Hatırlı SA, Öztürk E, Aktaş AR. An analysis of demand of red meat, sheep and chicken using full demand system approach. J Suleyman Demirel Uni Inst Soc Sci 2007; 6(2): 211-21.
performance in a cointegrated system. J Appl Econom 1996; 11: 495-517.
18. Johansen S, Juselius K. Maximum likelihood esti-mation and inference on cointegration with appli-cations to the demand for money. Oxford B Econ Stat 1990; 52(2): 169-210.
19. OECD. Meat consumption indicator. https:// data.oecd.org/agroutput/meat-consumption.htm; Accessed Date: 15 December 2018.
20. Pensel NA. The future of red meat in human diet: outlook on agriculture. Int Cent Agricult Biosci 1997; 26: 159-64.
21. Sacli Y, Özer OO. Analysis of factors affecting red meat and chicken meat consumption in Tur-key using an ideal demand system model. Pak J Agr Sci 2017; 54: 933-42.
22. Sevüktekı̇n M, Nargeleçekenler M. Ekonometrik Zaman Serileri Analizi. Ankara: Nobel Yayınevi, 2007; s.397.
23. TURKSTAT. Turkish Statistical Institute, Agricul-tural statistics database. http://www.tuik.gov.tr; Accessed Date: 22.09.2018.
24. Uzunöz M, Karakaş G. Socio-economic determi-nants of red meat consumption in Turkey: A case study. Çankırı Karatekin Univ J Instit Soc Sci 2014; 5(1): 37-52.
25. Yavuz F, Zulauf RC. Introducing a new approach to estimating red meat production in Turkey. Turk J Vet Anim Sci 2004; 28(4): 641-8.
26. Yavuz F, Bilgic A, Terin M, Guler IO. Policy impli-cations of trends in Turkey’s meat sector with respect to 2023 vision. Meat Sci 2013; 95(4): 798-804.
27. Yaylak E, Taşkın T, Koyunbenbe N, Konca Y. A study on determination of red meat consumption behaviours in Ödemiş, İzmir. Agric Prod 2010; 5 (1): 21-30.
28. YEM-BİR. Türkiye Yem Sanayicileri Birliği, Ac-cess: http://www.yem.org.tr/, Accessed Date: 18.10.2018.