The relationship between clinical and laboratory findings
and duration of sleep where oxygen saturation remains
below 90–95% in obstructive sleep apnea
Suat Avc›1, Aynur Y›lmaz Avc›2, Berna Devrim Ya¤basan3, Hüseyin Günizi1 1
Department of Otolaryngology, Faculty of Medicine, Baflkent University, Ankara, Turkey 2
Department of Neurology, Faculty of Medicine, Baflkent University, Ankara, Turkey 3
Department of Chest Diseases, Faculty of Medicine, Baflkent University, Ankara, Turkey
Correspondence: Suat Avc›, MD. Department of Otolaryngology, Faculty of Medicine, Baflkent University, Ankara, Turkey.
e-mail: [email protected]
Online available at: www.entupdates.org doi:10.2399/jmu.2016001010 QR code:
Özet: Obstrüktif uyku apnesinde oksijen satürasyonunun
%90-95 alt›nda kald›¤› durumlarda uyku süresi ile klinik ve laboratuvar bulgular› aras›ndaki iliflki
Amaç: Bu çal›flman›n amac› obstrüktif uyku apnesinde (OUA); CT90ve
CT95de¤erleri ile fizik muayene parametreleri, kronik metabolik hasta-l›klar, sigara içimi, ortalama trombosit hacmi, beyin manyetik rezonans görüntülemesinde (MRG) hiperintens odak varl›¤› ve say›s› aras›ndaki iliflkileri saptamakt›.
Yöntem:Hastanemiz uyku laboratuvar›nda 2011–2014 tarihleri
ara-s›nda polisomnografi uygulanan 1154 olgu retrospektif olarak taran-d›. Bu hastalardan kulak burun bo¤az muayenesi yap›lm›fl, beyin MRG, CBC ve biyokimya tetkikleri bulunan 72 olgu çal›flmaya dahil edildi. Tüm hastalarda ayr›nt›l› anamnez ile birlikte (1) Vücut kitle in-deksi (VK‹), (2) boyun ve kar›n çevresi ölçümü, (3) orofarenks muaye-nesi, (4) fiberoptik endoskop ile Müller manevras› uygulamas›, (5) Ep-worth uyku skalas› ve (6) polisomnografi (PSG) tetkikleri yap›ld›.
Bulgular:Olgular›n OUA fliddetine göre da¤›l›m›: %22.2 basit horlama,
%19.4 hafif, %19.4 orta ve %38.9 a¤›r OUA idi. Çoklu do¤rusal regresyon analizi yap›ld›¤›nda apne-hipopne indeksi (AH‹) (p=0.026) ve vücut kitle indeksinin (VK‹) (p=0.013) CT90’› etkileyen ba¤›ms›z de¤iflkenler oldu¤u (R2=%49) görüldü. Çoklu do¤rusal regresyon analizi yap›ld›¤›nda sigara içimi (p=0.001), AH‹ (p=0.003) ve hiperintens odak say›s›n›n (p=0.013) CT95’i etkileyen ba¤›ms›z de¤iflkenler oldu¤u (R2=%47.9), diyabet ve VK‹ ile CT95iliflkisinin istatistiksel olarak anlaml› olmad›¤› görüldü.
Sonuç:CT95de¤erinin sigara içiminden etkileniyor olmas›, ancak
retro-palatal ve retroglossal Müller evreleri ile istatistiksel anlaml› iliflkisi bu-lunmamas› nedeniyle, obstrüktif uyku apnelilerde kronik entermitan hi-poksi fliddetinin de¤erlendirilmesinde CT90de¤erinin dikkate al›nmas›-n›n daha uygun oldu¤u düflünülmüfltür. Bununla birlikte CT90de¤erinin AH‹ ile korelasyonu ST90için literatürde belirtilen de¤ere yak›n, ancak daha güçlü de¤ildir.
Anahtar sözcükler:Obstrüktif uyku apnesi, uyku süresi, klinik,
labora-tuvar.
Abstract
Objective:The aim of the present study was to determine correlations
between CT90and CT95values and physical examination parameters, chronic metabolic diseases, smoking, mean platelet volume, cerebral magnetic resonance imaging (MRI), presence and number of hyperin-tense foci in obstructive sleep apnea (OSA).
Methods:A total of 1154 patients who underwent polysomnography in
our sleep laboratory between 2011 and 2014 were screened retrospec-tively. Among them, 72 cases who underwent ear, nose and throat exam-inations, cerebral MR, CBC and biochemical tests were included in the study. All patients underwent a detailed anamnesis together with (1) measurements of BMI (body mass index) (2) circumferences of neck and abdomen, (3) examination of oropharynx, (4) Müller maneuver with the aid of fiberoptic endoscope, (5) estimation of Epworth sleep scale scores, (6) and polysomnographic (PSG) tests.
Results: According to the severity of OSA, the patients had simple snor-ing (22.2%), mild (19.4%) and severe OSA (38.9%). In multivariate regression analysis, body mass index (BMI) (p=0.026) and apnea/hypop-nea index (AHI) (p=0.013) were seen as independent variables affecting CT90(R2=49%). Multivariate linear regression analysis demonstrated that independent variables of smoking (p=0.001), AHI (p= 0.003) and number of hyperintense foci (p=0.013) affected CT95(R2=%47.9), while relation-ships between diabetes, BMI and CT95were not statistically significant.
Conclusion:Since CT95values are affected by smoking without any statis-tically significant correlation with retropalatal and retroglossal Müller stages, we think that consideration of CT90value will be more appropriate in the evaluation of the severity of chronic intermittent hypoxia in patients with obstructive sleep apnea. However, the correlation between CT90value and AHI is closer to the value indicated in the literature, but not stronger.
Keywords:Obstructive sleep apnea, duration of sleep, clinical,
Obstructive sleep apnea (OSA) is a prevalently seen syn-drome characterized by recurrent collapses and intermittent hypoxia of upper respiratory tract. Impairment of gas exchange leads to oxygen desaturation, hypercapnia and fragmentation of sleep with resultant metabolic, neurocog-nitive and cardiovascular disorders.[1]
Apnea/hypopnea index (AHI) is used in the determination of the severity of OSA; however, AHI does not provide information about the dura-tion of apnea and its morphology.[2]Whereas, the longer the
apneic episodes persist, the deeper is the hypoxia. Therefore, AHI does not fully reflect pathophysiologic characteristics of hypoxia.[3]
Cases with similar AHI values may have different clinical symptoms and sign.[4,5]
Chronic intermittent type is generally described as recurrent hypox-emic attacks followed by periodic reoxygenation.[6]
Nowadays, a globally accepted quantitative clinical test which can be used in the measurement of the severity of hypoxia does not exist.[1]
In recent years, due to a direct correlation between ST90
value, severity and duration of hypoxia, OSA has attracted gradually increasing attention in investigations performed on OSA.[7–9]
Bostanci et al. investigated the relationship between various polysomnographic parameters and ST90
and reported age, body mass index (BMI), male gender, AHI, mean oxygen saturation as independent variables affecting ST90.[1] They indicated that AHI and ST90 values
should be evaluated in combination as an appropriate approach to the determination of prognosis of the disease and selection of suitable treatment modality for the patient. 1 In this study, the ratio between total of sleep durations where oxygen saturations stayed below 90, and 95% and total duration of sleep was determined as CT90and CT95
val-ues, respectively. Since these values represent the ratio between the time passed at the hypoxic state and total dura-tion of sleep, they are considered to be a better indicator than ST90values.
The aim of the present study was to determine correla-tions between physical examination parameters, chronic metabolic diseases, smoking, mean platelet volume, cerebral magnetic resonance imaging (MRI), presence and number of hyperintense foci.
Materials and Methods
A total of 1154 patients who underwent polysomnography in our sleep laboratory between 2011 and 2014 were screened retrospectively. Among them, those who under-went ear, nose and throat examinations, cerebral MR, CBC and biochemical tests were included in the study.
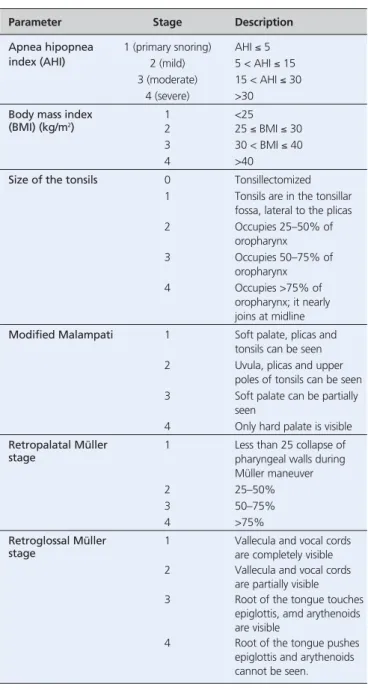
All patients underwent a detailed anamnesis together with (1) measurements of BMI, (2) circumferences of neck and abdomen, (3) examination of oropharynx, (4) Müller maneuver with the aid of fiberoptic endoscope, (5) estima-tion of Epworth sleep scale scores, (6) and polysomnograph-ic (PSG) tests. Hypertension, other cardiovascular diseases, diabetes, and smoking habits were questioned. Tonsil size was graded. The patients were requested to open their mouths with their tongues remaining in their mouths. Oral cavity was inspected, and the position of the palate and root of the tongue was evaluated and modified Malampati score was determined. All patients were subjected to Müller maneuvers while seated and degree of obstruction at the level of the soft palate and tongue root was assessed. For the assessment of an upper respiratory tract of a patient seated erect, a fiberoptic endoscope was inserted through nasal route complying with the Frankfurt line parallel to the ground. Fibroscope was advanced till epiglottis was visible. During Müller maneuver (forced inspiration with the closed mouth and nose) retropalatal and retroglossal regions were observed. Müller maneuvers were repeated three or more times in case of need till we were certain that the patient made a forceful inspiration. The degree of retropalatal and retroglossal collapse was staged (Table 1).
Patients with chronic renal, heart or liver failure, abnor-mal pulmonary functions or sleep disorders other than OSA and patients who experienced previously any surgical inter-vention or those using any respiratory device for their treat-ment were not included in the study.
All patients underwent all-night polysomnographic examination in the Sleep Laboratory of Chest Diseases, Alanya Hospital of Baflkent University using 44-channel Compumedics brand E series (Abbotsford, Australia) com-puterized system under the surveillance of an experienced technician. Polysomnographic examinations included (EEG), 2-channel electro-oculography (EOG), single-chan-nel submental muscle electromyography (EMG), 2-chansingle-chan-nel EMG whose electrodes were placed on both anterior tibial muscles, 1-channel nasal cannula for the measurement of oronasal airflow, 1-channel oronasal thermal sensor, 2-channel inductive plethysmography to display respiratory efforts of thorax, and abdomen, “body position” sensor to determine position of the body, pulse oximetry device with a single-channel finger probe to measure arterial oxyhemo-globin (SpO2) concentration and simultaneous video
recordings. Apnea was defined as cessation of respiration for ≥10 seconds. At least 50% drop in respiratory effort togeth-er with 4% drop in SaO2was considered as hypopnea. AHI
Statistical analysis
Data were analyzed using the IBM Statistical Package for Social Sciences v21 (SPSS Inc., Chicago, IL, USA). A nor-mal distribution of the quantitative data was checked using Shapiro-Wilk test. Parametric tests (independent-samples t-test and posthoc Tukey test) were applied to data of nor-mal distribution and non-parametric tests (Mann-Whiney U test and Kruskal-Wallis test) were applied to data of
questionably normal distribution. To calculate correlation coefficients, Spearman correlation was used. Data are expressed as mean±SD or median (interquartile range), as appropriate. Statistical significance was considered as p<0.05.
Results
General characteristics of the patients are seen in Table 2. The mean age of the patients was 47.6±12.2 (range: 23 to 75) years. The study population consisted of 64 (88.9%) male and 8 (11.1%) female patients. According to severity of OSA, the patients had simple snoring (22.2%), mild (19.4%) and severe OSA (38.9%).
Based on Spearman correlation analysis CT90was
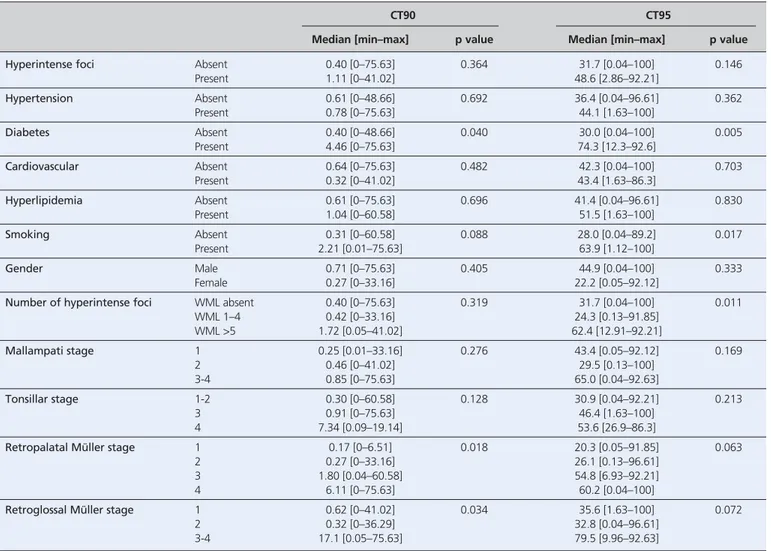
corre-lated with Epworth sleep score (r=0.29, p=0.013), AHI (r=0.713, p<0.001) and BMI (r=0.549, p<0.001). However, variables of diabetes mellitus (p=0.040), retropalatal Müller stage (p=0.018) and retroglossal Müller stage (p=0.034) affected CT90 (Table 3). However, in multivariate
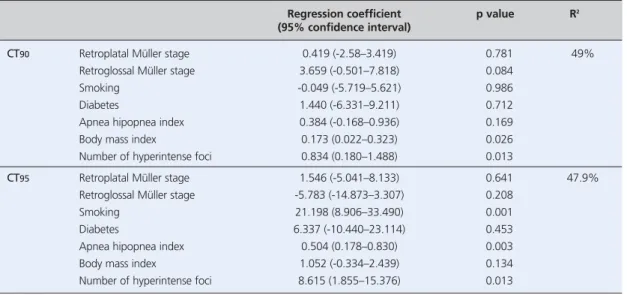
regres-sion analysis only BMI (p=0.026) and AHI (p=0.013) were
Parameter Stage Description
Apnea hipopnea 1 (primary snoring) AHI ≤ 5
index (AHI) 2 (mild) 5 < AHI ≤ 15
3 (moderate) 15 < AHI ≤ 30
4 (severe) >30
Body mass index 1 <25
(BMI) (kg/m2)
2 25 ≤ BMI ≤ 30
3 30 < BMI ≤ 40
4 >40
Size of the tonsils 0 Tonsillectomized
1 Tonsils are in the tonsillar fossa, lateral to the plicas
2 Occupies 25–50% of oropharynx 3 Occupies 50–75% of oropharynx 4 Occupies >75% of oropharynx; it nearly joins at midline
Modified Malampati 1 Soft palate, plicas and
tonsils can be seen
2 Uvula, plicas and upper
poles of tonsils can be seen
3 Soft palate can be partially
seen
4 Only hard palate is visible
Retropalatal Müller 1 Less than 25 collapse of
stage pharyngeal walls during
Müller maneuver
2 25–50%
3 50–75%
4 >75%
Retroglossal Müller 1 Vallecula and vocal cords
stage are completely visible
2 Vallecula and vocal cords
are partially visible
3 Root of the tongue touches
epiglottis, amd arythenoids are visible
4 Root of the tongue pushes
epiglottis and arythenoids cannot be seen.
Table 1. Staging system of polysomnographic and physical examination findings used in patients evaluated for OSA.
mean±SD min–max
CT90, % 7.16±14.68 0–75.6
CT95, % 44.6±31.57 0–100
Epworth sleep score 9.13±5.18 0–24
Hemoglobin (g/dL) 14.43±1.29 10.2–17.1
Mean platelet volume (fl) 7.86±1.51 5–15.3
Apnea hypopnea index 28.15±24.84 0–93
Body mass index (kg/m2) 31.12±5.33 21.9–48
Table 2. General characteristics of the patients (n=72).
n %
Hyperintense foci Absent 38 52.8
Present 34 47.2
Number of hyperintense Absent 34 47.2
foci 1–4 16 22.2 ≥5 22 30.6 Hypertension Absent 40 55.6 Present 32 44.4 Diabetes Absent 58 80.6 Present 14 19.4
Cardiovascular disease Absent 59 81.9
Present 13 18.1
Hyperlipidemia Absent 54 75.0
Present 18 25.0
Smoking Absent 46 63.9
seen as independent variables affecting CT90 (R2=49%)
(Table 4). Spearman correlation analysis revealed correla-tion between CT95 and AHI (r=0.604, p<0.001) and BMI
(r=0.473, p<0.001). However, variables of diabetes (p=0.005), smoking (p=0.017) and number of hyperintense foci (p=0.011) affected CT95(Table 3). Multivariate linear
regression analysis demonstrated that independent variables of only smoking (p=0.001), AHI (p=0.003) and number of hyperintense foci (p=0.013) affected CT95 (R2=47.9%),
while relationships between diabetes, BMI and CT95were
not statistically significant (Table 4). Discussion
The total duration of sleep where oxygen saturation remains below 90% and 95%, is an easily measurable
objective parameter. In this study a statistically significant correlation was not detected between retropalatal Müller stage, retroglossal Müller stage and CT95values, However,
correlations between retropalatal Müller stage and ret-roglossal Müller stage CT90values were seen (p=0.018 and
p=0.034, respectively).
Li and Jin reported a strong correlation between AHI and total duration of apnea (r=0.770 and 0.776, respective-ly).[7]
In our study, a strong correlation was found between CT90value and AHI; however, it was not so strong as ST90
value indicated in the study by Li and Jin. (r=0.0713). A moderate degree of correlation was found between CT95
and AHI (r=0.604). Besides, a correlation between Epworth sleep score and CT90 (r=0.290) was found,
whereas, a statistically significant correlation was not detected between CT95and EUS.
Table 3. Factors affecting CT90and CT95.
CT90 CT95
Median [min–max] p value Median [min–max] p value
Hyperintense foci Absent 0.40 [0–75.63] 0.364 31.7 [0.04–100] 0.146
Present 1.11 [0–41.02] 48.6 [2.86–92.21] Hypertension Absent 0.61 [0–48.66] 0.692 36.4 [0.04–96.61] 0.362 Present 0.78 [0–75.63] 44.1 [1.63–100] Diabetes Absent 0.40 [0–48.66] 0.040 30.0 [0.04–100] 0.005 Present 4.46 [0–75.63] 74.3 [12.3–92.6] Cardiovascular Absent 0.64 [0–75.63] 0.482 42.3 [0.04–100] 0.703 Present 0.32 [0–41.02] 43.4 [1.63–86.3] Hyperlipidemia Absent 0.61 [0–75.63] 0.696 41.4 [0.04–96.61] 0.830 Present 1.04 [0–60.58] 51.5 [1.63–100] Smoking Absent 0.31 [0–60.58] 0.088 28.0 [0.04–89.2] 0.017 Present 2.21 [0.01–75.63] 63.9 [1.12–100] Gender Male 0.71 [0–75.63] 0.405 44.9 [0.04–100] 0.333 Female 0.27 [0–33.16] 22.2 [0.05–92.12]
Number of hyperintense foci WML absent 0.40 [0–75.63] 0.319 31.7 [0.04–100] 0.011
WML 1–4 0.42 [0–33.16] 24.3 [0.13–91.85] WML >5 1.72 [0.05–41.02] 62.4 [12.91–92.21] Mallampati stage 1 0.25 [0.01–33.16] 0.276 43.4 [0.05–92.12] 0.169 2 0.46 [0–41.02] 29.5 [0.13–100] 3-4 0.85 [0–75.63] 65.0 [0.04–92.63] Tonsillar stage 1-2 0.30 [0–60.58] 0.128 30.9 [0.04–92.21] 0.213 3 0.91 [0–75.63] 46.4 [1.63–100] 4 7.34 [0.09–19.14] 53.6 [26.9–86.3]
Retropalatal Müller stage 1 0.17 [0–6.51] 0.018 20.3 [0.05–91.85] 0.063
2 0.27 [0–33.16] 26.1 [0.13–96.61]
3 1.80 [0.04–60.58] 54.8 [6.93–92.21]
4 6.11 [0–75.63] 60.2 [0.04–100]
Retroglossal Müller stage 1 0.62 [0–41.02] 0.034 35.6 [1.63–100] 0.072
2 0.32 [0–36.29] 32.8 [0.04–96.61]
Recent studies have demonstrated the close relation-ship between obesity and OSA, insulin resistance and metabolic syndrome.[10,11]
The studies performed more recently have detected that metabolic dysfunction devel-oped in OSA which is not only correlated with obesity but also related closely to the severity of OSA irrespective of the presence of obesity.[12,13]
Punjabi et al. demonstrated that the insulin resistance developed in patients with OSA increases in parallel with the increase in the severity of the disease and pointed out to the severity of oxygen desatura-tion as one of the important factors which increase the insulin resistance.[14,15]
In our study, CT90and CT95values
were found to be correlated with the presence of diabetes (p=0.040 and p=0.005, respectively).
In obstructive sleep apnea, hyperintense foci (= alter-ations in white matter) on cerebral periventricular and subcortical areas at T2-weighted and FLAIR (fluid atten-uated inversion recovery) sequences of magnetic reso-nance imaging in obstructive sleep apnea were found to be correlated with, dementia and mortality.[16–18]
They are related to cognitive function and their preventable and treatable causes should be revealed.[19,20]
Even though het-erogeneous pathological relations exist, the presence of gliosis related to focal myelinosis, axonal loss and hyali-nosis suggests a role of chronic hypoperfusion in the development of hyperintense foci.[21,22]
Obstructive sleep apnea is related to the development of hypertension and hypertension was correlated with the development of hyperintense foci.[16,23,24]
Therefore, the presence of a
cor-relation between OSA and the presence of hyperintense foci is reasonable.[25]
In this study, a correlation between CT90 value and the presence of hyperintense foci in the
brain could not be found. However, a correlation was found between CT95 value and number of hyperintense
foci in the brain (p=0.011).
Increased activation of platelets plays an important role in the development of cardiovascular complications.[26]
Some authors have indicated an increase in platelet activa-tion and aggregaactiva-tion.[27–30]Mean platelet volume is an
indi-cator of thrombocytic activation and plays a role in the pathophysiology of cardiovascular diseases as hyperten-sion, diabetes, hypercholesterolemia and acute myocardial infarction.[26,31]
In this study, a statistically significant corre-lation was not detected between mean platelet volume, CT90 and CT95 values. Besides, statistically significant
effect of smoking on CT95(p=0.017) was seen; however, it
did not affect CT90values.
Polysomnographic, brain MR and blood values obtained at different time points because of retrospective design of the study and a scarce number of cases are major limitations of our study. Besides among cases who had undergone polysomnographic examinations, selection of only those who had cerebral MR and biochemical values might create a bias towards the cases who had health prob-lems apart from OSA.
Based on the results of this study, correlations exist between CT90 value, AHI, BMI, Epworth sleep score,
Table 4. Factors affecting CT90and CT95(multivariate linear regression analysis).
Regression coefficient p value R2
(95% confidence interval)
CT90 Retroplatal Müller stage 0.419 (-2.58–3.419) 0.781 49%
Retroglossal Müller stage 3.659 (-0.501–7.818) 0.084
Smoking -0.049 (-5.719–5.621) 0.986
Diabetes 1.440 (-6.331–9.211) 0.712
Apnea hipopnea index 0.384 (-0.168–0.936) 0.169
Body mass index 0.173 (0.022–0.323) 0.026
Number of hyperintense foci 0.834 (0.180–1.488) 0.013
CT95 Retroplatal Müller stage 1.546 (-5.041–8.133) 0.641 47.9%
Retroglossal Müller stage -5.783 (-14.873–3.307) 0.208
Smoking 21.198 (8.906–33.490) 0.001
Diabetes 6.337 (-10.440–23.114) 0.453
Apnea hipopnea index 0.504 (0.178–0.830) 0.003
Body mass index 1.052 (-0.334–2.439) 0.134
retropalatal, retroglossal stage and presence of diabetes. On the other hand, CT95 value is correlated with AHI,
BMI, diabetes, smoking and number of hyperintense foci detected on brain MR. In multivariate linear regression analysis, CT90 value was correlated with only AHI and
BMI and CT95 value was correlated with AHI, smoking
and a number of hyperintense foci in the brain. Since CT95
values are affected by smoking without any statistically sig-nificant correlation with retropalatal and retroglossal Müller stages, we think that consideration of CT90value
will be more appropriate in the evaluation of the severity of chronic intermittent hypoxia in patients with obstruc-tive sleep apnea. However, the correlation between CT90
value and AHI is closer to the value indicated in the liter-ature, but not stronger.
Conflict of Interest: No conflicts declared.
References
1. Bostanci A, Turhan M, Bozkurt S. Factors influencing sleep time with oxygen saturation below 90% in sleep-disordered breath-ing. Laryngoscope 2015;125:1008–12.
2. Iber C, Ancoli-Israel S, Chesson A, Quan S. The AASM manu-al for the scoring of sleep and associated events: rules, terminol-ogy and technical specifications. Westchester, IL: American Academy of Sleep Medicine; 2007.
3. Kulkas A, Tiihonen P, Julkunen P, Mervaala E, Töyras J. Novel parameters indicate significant differences in severity of obstruc-tive sleep apnea with patients having similar apnea-hypopnea index. Med Biol Eng Comput 2013;51:697–708.
4. Mediano O, Barcelo A, de la Pena M, Gozal D, Agusti A, Barbe F. Daytime sleepiness and polysomnographic variables in sleep apnoea patients. Eur Respir J 2007;30:110–3.
5. Asano K, Takata Y, Usui Y, et al. New index for analysis of polysomnography, "integrated area of desaturation", is associat-ed with high cardiovascular risk in patients with mild to moder-ate obstructive sleep apnea. Respiration 2009;78-278–84. 6. Neubauer J. Invited review: physiological and
pathophysiologi-cal responses to intermittent hypoxia. J Appl Physiol 2001;90: 1593–9.
7. Li Q, Jin XJ. Correlations between the duration and frequency of sleep apnea episode and hypoxemia in patients with obstruc-tive sleep apnea syndrome. [Article in Chinese] Zhonghua Er Bi Yan Hou Tou Jing Wai Ke Za Zhi 2009;44:825–30.
8. Zhang XB, Zen HQ, Lin QC, Chen GP, Chen LD, Chen H. TST, as a polysomnographic variable, is superior to the apnea hypopnea index for evaluating intermittent hypoxia in severe obstructive sleep apnea. Eur Arch Otorhinolaryngol 2014;271: 2745–50.
9. Zhang J, Li Y, Cao X, et al. The combination of anatomy and physiology in predicting the outcomes of velopharyngeal sur-gery. Laryngoscope. 2014;124:1718–23.
10. Vgontzas AN, Papanicolaou DA, Bixler EO, et al. Sleep apnea and daytime sleepiness and fatigue: relation to visceral obesity,insulin resistance and hypercytokinemia. J Clin Endocrinol Metab 2000; 85:1151–8.
11. Alam I, Lewis K, Stephens JW, Baxter JN. Obesity, metabolic syndrome and sleep apnoea: all pro-inflammatory states. Obes Rev 2007;8:119–27.
12. Punjabi NM, Sorkin JD, Katzel LI, Goldberg AP, Schwartz AR, Smith PL. Sleep-disordered breathing and insulin resistance in middle-aged and overweight men. Am J Respir Crit Care Med 2002;165:677–82.
13. Theorell-Haglöw J, Berne C, Janson C, Lindberg E. Obstructive sleep apnoea is associated with decreased insulin sensitivity in females. Eur Respir J 2008;31:1054–60.
14. Punjabi NM, Beamer BA. Alterations in glucose disposal in sleep-disordered breathing. Am J Respir Crit Care Med 2009; 179:235–40.
15. Punjabi NM, Shahar E, Redline S, Gottlieb DJ, Givelber R, Resnick HE. Sleep-disordered breathing, glucose intolerance and insulin resistance: the Sleep Heart Health Study. Am J Epidemiol 2004;160:521–30.
16. Redline S, Yenokyan G, Gottlieb DJ, et al. Obstructive sleep apnea-hypopnea and incident stroke: the sleep heart health study. Am J Respir Crit Care Med 2010;182:269–77.
17. Yaffe K, Laffan AM, Harrison SL,et al. Sleep-disordered breath-ing, hypoxia and risk of mild cognitive impairment and demen-tia in older women. JAMA 2011;306:613–9.
18. Davies CW, Crosby JH, Mullins RL. et al. Case control study of cerebrovascular damage defined by magnetic resonance imaging in patients with OSA and normal matched control subjects. Sleep 2001;24:715–20.
19. Bracco L, Piccini C, Moretti M, et al. Alzheimer's disease: role of size and location of white matter changes in determining cog-nitive deficits. Dement Geriatr Cogn Disord 2005;20:358–66. 20. Xiong Y, Mok V, Wong A, et al. The age-related white matter
changes scale correlates with cognitive impairment. Eur J Neurol 2010;17:1451–6.
21. Fazekas F, Klemert R, Offenbacher H, et al. Pathologic corre-lates of incidental MRI white matter signal hyperintensities. Neurology 1993;43:1683–9.
22. Schmidt R, Grazer A, Enzinger C, et al. MRI-detected white mat-ter lesions: do they really matmat-ter? J Neural Transm 2011;118:673– 81.
23. Vermeer SE, Den Heijer T, Koudstaal PJ, Oudkerk M, Hofman A, Breteler MM. Incidence and risk factors of silent brain infarcts in the population-based Rotterdam Scan Study. Stroke 2003;34: 392–6.
24. Gottesman RF, Coresh J, Catellier DJ, et al. Blood pressure and white-matter disease progression in a biethnic cohort. Atherosclerosis Risk in Communities (ARIC) study. Stroke 2010;41:3–8.
25. Kim H, Yun CH, Thomas RJ, et al. Obstructive sleep apnea as a risk factor for cerebral white matter change in a middle-aged and older general population. Sleep 2013;36:709–15B.
26. Karakafl MS, Altekin RE, Bakt›r AO, Küçük M, Cilli A, Yalç›nkaya S. Association between mean platelet volume and severity of dis-ease in patients with obstructive sleep apnea syndrome without risk
factors for cardiovascular disease. Turk Kardiyol Dern Ars 2013; 41:14–20.
27. Geiser T, Buck F, Meyer BJ, Bassetti C, Haeberli A, Gugger M. In vivo platelet activation is increased during sleep in patients with obstructive sleep apnea syndrome. Respiration 2002;69: 229–34.
28. Hui DS, Ko FW, Fok JP, et al. The effects of nasal continuous positive airway pressure on platelet activation in obstructive sleep apnea syndrome. Chest 2004;125:1768–75.
29. Minoguchi K, Yokoe T, Tazaki T, et al. Silent brain infarction and platelet activation in obstructive sleep apnea. Am J Respir Crit Care Med 2007;175:612–7.
30. Varol E, Ozturk O, Gonca T, et al. Mean platelet volume is increased in patients with severe obstructive sleep apnea. Scand J Clin Lab Invest 2010;70:497–502.
31. Vizioli L, Muscari S, Muscari A. The relationship of mean platelet volume with the risk and prognosis of cardiovascular diseases. Int J Clin Pract 2009;63:1509–15.
This is an open access article distributed under the terms of the Creative Commons Attribution-NonCommercial-NoDerivs 3.0 Unported (CC BY-NC-ND3.0) Licence (http://creativecommons.org/licenses/by-nc-nd/3.0/) which permits unrestricted noncommercial use, distribution, and reproduc-tion in any medium, provided the original work is properly cited.
Please cite this article as: Avc› S, Y›lmaz Avc› A, Ya¤basan BD, Günizi H. The relationship between clinical and laboratory findings and duration of sleep