http://journals.tubitak.gov.tr/medical/ © TÜBİTAK
doi:10.3906/sag-1412-86
Determination of virulence and multidrug resistance genes with polymerase chain
reaction method in vancomycin-sensitive and -resistant enterococci isolated from
clinical samples*
Şükran SABA ÇOPUR1, Fikret ŞAHİN2, Jülide Sedef GÖÇMEN1,**
1Department of Medical Microbiology, Faculty of Medicine, Başkent University, Ankara, Turkey 2Department of Medical Microbiology, Faculty of Medicine, Ankara University, Ankara, Turkey
1. Introduction
Enterococci are the natural members of the gastrointestinal tract, mouth, urethra, and vaginal flora and may result in serious nosocomial infections despite their low virulence characteristics. Enterococci are often isolated particularly from patients in intensive care units with suppressed immune systems, hematological malignancies, catheter and prosthesis existence, prolonged hospitalization duration, and usage of broad-spectrum antibiotics (1).
The first vancomycin-resistant Enterococcus strain in the world was reported by Uttley et al. (2) in the UK in 1988. In Turkey, the first vancomycin-resistant Enterococcus strain was reported in a pediatric patient by Vural et al. (3) from Akdeniz University in 1998.
Resistance to vancomycin develops with the vanA and vanB genes coded by plasmids and vanC, vanD, and vanG coded by chromosomes. The most common multidrug
resistance (MDR)1 genes among them are vanA and vanB. It is important for the pathogenesis of illnesses to know if enterococci have certain virulence genes other than resistance to antibiotics.
Attachment to epithelial tissue, formation of biofilm, the spread of bacteria over connective tissue, the breakdown of collagen, and hemolysis occur through proteins coded from esp, hyl, gelE, asa1, and cyl gene areas (4,5).
Enterococci, ranking first among causes of nosocomial infections, have epidemiologically become more important with the presence of both resistance and virulence factors. Studies are limited that investigate the presence of enterococci with these two characteristics together in nosocomial infections.
Our objective was to investigate both resistance and virulence gene areas in patient isolates with vancomycin-resistant enterococci and vancomycin-sensitive enterococci Background/aim: Enterococci play an important role in nosocomial infections. Therefore, this study investigates multidrug resistance
(MDR)1 gene areas in the pathogenicity of enterococci and virulence genes in both vancomycin-sensitive enterococci (VSE) and vancomycin-resistant enterococci (VRE) strains.
Materials and methods: Virulence genes and MDR genes of enterococci were investigated by polymerase chain reaction (PCR). Results: We evaluated a total of 116 isolates, 93 being VRE and 23 being VSE. In this study, 95.6% of VRE (n = 93) were Enterococcus faecium (n = 89) and 4.3% were E. faecalis (n = 4), while 17.4% of VSE (n = 23) were E. faecium (n = 4) and 82.6% were E. faecalis (n = 19). The vanA MDR1 gene was detected in all VRE isolates. Among virulence genes, esp and hyl were detected in E. faecium, an enterococcus with the highest resistance to vancomycin, and gelE was detected in E. faecalis, an enterococcus with the highest sensitivity to vancomycin. Three or more virulence genes were identified only in VSE strains. We consider that it is a significant result that VSE had more virulence genes than VRE. Only esp was seen in VRE E. faecium strains.
Conclusion: This study includes experimental results on the association of virulence characteristics in VRE and VSE strains. Key words: Enterococcus faecium, Enterococcus faecalis, vancomycin multidrug resistance genes, virulence genes
Received: 17.12.2014 Accepted/Published Online: 27.07.2015 Final Version: 19.04.2016 Research Article
* This article was presented as a verbal communication (No. SS014) at the 5th Congress of Infectious Diseases and Clinical Microbiology Specialty Society of Turkey, held between 21 and 25 May 2014 in Belek, Turkey.
(VRE and VSE, respectively). We think that the obtained data will be epidemiologically useful in understanding the pathogenesis of enterococci.
2. Materials and methods
A total of 116 Enterococcus strains isolated from patients in various clinics of the Ankara and Adana hospitals of the Başkent University Faculty of Medicine were included in the study. If more than one sample was available from the same patient, only one sample was included in the study.
2.1. Identification of bacteria
Strains were kept in glycerol bouillon at –86 °C and then transferred for culture to 5% sheep blood agar media (Becton Dickinson, USA) and incubated at 37 °C for 24 h. In gram-positive coccus morphology, catalase-negative strains were applied for the PYR test with the BBL DrySlide PYR kit (Becton Dickinson). Isolates were also cultured in esculin medium and 6.5% NaCl medium. Strains with positive PYR test results, producing black colonies in the esculin medium and growing in 6.5% NaCl, were identified to be Enterococcus spp., and the species were further identified by Rapid ID 32 Strep kits (BioMérieux, France). Identifications of species were verified by the MALDI-TOF system (BioMérieux).
2.2. Determination of sensitivity of bacteria to antibiotics 2.2.1. Determination of sensitivity to vancomycin 2.2.1.1. Kirby–Bauer disk diffusion method
Sensitivity to vancomycin was assessed using 30-µg vancomycin disks in Mueller Hinton agar (Becton Dickinson) medium in accordance with recommendations of the Clinical and Laboratory Standards Institute (6).
2.2.1.2. Determination of minimal inhibitor concentration (MIC) with broth microdilution method
Vancomycin resistance/sensitivity was verified by the broth microdilution method. For determination of MICs, the broth microdilution method, Mueller Hinton II broth medium (Becton Dickinson), and standard powder of vancomycin (Sigma, Germany) were used (6). All tests were repeated twice. E. faecalis ATCC 29212 and S. aureus ATCC 29213 were used as quality control strains for each
study. For all VRE strains, vancomycin MIC values were ≥128 µg/mL.
2.2.2. Determination of sensitivity to teicoplanin
The MIC value of teicoplanin was determined by gradient diffusion method. E-test strips (BioMérieux) were used for MIC determination. E. faecalis ATCC 29212 was used as a quality control strain. For all VRE, teicoplanin MIC values were ≥256 µg/mL.
2.3. Investigation of multidrug resistance and virulence genes with polymerase chain reaction (PCR)
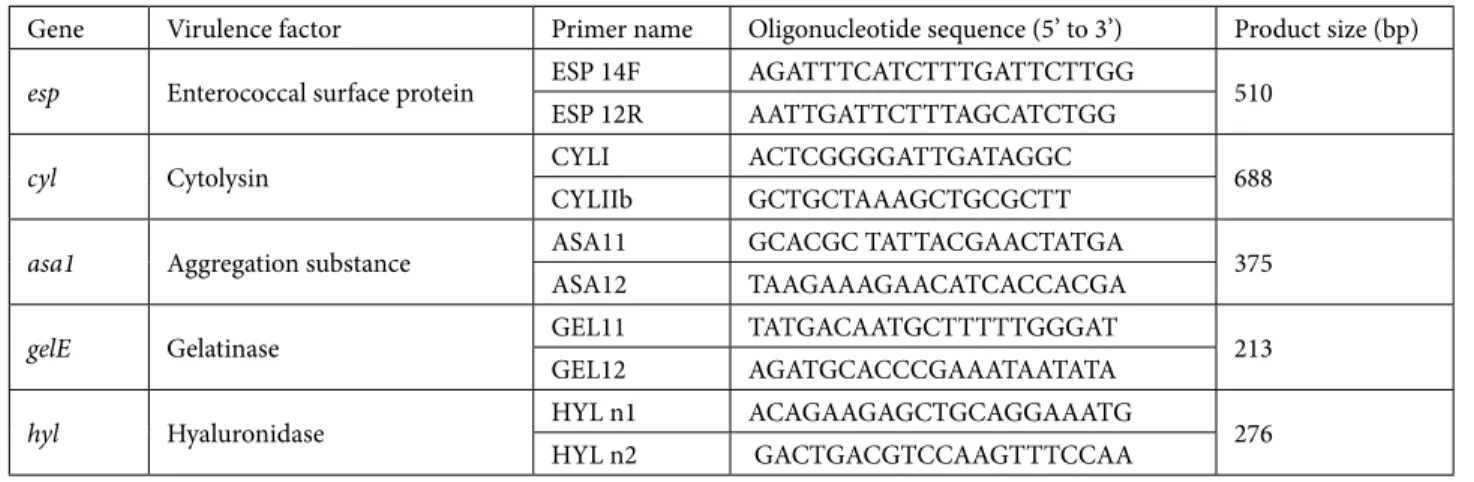
DNAs of strains were extracted via gram-positive bacteria DNA extraction kit (Genoks, Turkey) and kept at –20 °C until DNAs were amplified. Primers described by Dutka-Malen et al. (7) were used to investigate MDR genes (Table 1). In investigation of MDR genes, E. faecalis ATCC 51559 was used as a vanA-positive control strain, E. faecalis ATCC 51299 was used as a vanB-positive control strain, and E. faecalis ATCC 29212 was used as a negative control strain. Primers described by Vankerckhoven et al. (8) were used for investigation of virulence genes (Table 2). In investigation of virulence genes, E. faecalis MMH594 (for esp, cyl, asa1, and gelE) and E. faecium C68 (for hyl) were used as positive control strains.
vanA and vanB, esp and cyl, and asa1 and gelE were investigated as pairs by multiplex PCR. In the thermal cycle (Biometra, Germany), the following phases were carried out: at 94 °C for 2 min; then at 94 °C for 45 s, 58 °C for 45 s, and 72 °C for 45 s for 35 cycles; and a final cycle at 72 °C for 10 min.
Next, 10 µL of each amplification product was mixed with the loading dye and loaded in the tank. A 50-bp DNA ladder (O’RangeRuler, Fermentas, Lithuania) was used as a molecular standard marker. Electrophoresis was carried out at 120 V for 30 min. Bands were imaged with a UV transilluminator (TFX 20M, Vilber Lourmat, France).
2.4. Statistical analysis
Data were analyzed by Pearson chi-square test, likelihood ratio test, Fisher exact test, and z test depending on the frequency of tables and the number of cells in tables. P < 0.05 was considered to be statistically significant. SPSS 17.0 was used for data analyses (SPSS Inc., Chicago IL, USA). Table 1. Multidrug resistance gene primer sequences (7).
Gene Primer name Oligonucleotide sequence (5’ to 3’) Product size (bp)
vanA A1 5’ GGGAAAACGACAATTGC 3’ 732
A2 5’ GTACAATGCGGCCGTTA 3’
vanB B1 5’ATGGGAAGCCGATAGTC3’ 635
3. Results
3.1. Bacterial identification and sensitivity results
Of 116 isolates, 93 (80.2%) were identified to be VRE and 23 (19.8%) were identified to be VSE. Of the VRE (n = 93), 95.7% (n = 89) were identified as E. faecium and 4.3% (n = 4) were identified as E. faecalis. The most common
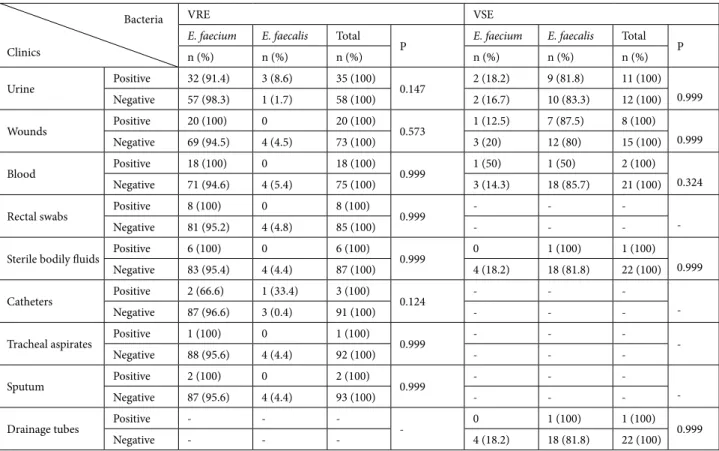
species isolated in this study was E. faecium. Distribution of species by clinics for VRE and distribution of species by clinical samples for VRE and VSE are presented in Tables 3 and 4, respectively. Among VSE (n = 23), the most commonly isolated species was E. faecalis at 82.6% (n = 19), followed by E. faecium at 17.4% (n = 4).
Table 2. Virulence genes and factors (8).
Gene Virulence factor Primer name Oligonucleotide sequence (5’ to 3’) Product size (bp)
esp Enterococcal surface protein ESP 14F AGATTTCATCTTTGATTCTTGG 510
ESP 12R AATTGATTCTTTAGCATCTGG
cyl Cytolysin CYLI ACTCGGGGATTGATAGGC 688
CYLIIb GCTGCTAAAGCTGCGCTT
asa1 Aggregation substance ASA11 GCACGC TATTACGAACTATGA 375
ASA12 TAAGAAAGAACATCACCACGA
gelE Gelatinase GEL11 TATGACAATGCTTTTTGGGAT 213
GEL12 AGATGCACCCGAAATAATATA
hyl Hyaluronidase HYL n1 ACAGAAGAGCTGCAGGAAATG 276
HYL n2 GACTGACGTCCAAGTTTCCAA
Table 3. Distribution of species by clinics for VRE and VSE.
Bacteria Clinics
VRE VSE
E. faecium E. faecalis Total
P E. faecium E. faecalis Total P
n (%) n (%) n (%) n (%) n (%) n (%)
Surgery clinics* Positive 20 (95.2) 1 (4.8) 21 (100) 0.201 0 2 (100) 2 (100) 0.999 Negative 69 (95.8) 3 (4.2) 72 (100) 4 (19) 17 (81) 21 (100) Surgery polyclinics** Positive - - -- 2 (20) 8 (80) 10 (100) 0.999 Negative - - - 2 (15.4) 11 (84.6) 13 (100) Internal polyclinics# Positive - - -- 0 5 (100) 5 (100) 0.539 Negative - - - 4 (22.3) 14 (77.7) 18 (100)
Intensive care units Positive 18 (90) 2 (10) 20 (100) 0.999 0 3 (100) 3 (100) 0.999 Negative 71 (97.3) 2 (2.7) 73 (100) 4 (20) 16 (80) 20 (100) Other clinics ## Positive 16 (100) 0 16 (100) 0.999 - - -
-Negative 73 (94.8) 4 (5.2) 77 (100) - -
-Pediatrics Positive 13 (100) 0 13 (100) 0.999 1 (50) 1 (50) 2 (100) 0.324 Negative 76 (95) 4 (5) 80 (100) 1 (100) 0 1 (100) Nephrology Positive 10 (90.9) 1 (9.1) 11 (100) 0.401 - - -
-Negative 79 (96.3) 3 (3.7) 82 (100) - -
-Burn units Positive 7 (100) 0 7 (100) 0.999 - - -
-Negative 82 (95.3) 4 (4.7) 86 (100) - -
-Hematology Positive 5 (100) 0 5 (100) 0.999 1 (100) 0 1 (100) 0.174 Negative 84 (95.5) 4 (4.5) 88 (100) 3 (13.7) 19 (86.3) 22 (100) *General surgery, orthopedics.
**Urology, general surgery, orthopedics, obstetrics.
#Pediatrics, rheumatology, dermatology, endocrinology, infectious diseases.
3.2. Results of molecular analyses
vanA and vanB were initially investigated in all strains by PCR. vanA was detected in all 93 VRE strains (Figure 1). PCR images of virulence genes are shown in Figures 2–6.
The most common virulence factor was esp with a rate of 78.4% (n = 91) among all enterococci (n = 116). esp
was positive in 75 strains (80.6%) out of 93 VRE strains. It was followed by hyl (15.1%, n = 14) and gelE (3.2%, n = 3) in VRE strains (n = 93), respectively. Multiple virulence factors were found in VRE (n = 93) strains: esp+hyl (12.4%) and esp+gelE (2.2%). Three virulence factors were not found together in any VRE strains. Asa1 and cyl Table 4. Distribution of species by clinical samples for VRE and VSE.
Bacteria Clinics
VRE VSE
E. faecium E. faecalis Total
P E. faecium E. faecalis Total P
n (%) n (%) n (%) n (%) n (%) n (%) Urine Positive 32 (91.4) 3 (8.6) 35 (100) 0.147 2 (18.2) 9 (81.8) 11 (100) 0.999 Negative 57 (98.3) 1 (1.7) 58 (100) 2 (16.7) 10 (83.3) 12 (100) Wounds Positive 20 (100) 0 20 (100) 0.573 1 (12.5) 7 (87.5) 8 (100) 0.999 Negative 69 (94.5) 4 (4.5) 73 (100) 3 (20) 12 (80) 15 (100) Blood Positive 18 (100) 0 18 (100) 0.999 1 (50) 1 (50) 2 (100) 0.324 Negative 71 (94.6) 4 (5.4) 75 (100) 3 (14.3) 18 (85.7) 21 (100) Rectal swabs Positive 8 (100) 0 8 (100) 0.999 - - -
-Negative 81 (95.2) 4 (4.8) 85 (100) - -
-Sterile bodily fluids Positive 6 (100) 0 6 (100) 0.999 0 1 (100) 1 (100) 0.999 Negative 83 (95.4) 4 (4.4) 87 (100) 4 (18.2) 18 (81.8) 22 (100) Catheters Positive 2 (66.6) 1 (33.4) 3 (100) 0.124 - - -
-Negative 87 (96.6) 3 (0.4) 91 (100) - -
-Tracheal aspirates Positive 1 (100) 0 1 (100) 0.999 - - - -Negative 88 (95.6) 4 (4.4) 92 (100) - -
-Sputum Positive 2 (100) 0 2 (100) 0.999 - - -
-Negative 87 (95.6) 4 (4.4) 93 (100) - -
-Drainage tubes Positive - - - - 0 1 (100) 1 (100) 0.999
Negative - - - 4 (18.2) 18 (81.8) 22 (100)
Figure 1. PCR image of 16 strains with vanA genotype: the first
line (M) is the marker, line 1 is E. faecalis ATCC 51559 (732 bp) as a vanA-positive control strain, line 2 is E. faecalis ATCC 51299 (635 bp) as a vanB-positive control strain, line 3 is the negative control, and lines 4–20 are amplification products in specific 732 bp for the vanA gene in DNAs of strains.
Figure 2. PCR image of VRE esp and cyl VRE: the first line (M)
is the marker, line 1 is MMH594 as a positive control (esp and cyl), line 2 is the negative control, and lines 3, 4, 5, and 6 are am-plification products in specific 510 bp for the esp gene in DNAs of strains.
were not identified in any VRE strains. The rates of esp, hyl, and gelE were 79.8%/100%, 15.7%/0%, and 2.2%/25%, respectively, in VRE E. faecium (VREfm)/VRE E. faecalis (VREfs) (Table 5).
At least one virulence factor was found in all VSE strains. Of a total of 23 VSE strains, esp was identified in 16 (69.6%), asa1 was identified in 13 (56.5%), gelE was identified in 12 (52.2%), cyl was identified in 8 (34.8%), and hyl was identified in 1 (4.3%). Two virulence factors were found together in 6 (26.1%) VSE (n = 23) strains, and the most common association (n = 4) was esp and gelE. Three or more virulence factors were found in a total of 9 (39.13%) samples of isolated VSE (n = 23) strains (Table 5).
The esp rate in the VRE clinical samples obtained from pediatrics patients was statistically significantly higher (P < 0.01). The esp rates in isolates obtained from other clinics (neurology, internal medicine, cardiology, geriatrics, physical therapy and rehabilitation, gastroenterology, and
chest disease services) were statistically significant (P < 0.05) (Table 6).
The rates of esp+hyl and esp+gelE were higher in samples obtained from other clinics (neurology, internal medicine, cardiology, geriatrics, physical therapy and rehabilitation, gastroenterology, and chest disease service), intensive care units, and surgery clinics (urology, general surgery, orthopedics, and obstetrics). Hyl was the highest in pediatrics and intensive care units. The rates of hyl and hyl+esp were significantly highest in sputum samples (P < 0.05) among all VRE strains obtained from clinical samples (Table 7).
The dominant species was E. faecium (89/93) with a rate of 95.7% in VRE isolates, whereas it was E. faecalis with a rate of 82.6% (19/23) in VSE species. esp was found in VSE and VRE strains of both species but was more common in VRE isolates. However, this higher rate was not statistically significant. VREfm had the highest hyl rate Figure 3. PCR image of VRE asa1 and gelE: the first line (M) is
the marker, line 1 is MMH594 as a positive control (asa1 and gelE), line 2 is the negative control, and lines 3, 4, and 6 are ampli-fication products in specific 213 bp for the gelE gene in DNAs of strains. Line 5 is the product without asa1 or gelE genes.
Figure 5. PCR image of VSE esp and cyl: the first line (M) is the
marker, line 1 is MMH594 as a positive control (esp and cyl), and line 2 is the negative control. Lines 6, 7, 8, 12, 13, 14, 15, 18, 19, 20, and 21 are amplification products in specific 510 bp for the esp gene in DNAs of strains. Lines 7, 8, 16, 18, and 21 are ampli-fication products in specific 688 bp for the cyl gene in DNAs of strains.
Figure 4. PCR image of the VRE hyl virulence gene: the first line
(M) is the marker, line 1 is E. faecium C68 (hyl positive control), line 2 is the negative control, and all other lines are amplification products in specific 276 bp for the hyl gene in DNAs of strains.
Figure 6. PCR image of VSE asa1 and gelE: the first line (M) is
the marker, line 1 is MMH594 as a positive control (asa1 and gelE), and line 2 is the negative control. Lines 4, 13, 14,15, and 16 are amplification products in specific 213 bp for the gelE gene in DNAs of strains. Lines 3, 4, 7, 11, 13, 14, and 16 are amplification products in specific 375 bp for the asa1 gene in DNAs of strains.
Table 5. Distribution of virulence genes by VRE and VSE.
Resistant Sensitive
E. faecium
(n = 89) E. faecalis(n = 4) P E. faecium(n = 4) E. faecalis(n = 19) P
n (%) n (%) n (%) n (%) Total esp (78.4%, n = 91) 71 (79.8) 4 (100) 0.999 3 (75.0) 13 (68.4) 0.999 Total hyl (12.9%, n = 15) 14 (15.7) 0 (0) 0.999 0 (0) 1 (5.3) 0.999 Total gelE (12.9%, n = 15) 2 (2.2) 1 (25) 0.125 1 (25) 11 (57.9) 0.317 Total asa1 (11.2%, n = 13) 0 (0) 0 (0) - 2 (50) 11 (57.9) 0.999 Total cyl (6.9%, n = 8) 0 (0) 0 (0) - 2 (50) 6 (31.6) 0.589 esp alone (67.7%, n = 63) 61 (68.5) 0 (0) 0.999 1 (25) 1 (5.2) 0.324 hyl alone (3.2%, n = 3) 3 (3.3) 0 (0) 0.999 0 (0) 0 (0) -gelE alone (1%, n = 1) 0 (0) 0 (0) - 0 (0) 1 (5.2) 0.999 asa1 alone (2.1%, n = 2) 0 (0) 0 (0) - 0 (0) 2 (10.5) 0.999 cyl alone (n = 0) 0 (0) 0 (0) - 0 (0) 0 (0) -esp+hyl (n = 12) 11 (12.4) 0 (0) 0.999 0 (0) 1 (5.3) 0.999 esp+gelE (n = 15) 11 (12.4) 0 (0) 0.125 0 (0) 4 (21.1) 0.999 asa1+gelE (n = 1) 0 (0) 0 (0) - 0 (0) 1 (5.3) 0.999 asa1+gelE+cyl (n = 2) 0 (0) 0 (0) - 1 (25) 1 (5.3) 0.324 esp+cyl+asa1 (n = 3) 0 (0) 0 (0) - 1 (25) 2 (10.5) 0.453 asa1+gelE+esp (n = 2) 0 (0) 0 (0) - 0 (0) 2 (10.5) 0.999 asa1+gelE+cyl+esp (n = 2) 0 (0) 0 (0) - 0 (0) 2 (10.5) 0.999
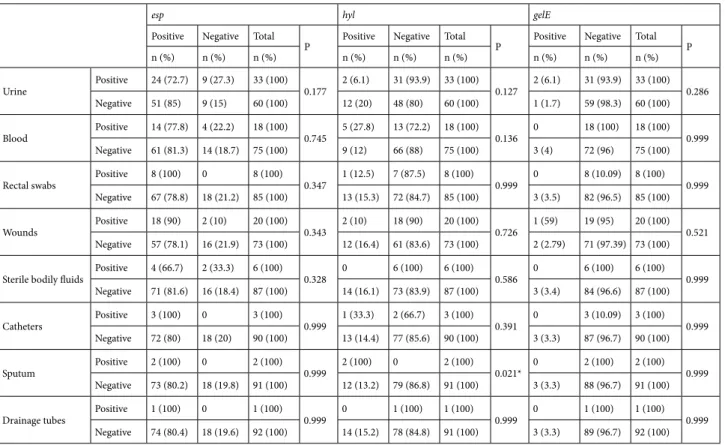
Table 6. According to clinics, virulence genes in isolated distribution of VRE.
esp hyl gelE
Positive Negative Total
P Positive Negative Total P Positive Negative Total P n (%) n (%) n (%) n (%) n (%) n (%) n (%) n (%) n (%)
Intensive care unit Positive 14 (70) 6 (30) 20 (100) 0.205 4 (20) 16 (80) 20 (100) 0.491 1 (5) 19 (95) 20 (100) 0.521 Negative 61 (83.6) 12 (16.4) 73 (100) 10 (13.7) 63 (86.3) 73 (100) 2 (2.7) 71 (97.3) 73 (100) Surgery clinics*** Positive 19 (90.5) 2 (9.5) 21 (100) 0.345 3 (14.3) 18 (85.7) 21 (100) 0.999 2 (9.5) 19 (90.5) 21 (100) 0.127
Negative 56 (77.8) 16 (22.2) 72 (100) 11 (15.5) 61 (84.7) 77 (100) 1 (1.4) 71 (98.6) 72 (100) Burn units Positive 6 (85.7) 1 (14.3) 7 (100) 0.999 11 (14.3) 6 (85.7) 17 (100) 0.999 0 7 (100) 7 (100) 0.999
Negative 69 (80.2) 17 (19.8) 86 (100) 13 (15.1) 73 (84.9) 86 (100) 3 (3.5) 83 (96.5) 86 (100) Nephrology Positive 9 (81.8) 2 (18.2) 11 (100) 0.999 1 (9.1) 10 (90.9) 11 (100) 0.999 0 11 (100) 11 (100) 0.999 Negative 66 (80.5) 16 (19.5) 82 (100) 13 (15.9) 69 (84.1) 82 (100) 3 (3.7) 79 (96.3) 82 (100) Hematology Positive 5 (100) 0 5 (100) 0.579 0 5 (100) 5 (100) 0.999 0 5 (100) 5 (100) 0.999 Negative 70 (79.5) 18 (20.5) 88 (100) 14 (15.9) 74 (81.1) 88 (100) 3 (3.4) 85 (94.4) 88 (100) Pediatrics Positive 6 (46.2) 7 (53.8) 13 (100) 0.003** 3 (23.1) 10 (76.9) 13 (100) 0.407 0 13 (100) 13 (100) 0.999 Negative 69 (86.3) 11 (13.8) 80 (100) 11 (13.8) 69 (86.3) 80 (100) 3 (3.8) 77 (96.3) 80 (100) Other clinics*** Positive 16 (100) 0 16 (100) 0.035* 2 (12.5) 14 (87.5) 16 (100) 0.999 0 16 (100) 16 (100) 0.999
Negative 59 (76.6) 18 (23.4) 77 (100) 12 (15.6) 65 (84.4) 77 (100) 3 (3.9) 74 (96.1) 77 (100) *P < 0.05; **P < 0.01.
***Orthopedics, general surgery.
Table 6. (Continued).
esp+hyl esp+gelE
Positive Negative Total
P Positive Negative Total P
n (%) n (%) n (%) n (%) n (%) n (%)
Intensive care unit Positive 4 (20) 16 (80) 20 (100) 0.242 1 (5) 19 (95) 20 (100) 0.521 Negative 7 (9.6) 66 (90.4) 73 (100) 2 (2.7) 71 (97.3) 73 (100)
Surgery clinics*** Positive 3 (14.3) 18 (85.7) 21 (100) 0.707 2 (9.5) 19 (90.5) 21 (100) 0.127 Negative 8 (11.1) 64 (88.99 72 (100) 1 (1.4) 71 (98.6) 72 (100)
Burn units Positive 1 (14.3) 6 (85.7) 7 (100) 0.999 0 7 (100) 7 (100) 0.999 Negative 10 (11.6) 76 (88.4) 86 (100) 3 (3.5) 83 (96.5) 86 (100) Nephrology Positive 0 11 (100) 11 (100) 0.350 0 11 (100) 11 (100) 0.999 Negative 11 (13.4) 71 (86.6) 82 (100) 3 (3.7) 79 (96.3) 82 (100) Hematology Positive 0 5 (100) 5 (100) 0.999 0 5 (100) 5 (100) 0.999 Negative 11 (12.5) 77 (87.5) 88 (100) 3 (3.4) 85 (96.6) 88 (100) Pediatrics Positive 1 (7.7) 12 (92.3) 13 (100) 0.999 0 13 (100) 13 (100) 0.999 Negative 10 (12.5) 70 (87.5) 80 (100) 3 (3.8) 77 (96.3) 80 (100)
Other clinics**** Positive 2 (12.5) 14 (87.7) 16 (100) 0.999 0 16 (100) 16 (100) 0.999 Negative 98 (11.7) 68 (88.3) 77 (100) 3 (3.9) 74 (96.1) 77 (100)
Table 7. The distribution of virulence genes in VRE isolated from clinical samples.
esp hyl gelE
Positive Negative Total
P Positive Negative Total P Positive Negative Total P n (%) n (%) n (%) n (%) n (%) n (%) n (%) n (%) n (%)
Urine Positive 24 (72.7) 9 (27.3) 33 (100) 0.177 2 (6.1) 31 (93.9) 33 (100) 0.127 2 (6.1) 31 (93.9) 33 (100) 0.286 Negative 51 (85) 9 (15) 60 (100) 12 (20) 48 (80) 60 (100) 1 (1.7) 59 (98.3) 60 (100) Blood Positive 14 (77.8) 4 (22.2) 18 (100) 0.745 5 (27.8) 13 (72.2) 18 (100) 0.136 0 18 (100) 18 (100) 0.999
Negative 61 (81.3) 14 (18.7) 75 (100) 9 (12) 66 (88) 75 (100) 3 (4) 72 (96) 75 (100) Rectal swabs Positive 8 (100) 0 8 (100) 0.347 1 (12.5) 7 (87.5) 8 (100) 0.999 0 8 (10.09) 8 (100) 0.999
Negative 67 (78.8) 18 (21.2) 85 (100) 13 (15.3) 72 (84.7) 85 (100) 3 (3.5) 82 (96.5) 85 (100) Wounds Positive 18 (90) 2 (10) 20 (100) 0.343 2 (10) 18 (90) 20 (100) 0.726 1 (59) 19 (95) 20 (100) 0.521
Negative 57 (78.1) 16 (21.9) 73 (100) 12 (16.4) 61 (83.6) 73 (100) 2 (2.79) 71 (97.39) 73 (100) Sterile bodily fluids Positive 4 (66.7) 2 (33.3) 6 (100) 0.328 0 6 (100) 6 (100) 0.586 0 6 (100) 6 (100) 0.999
Negative 71 (81.6) 16 (18.4) 87 (100) 14 (16.1) 73 (83.9) 87 (100) 3 (3.4) 84 (96.6) 87 (100) Catheters Positive 3 (100) 0 3 (100) 0.999 1 (33.3) 2 (66.7) 3 (100) 0.391 0 3 (10.09) 3 (100) 0.999
Negative 72 (80) 18 (20) 90 (100) 13 (14.4) 77 (85.6) 90 (100) 3 (3.3) 87 (96.7) 90 (100) Sputum Positive 2 (100) 0 2 (100) 0.999 2 (100) 0 2 (100) 0.021* 0 2 (100) 2 (100) 0.999
Negative 73 (80.2) 18 (19.8) 91 (100) 12 (13.2) 79 (86.8) 91 (100) 3 (3.3) 88 (96.7) 91 (100) Drainage tubes Positive 1 (100) 0 1 (100) 0.999 0 1 (100) 1 (100) 0.999 0 1 (100) 1 (100) 0.999
Negative 74 (80.4) 18 (19.6) 92 (100) 14 (15.2) 78 (84.8) 91 (100) 3 (3.3) 89 (96.7) 92 (100) *P < 0.05.
of 15.7%. With a rate of 57.9%, gelE was the highest in the VSEfs strains. Asa1 and cyl were not found in VRE strains but were detected in VSEfs strains in particular among VSE strains. The distributions of virulence genes in VRE and VSE according to species are presented in Table 5.
4. Discussion
Enterococci have become important as isolation rates have recently increased in community-acquired and nosocomial infections and they have developed resistance to many antibiotics, including glycopeptides. Enterococci are very common in the world and play important roles in nosocomial infections, as the second most common nosocomial pathogens after S. aureus in the United States (9).
According to data from the National Nosocomial Infections Surveillance System, the number of hospitals with VRE isolated is increasingly growing in Turkey. This rate was 5.4%, 6.1%, 11.2%, and 17.7% respectively for 2008, 2009, 2010, and 2012 (10,11).
Risk factors for VRE include malignancy, neutropenia, intraabdominal surgery, prolonged hospitalization duration, transplantation, staying in hematology-oncology and intensive care units, antineoplastic therapy, and use of vancomycin and 2nd and 3rd generation cephalosporin.
In a study from Turkey, Aygün et al. (12) reported that out of 467 rectal swab samples the VRE rate was 1.9% (n
= 9). Aral et al. (13) reported that 158 Enterococcus strains were isolated from inpatients at various clinics, particularly 34% from pediatrics, 27% from surgery, and 20% from intensive care units in 4 years (13). Of VRE strains in our study, 22.6% were isolated from samples of surgery clinics, 21.5% were isolated from samples of intensive care units, and 17.2% were isolated from samples of other clinics.
Aral et al. (13) sorted 158 Enterococcus strains according to clinical samples in 4 years and reported that the urine samples (58%) took first place, which was followed by blood (16%) and wound (17%) samples. A Greek study (14) indicated that 37.2% of identified VRE samples were isolated from urine samples, followed by 21.5% from blood samples and 19.7% from wound samples. Of isolates in our study, 37% were from urine, 21.5% wounds, 19.4% blood, 8.6% rectal swabs, and 6.5% sterile bodily fluids.
In the distribution of Enterococcus spp., the most common species are E. faecalis and E. faecium among enterococci leading to infection in humans. Despite the common species being E. faecalis, the rate of E. faecium has significantly increased in resistant enterococci in particular over the past years. SENTRY data show that VREfm strains increased from 40% to 62% from 1997 to 2002. In the same period, VREfs decreased from 4% to 3%. Regardless of the geographic region, currently many VRE clinical isolates are E. faecium (15). Wang et al. (16) analyzed data from their surveillance study of 8 years and Table 7. (Continued).
esp+hyl esp+gelE
Positive Negative Total
P Positive Negative Total P
n (%) n (%) n (%) n (%) n (%) n (%)
Urine Positive 2 (6.1) 31 (93.9) 33 (100) 0.317 2 (6.1) 31 (93.9) 33 (100) 0.286 Negative 9 (15) 51 (85) 60 (100) 1 (1.7) 59 (98.3) 60 (100)
Blood Positive 3 (16.7) 15 (83.3) 18 (199) 0.440 0 18 (100) 18 (100) 0.999 Negative 8 (10.7) 67 (89.3) 75 (100) 3 (4) 72 (96) 75 (100)
Rectal swabs Positive 1 (12.5) 7 (87.5) 8 (100) 0.999 0 8 (100) 8 (100) 0.999 Negative 10 (11.8) 75 (88.2) 85 (100) 3 (3.5) 82 (96.5) 85 (100)
Wounds Positive 2 (10) 18 (90) 20 (100) 0.999 1 (5) 19 (95.5) 20 (100) 0.521 Negative 9 (12.3) 64 (87.7) 73 (100) 2 (2.7) 71 (97.3) 73 (100)
Sterile bodily fluids Positive 0 6 (100) 6 (100) 0.999 0 6 (100) 6 (100) 0.999 Negative 11 (12.6) 76 (87.4) 87 (100) 3 (3.4) 84 (96.6) 87 (100)
Catheters Positive 1 (33.3) 2 (66.79) 3 (100) 0.318 0 3 (100) 3 (100) 0.999 Negative 10 (11.1) 80 (88.99) 90 (100) 3 (3.3) 87 (96.79) 90 (100)
Sputum Positive 2 (100) 0 2 (100) 0.013** 0 2 (100) 2 (100) 0.999 Negative 9 (9.9) 82 (90.1) 91 (100) 3 (3.3) 88 (96.7) 91 (100)
Drainage tubes Positive 0 1 (100) 1 (100) 0.999 0 1 (100) 1 (100) 0.999 Negative 11 (12) 81 (88) 92 (100) 3 (3.3) 89 (96.7) 92 (100)
reported that the rate of E. faecium increased from 12.4% (in 2002) to 27.3% (in 2010). In the same surveillance study vancomycin resistance rates were also increased.
In the surveillance study (17) of the Hacettepe University Faculty of Medicine conducted in 2008, 12 VRE were isolated and all of these isolates were E. faecium. Yiş et al. (18) evaluated 123 rectal swab samples taken from different services and 18 (14.6%) were identified as VRE.
As reported above, the most common species appear to be E. faecium and E. faecalis. Of 93 VRE isolates in our study, 95.7% were E. faecium (89/93) and 4.3% were E. faecalis (4/93). On the other hand, of VSE strains, 82.6% were E. faecalis (19/23) and 17.4% were E. faecium (4/23).
The most significant characteristic of enterococci that increases their importance is resistance to glycopeptides. The most common MDR1 gene is vanA, which is followed by vanB. In vanA type resistance, there is a high level of resistance to both vancomycin and teicoplanin. In vanB type resistance, there are various degrees of resistance to vancomycin, and sensitivity to teicoplanin. Both of the resistance types can be induced. The vanA resistance phenotype is more common in the United States and European countries as compared to others. A study by Protonotariou et al. (14) conducted in 2010 with 2123 Enterococcus isolates investigated MDR1 gene areas and identified 79.1% as vanA and 20.9% as vanB MDR1 genes. The results of a surveillance study (19) performed in Canada between 1999 and 2009 revealed that 81 of 128 VRE samples causing bacteremia were E. faecium, and 90.1% of them had vanA while 9.9% had vanB MDR1 gene areas (19). Çakırlar et al. (20) reported that all VRE strains included in their study harbored the vanA gene.
In the present study, 19.8% of total strains (23/116) were sensitive to vancomycin and teicoplanin, while 93 (80.17%) were resistant to both antibiotics. The vanA resistance type was present in all of the VRE strains. It was expected to identify the vanA resistance type because a large part of enterococci in this study were E. faecium.
In addition to MDR1 gene areas, the presence of virulence genes in enterococci is important in colonization of bacteria and occurrence of infections. We investigated the presence of virulence gene areas in a total of 116 Enterococcus strains, 93 being VRE and 23 being VSE.
The esp enterococcal surface protein, expressed on the surface of bacteria, can be transferred to other enterococci through conjugation. A high amount of esp is found in isolates causing bacteremia and endocarditis despite its low amount in enterococci isolated from stool samples (1). esp is thought to protect bacteria from the immune system of the host and is known to increase colonization in the urinary system, contributing to persistence (5). Expression of esp is correlated with formation of biofilm. Although esp is common in E. faecalis isolates, it is more common in
hospital-acquired E. faecium isolates in particular (4). The rate of esp expression in enterococcal isolates is 49.5%– 77% (21–23) in Asian countries, 33%–65% (8,24,25) in European countries, and 33%–76% in continental America (26–28). A study (29) conducted in Turkey reported that this rate was 25.6%. The esp virulence gene had the highest rate at 78.4% in our study. In Asian studies, the esp gene rates of species were 71%–87.5% for E. faecium, whereas they varied between 0% and 100% for E. faecalis (21,30,31). We found esp gene rates of species to be 79.8% in VRE E. faecium and 100% in VRE E. faecalis, 75% in VSE E. faecium, and 68.49% in VSE E. faecalis, and no statistical correlation was present between the virulence gene and species (Table 5).
In a previous study esp gene rates for VRE and VSE were 85.7% and 44.2%, respectively (32). In another study, out of 135 strains, 73 were VRE and 62 were VSE, and esp gene rates were 79.5% and 54.8%, respectively (33). In our study the esp gene rates for VRE and VSE were 79.8% and 75%, respectively (Table 5).
For VRE, the clinic where esp was most often isolated was hematology, and other clinics were 100%, while surgery clinics were 90.5%, burn clinics were 85.7%, nephrology was 81.8%, intensive care units were 7%, and pediatrics was 46.2%. The rate of the esp gene in strains isolated from pediatrics and other clinics was statistically significantly higher (P < 0.005) (Table 6). Most of our isolates were enterococci grown in urine samples, which was followed by wound and blood samples: 72.7% of urine samples had the esp gene (Table 7).
It was an interesting finding that the presence of the esp virulence gene area was higher than 40% in enterococci isolated from clinics other than intensive care units (Table 6).
The esp gene was detected from internal disease polyclinic patients at a rate of 100%, surgery polyclinic patients at a rate of 50%, and internal medicine intensive care units at 33.3%. Additionally, 100% of enterococci isolated from blood samples, 75% from sterile bodily fluids and wound samples, and 63.6% from urine samples had the esp virulence gene area (Tables 8 and 9). The existence of studies reporting that esp is thought to protect bacteria from the immune system of the host and is known to increase colonization in infections explains why the esp gene was mostly found in blood, sterile body fluids, wound, and urine samples.
Wıth regard to the presence of the hyl virulence gene area, the rate of hyl was 4%–7% in European countries (8,24,34,35), 17.2%–100% in continental America (27,36,37), and 53% in Saudi Arabia (38) in VSE strains. We found that 12.9% of all isolates had the hyl gene in this study. A Chinese study (30) conducted in 2012 with VRE reported that the rate of hyl was 31.3% in E. faecium and no hyl was found in E. faecalis.
Ta bl e 8. Acco rdin g t o c linics, v iru len ce g en es in i so la te d di str ib ut io n o f V SE. esp hy l ge lE as a1 Posi tiv e N ega tiv e To ta l P Posi tiv e N ega tiv e To ta l P Posi tiv e N ega tiv e To ta l P Posi tiv e N ega tiv e To ta l P n (%) n (%) n (%) n (%) n (%) n (%) n (%) n (%) n (%) n (%) n (%) n (%) Sur ger y p ol yc linics* Posi tiv e 5 (50) 5 (50) 10 (100) 0.169 0 10 (100) 10 (100) 0.999 7 (70) 3 (30) 10 (100) 0.214 7 (70) 3 (30) 10 (100) 0.402 N ega tiv e 11 (84.6) 2 (15.4) 13 (100) 1 (7.7) 12 (92.3) 13 (100) 5 (38.5) 8 (61.5) 13 (100) 6 (46.2) 7 (53.8) 13 (100) In ter na l p ol yc linics# Posi tiv e 5 (100) 0 5 (100) 0.242 1 (20) 4 (80) 5 (100) 0.217 2 (40) 3 (60) 5 (100) 0.640 2 (40) 3 (60) 5 (100) 0.618 N ega tiv e 11 (61.1) 7 (38.9) 18 (100) 0 18 (100) 18 (100) 10 (55.6) 8 (44.4) 18 (100) 11 (61.1) 7 (31.9) 18 (100) In ter na l in ten siv e ca re uni ts Posi tiv e 1 (33.3) 2 (66.7) 3 (100) 0.209 0 3 (100) 3 (100) 0.999 1 (33.3) 2 (66.7) 3 (100) 0.590 2 (66.7) 1 (33.3) 3 (100) 0.999 N ega tiv e 15 (75) 5 (25) 20 (100) 1 (5) 19 (95) 20 (100) 11 (55.9) 9 (45) 20 (100) 11 (55) 9 (45) 18 (100) Sur ger y c linics** Posi tiv e 2 (100) 0 2 (100) 0.999 0 2 (100) 2 (100) 0.999 1 (50) 1 (50) 2 (100) 0.999 1 (50) 1 (50) 2 (100) 0.999 N ega tiv e 14 (66.7) 7 (33.3) 21 (100) 1 (4.8) 20 (95.2) 21 (100) 11 (52.4) 10 (47.6) 21 (100) 12 (57.1) 9 (42.99) 21 (100) Pe di at rics Posi tiv e 2 (100) 0 2 (100) 0.999 0 2 (100) 2 (100) 0.999 1 (50) 1 (50) 2 (100) 0.999 1 (50) 1 (50) 2 (100) 0.999 N ega tiv e 14 (66.7) 7 (33.3) 21 (100) 1 (4.8) 20 (95.2) 21 (100) 11 (52.4) 10 (47.6) 21 (100) 12 (57.1) 9 (42.99) 21 (100) H em at olog y Posi tiv e 1 (100) 0 1 (100) 0.999 0 1 (100) 1 (100) 0.999 0 1 (100) 1 (100) 0.478 0 1 (100) 1 (100) 0.435 N ega tiv e 15 (68.2) 7 (31.8) 22 (100) 1 (4.5) 21 (95.5) 22 (100) 12 (54.5) 10 (45.5) 22 (100) 13 (59.1) 9 (40.9) 22 (100) *U ro log y, g en era l s ur ger y, o rt ho pe dics, o bs tet rics. #P edi at rics, r heum at olog y, der m at olog y, en do cr in olog y, inf ec tio us di se as es. **G en era l s ur ger y, o rt ho pe dics.
In this study, the rate of hyl was 15.5% and 4.3% respectively in E. faecium and E. faecalis in all isolates, whereas this rate was 15.7% in VREfm isolates but 0% in VREfs isolates. The hyl gene is a virulence factor that facilitates the spread of bacteria and toxins over tissues. The results of our study are consistent with the results of European and American studies for the hyl gene area. We found hyl to be the most commonly found virulence factor after esp in VRE strains. This factor was only found in one sample of VSEfs strains.
hyl was mostly isolated from pediatrics (23.1%), intensive care units (20%), and other clinic patients (17.6%) in VRE isolates and was mostly found in enterococci isolated from sputum (100%), catheter (33.3%), and blood (27.8%) samples. The association of hyl and hyl plus esp was statistically significant in enterococci isolated from sputum samples (P < 0.021, P < 0.013).
The rate of gelE was 12.9% in all isolates. The incidence rates of gelE were 27%–65.9% (21,22,39) in Asia, 60% in continental America (28), and 74.3% in Europe (40). Our rate was very low as compared to the rates of other studies. This can be considered a state specific to Turkey.
The gelE rates were 2% and 25% respectively in VREfm and VREfs, whereas it was 25% and 57.9% in VSEfm and VSEfs.
The rate of the asa1 gene was 11.1% in the present study. The percentage of the asa1 gene was 50% in VSEfm and 57.9% in VSEfs. The rate of the asa1 gene was 23%– 53.6% (21,22,39) in Asian studies and 63.5% (40) in a European study. These rates varied between 26.7% and 40% in Turkish studies (29,41). This gene was not found
in our VRE strains. The asa1 virulence gene is a virulence factor that allows bacteria to attach to eukaryotic surfaces, facilitating development of systemic infections. This result of our study is highly interesting. Although we did not detect this gene area in VRE strains, it is important that it was found in VSE strains.
The rate of the cyl gene was 6.8% in all isolates. Many studies did not find cyl in VRE isolates (8,36,42,43). We did not find cyl in VRE but did find it in VSE isolates with a rate of 6.9%. It is important to detect the cyl protein with cytolytic activity in VSE for nosocomial bacteremia caused by VSE strains.
In this study, all 15 strains without virulence factors were VRE. Although we detected one to four virulence genes in all of our VSE, we found a maximum of two virulence genes in VRE strains.
The association of esp and hyl was mostly present in VRE strains at 12.4%, whereas this rate was 5.3% in VSE strains. The rate of isolates with esp plus gelE was 6% in this study. These rates were 21.1%, 25%, and 2.2% respectively in VSEfs, VREfs, and VREfm.
Isolates with three or more virulence genes were found in urine and wound samples isolated from surgery and internal medicine polyclinics.
VRE are primary agents to consider in clinical approaches, and there is a common opinion that measures should be taken for nosocomial infections. However, virulence factors of bacteria are important in the spreading of infections caused by enterococci over tissues and organs. We consider that it is a significant result that VSE had more virulence genes than VRE. Based on these findings, it is Table 8. (Continued).
esp hyl gelE
Positive Negative Total
P Positive Negative Total P Positive Negative Total P n (%) n (%) n (%) n (%) n (%) n (%) n (%) n (%) n (%)
Surgery polyclinics* Positive 2 (20) 8 (80) 10 (100) 0.405 0 10 (100) 10 (100) 0.999 1 (10) 9 (90) 10 (100) 0.604 Negative 5 (38.5) 8 (61.5) 13 (100) 1 (7.7) 12 (92.3) 13 (100) 3 (23.1) 10 (76.9) 13 (100) Internal polyclinics# Positive 1 (20) 4 (80) 5 (100) 0.999 1 (20) 4 (80) 5 (100) 0.217 1 (20) 4 (80) 5 (100) 0.999
Negative 6 (33.3) 1 (66.7) 18 (100) 0 18 (100) 18 (100) 3 (16.7) 15 (83.3) 18 (100) Internal intensive care units Positive 2 (66.7) 1 (33.3) 3 (100) 0.209 0 3 (100) 3 (100) 0.999 0 3 (100) 3 (100) 0.999 Negative 5 (25) 15 (75) 20 (100) 1 (5) 19 (95) 20 (100) 4 (20) 16 (80) 20 (100) Surgery clinics** Positive 1 (50) 1 (50) 2 (100) 0.526 0 2 (100) 2 (100) 0.999 1 (50) 1 (50) 2 (100) 0.324
Negative 6 (28.6) 15 (71.4) 21 (100) 1 (4.8) 20 (95.2) 21 (100) 3 (14.3) 18 (85.79) 21 (100) Pediatrics Positive 1 (50) 1 (50) 2 (100) 0.526 0 2 (100) 2 (100) 0.999 1 (50) 1 (50) 2 (100) 0.324
Negative 6 (28.6) 15 (71.4) 21 (100) 1 (4.8) 20 (95.2) 2 (100) 3 (14.3) 18 (85.79 21 (100) Hematology Positive 0 1 (100) 1 (100) 0.999 0 1 (100) 1 (100) 0.999 0 1 (100) 1 (100) 0.999
Ta bl e 9. Th e di str ib ut io n o f v iru len ce g en es in V SE i so la te d f ro m c linic al s am ples. esp hy l ge lE as a1 Posi tiv e N ega tiv e To ta l P Posi tiv e N ega tiv e To ta l P Posi tiv e N ega tiv e To ta l P Posi tiv e N ega tiv e To ta l P n (%) n (%) n (%) n (%) n (%) n (%) n (%) n (%) n (%) n (%) n (%) n (%) Ur in e Posi tiv e 7 (63.6) 4 (36.4) 11 (100) 0.667 1 (9.1) 10 (90.9) 11 (100) 0.478 5 (45.5) 6 (54.5) 11 (100) 0.684 7 (63.6) 4 (36.4) 11 (100) 0.680 N ega tiv e 9 (75) 3 (75) 12 (100) 0 12 (100) 12 (100) 7 (58.3) 5 (41.7) 12 (100) 6 (50) 6 (50) 12 (100) Bl ood Posi tiv e 2 (100) 0 2 (100) 0.999 0 2 (100) 2 (100) 0.999 0 2 (100) 2 (100) 0.217 1 (50) 1 (50) 2 (100) 0.999 N ega tiv e 14 (66.7) 7 (33.3) 21 (100) 1 (4.8) 20 (95.2) 21 (100) 12 (57.1) 9 (42.2) 21 (100) 12 (57.1) 9 (42.9) 21 (100) Wo un ds Posi tiv e 6 (75) 2 (25) 8 (100) 0.999 0 8 (100) 8 (100) 0.999 6 (75) 2 (25) 8 (100) 0.193 4 (50) 4 (50) 8 (100) 0.685 N ega tiv e 10 (66.7) 5 (33.3) 15 (100) 1 (6.7) 14 (93.3) 15 (100) 6 (40) 9 (60) 15 (100) 9 (60) 6 (40) 15 (100) St er ile b odi ly fl uid s Posi tiv e 1 (100) 0 1 (100) 0.999 0 1 (100) 1 (100) 0.999 0 1 (100) 1 (100) 0.478 1 (100) 0 1 (100) 0.999 N ega tiv e 15 (68.2) 7 (31.8) 22 (100) 1 (4.5) 21 (95.5) 22 (100) 12 (54.5) 10 (45.5) 22 (100) 12 (54.5) 10 (45.5) 22 (100) Dra in ag e t ub es Posi tiv e 0 1 (100) 1 (100) 0.999 0 1 (100) 1 (100) 0.999 1 (100) 0 1 (100) 0.999 0 1 (100) 1 (100) 0.435 N ega tiv e 16 (72.7) 6 (27.3) 22 (100) 1 (4.5) 21 (95.5) 22 (100) 11 (50) 11 (50) 22 (100) 13 (59.1) 9 (40.9) 22 (100)
important and necessary to investigate MDR1 gene areas in the pathogenicity of enterococci as well as to investigate virulence genes in both VRE and VRE strains.
This study includes in vitro results of the association of virulence characteristics in VRE and VSE strains. VRE are important causes of difficult-to-treat infections, especially in hospitalized patients. According to our results, VSE are also important microorganisms due to their virulence factors. Vancomycin resistance virulence factors should also be taken into consideration. In conclusion, we
think that not only VRE but also VSE may cause serious infections. In our opinion, new studies extended with clinical findings, hospitalization duration, severity of infection, and treatment protocols would help further clarify the subject.
Acknowledgment
This study was supported by the Başkent University Research Fund with project number DA12/30.
Table 9. (Continued).
esp hyl gelE
Positive Negative Total
P Positive Negative Total P Positive Negative Total P n (%) n (%) n (%) n (%) n (%) n (%) n (%) n (%) n (%) Urine Positive 3 (27.3) 8 (72.7) 11 (100) 0.999 1 (9.1) 10 (90.9) 11 (100) 0.478 1 (9.1) 10 (90.9) 11 (100) 0.590 Negative 4 (33.3) 8 (66.79) 12 (100) 0 12 (100) 12 (100) 3 (25) 9 (75) 12 (100) Blood Positive 1 (50) 1 (50) 2 (100) 0.526 0 2 (100) 2 (100) 0.999 0 2 (100) 2 (100) 0.999 Negative 6 (28.6) 15 (71.4) 21 (100) 1 (4.8) 20 (95.2) 21 (100) 4 (19) 17 (81) 21 (100) Wounds Positive 2 (25) 6 (75) 8 (100) 0.999 0 8 (100) 8 (100) 0.999 3 (37.5) 5 (62.5) 8 (100) 0.103 Negative 5 (33.3) 10 (66.7) 15 (100) 1 (6.7) 14 (93.3) 15 (100) 1 (6.7) 14 (93.3) 15 (100) Sterile bodily fluids Positive 1 (100) 0 1 (100) 0.304 0 1 (100) 1 (100) 0.999 0 1 (100) 1 (100) 0.999
Negative 6 (27.3) 16 (72.7) 22 (100) 1 (4.5) 21 (95.5) 22 (100) 4 (18.2) 18 (81.8) 22 (100) Drainage tubes Positive 0 1 (100) 1 (100) 0.999 0 1 (100) 1 (100) 0.999 0 1 (100) 1 (100) 0.999
Negative 7 (31.8) 15 (68.2) 22 (100) 1 (4.5) 21 (95.5) 22 (100) 4 (18.2) 18 (81.8) 22 (100)
References
1. Gültekin M. Enterococci: microbiology, epidemiology and pathogenesis. In: Ulusoy S, Usluer G, Ünal S, editors. Gram-Positive Bacterial Infections. 2nd ed. Ankara, Turkey: Scientific Medical Publisher; 2012 (in Turkish).
2. Uttley AH, Collins CH, Naidoo J, George RC. Vancomycin-resistant enterococci. Lancet 1988; 1: 57-58.
3. Vural T, Şekercioğlu AO, Ögünç D, Gültekin M, Çolak D, Yeşilipek A, Ünal S, Kocagöz S, Mutlu G. Vankomisine dirençli
Enterococcus faecium suşu. ANKEM Derg 1999; 13: 1-4 (in
Turkish).
4. Sava IG, Heikens E, Huebner J. Pathogenesis and immunity in enterococcal infections. Clin Microbiol Infect 2010; 16: 533-540.
5. Kayaoğlu G, Orstavik D. Virulence factors of Enterococcus faecalis: relationship to endodontic disease. Crit Rev Oral Biol Med 2004; 15: 308-320.
6. Clinical and Laboratory Standards Institute. Performance Standards for Antimicrobial Susceptibility Testing; Nineteenth Informational Supplements. CLSI Document M100- S19. Wayne, PA, USA: Clinical and Laboratory Standards Institute; 2012.
7. Dutka-Malen S, Evers S, Courvalin P. Detection of glycopeptide resistance genotypes and identification to the species level of clinically relevant enterococci by PCR. J Clin Microbiol 1995; 33: 24-27.
8. Vankerckhoven V, Van Autgaerden T, Vael C, Lammens C, Chapelle S, Rossi R, Jabes D, Goossens H. Development of a multiplex PCR for the detection of asa1, gelE, cylA, esp and hyl genes in enterococci and survey for virulence determinants among European hospital isolates of Enterococcus faecium. J Clin Microbiol 2004; 42: 4473-4479.
9. Panesso D, Reyes J, Rincon S, Diaz L, Galloway-Pena J, Zurita J, Carrillo C, Merentes A, Guzman M, Adachi JA et al. Molecular epidemiology of vancomycin-resistant Enterococcus faecium: a prospective, multicenter study in South American hospitals. J Clin Microbiol 2010; 48: 1562-1569.
10. Turkish Ministry of Health. Antimicrobial Resistance Rates. National Nosocomial Infections Surveillance Study: 2011-2012 Statistics. Ankara, Turkey: Ministry of Health; 2013. Available online at http//www.uhes.saglik.gov.tr.
11. Turkish Ministry of Health. Antimicrobial Resistance Rates. National Nosocomial Infections Surveillance Study: 2008-2009-2010 Statistics. Ankara, Turkey: Ministry of Health; 2013. Available online at http//www.uhes.saglik.gov.tr.
12. Aygün H, Memikoğlu OK, Tekeli A, Azap A, Yörük F. Hastanede yatan riskli hasta gruplarında vankomisin dirençli enterokok kolonizasyonunun surveyansı. Turk J Anaesth Reanim 2008; 36: 168-173 (in Turkish).
13. Aral M, Paköz NİE, Aral İ, Doğan S. Antibiotic resistance of
Enterococcus faecalis and Enterococcus faecium strains isolated
from various clinical samples. Turk Bull Hyg Exp Biol 2011; 68: 85-92 (in Turkish with English abstract).
14. Protonotariou E, Dimitroulia E, Pournaras S, Pitiriga V, Sofianou D, Tsakris A. Trends in antimicrobial resistance of clinical isolates of Enterococcus faecalis and Enterococcus faecium in Greece between 2002 and 2007. J Hosp Infect 2010; 75: 225-227.
15. Mendes RE, Woosley LN, Farrell DJ, Sader HS, Jones RN. Oritavancin activity against vancomycin-susceptible and vancomycin-resistant enterococci with molecularly characterized glycopeptide resistance genes recovered from bacteremic patient, 2009-2010. Antimicrob Agents Chemother 2012; 56: 1639-1642.
16. Wang JT, Chang SC, Wang HY, Chen PC, Shiau YR, Lauderdale TL. High rates of multidrug resistance in Enterococcus faecalis and E. faecium isolated from inpatient and outpatient in Taiwan. Diagn Microbiol Infect Dis 2013; 75: 406-411.
17. Altun B, Cengiz AB, Kara A, Ceyhan M, Ünal S, Seçmeer G, Gür D. First vancomycin-resistant blood isolate of Enterococcus
faecium in a children’s hospital and molecular analysis of the
mechanism of resistance. Turk J Pediatr 2008; 50: 554-558. 18. Yiş R, Aslan S, Çıtak Ç, Değirmenci S. Evaluation of
vancomycin-resistant Enterococcus colonization at Gaziantep Children’s Hospital, Turkey. Mikrobiyol Bul 2011; 45: 646-654 (in Turkish with English abstract).
19. McCracken M, Wong A, Mitchell R, Gravel D, Conly J, Embil J, Johnston L, Matlow A, Ormiston D, Simor AE et al. Molecular epidemiology of vancomycin-resistant enterococcal bacteraemia: results from the Canadian Nosocomial Infection Surveillance Program 1999-2009. J Antimicrob Chemother 2013; 68: 1505-1509.
20. Cakirlar FK, Samasti M, Baris I, Kavakli H, Karakullukcu A, Sirekbasan S, Bagdatli Y. The epidemiological and molecular characterization of vancomycin-resistant enterococci isolated from rectal swab samples of hospitalized patient in Turkey. Clin Lab 2014, 60: 1807-1812.
21. Hasani A, Sharifi Y, Ghotaslou R, Naghili B, Hasani A, Aghazadeh M, Milani M, Bazmai A. Molecular screening of virulence genes in high-level gentamicin-resistant Enterococcus faecalis and Enterococcus faecium isolated from clinical specimens in Northwest Iran. Indian J Med Microbiol 2012; 30: 175-181.
22. Sharifi Y, Hasani A, Ghotaslou R, Varshochi M, Hasani A, Aghazadeh M, Milani M. Survey of virulence determinants among vancomycin resistant Enterococcus faecalis and Enterococcus faecium isolated from clinical specimens of hospitalized patients of North west of Iran. Open Microbiol J 2012; 6: 34-39.
23. Ira P, Sujatha S, Chandra PS. Virulence factors in clinical and commensal isolates of Enterococcus species. Indian J Pathol Microbiol 2013; 56: 24-30.
24. Billström H, Lund B, Sullivan A, Nord CE. Virulence and antimicrobial resistance in clinical Enterococcus faecium. Int J Antimicrob Agents 2008; 32: 374-377.
25. Woodford N, Soltani M, Hardy KJ. Frequency of esp in Enterococcus faecium isolates. Lancet 2001; 358: 584.
26. Lopes-Salas P, Llaca-Diaz J, Morfin-Otero R, Tinoco JC, Rodriguez-Noriega E, Salcido-Gutierres L, Gonzales GM, Mendoza-Olazaran S, Garza-Gonzales E. Virulence and antibiotic resistance of Enterococcus faecalis clinical isolates recovered from three states of Mexico. Detection of linezolid resistance. Arch Med Res 2013; 44: 422-428.
27. Rice LB, Carias L, Rudin S, Vael C, Goossens H, Konstabel C, Klare I, Nallapareddy SR, Huang W, Murray BE. A potential virulence gene, hylEfm, predominates in Enterococcus faecium of clinical origin. J Infect Dis 2003; 187: 508-512.
28. Comerlato CB, Resende MC, Caierao J, d’Azevedo PA. Presence of virulence factors in Enterococcus faecalis and Enterococcus faecium susceptible and resistant to vancomycin. Mem Inst Oswaldo Cruz 2013; 108: 590-595.
29. Baylan O, Nazik H, Bektöre B, Çitil BE, Turan D, Öngen B, Özyurt M, Açıkel CH, Haznedaroğlu T. The relationship between antibiotic resistance and virulence factors in urinary
Enterococcus isolates. Mikrobiyol Bul 2011; 45: 430-445 (in
Turkish with English abstract).
30. Sun H, Wang H, Xu Y, Jones RN, Costello AJ, Liu Y, Li G, Chen M, Mendes RE. Molecular characterization of vancomycin-resistant Enterococcus spp. clinical isolates recovered from hospitalized patients among several medical institutions in China. Diagn Microbiol Infect Dis 2012; 74: 399-403.
31. Chang CM, Wang LR, Lee HC, Lee NY, Wu CJ, Ko WC. Characterisation of vancomycin-resistant enterococci from hospitalised patients at a tertiary centre over a seven-year period. J Hosp Infect 2010; 74: 377-384.
32. Al-Talib H, Zuraina N, Kamarudin B, Yean CY. Genotypic variations of virulent genes in Enterococcus faecium and Enterococcus faecalis isolated from three hospitals in Malaysia. Adv Clin Exp Med 2015; 24: 121-127.
33. Kang M, Xie Y, He C, Chen ZX, Guo L, Yang Q, Liu JY, Du Y, Ou QS, Wang LL. Molecular characteristics of vancomycin-resistant Enterococcus faecium from a tertiary care hospital in Chengdu, China: molecular characteristics of VRE in China. Eur J Clin Microbiol Infect Dis 2014; 33: 933-939.
34. Bourdon N, Fines-Guyon M, Thiolet JM, Maugat S, Coignard B, Leclercq R, Cattoir V. Changing trends in vancomycin-resistant enterococci in French hospitals, 2001-08. J Antimicrob Chemother 2011; 66: 713-721.
35. Thierfelder C, Keller PM, Kocher C, Gaudenz R, Hombach M, Bloemberg GV, Ruef C. Vancomycin-resistant Enterococcus. Swiss Med Wkly 2012; 142: 13540.
36. Camargo IL, Gilmore MS, Darini AL. Multilocus sequence typing and analysis of putative virulence factors in vancomycin-resistant and vancomycin-sensitive Enterococcus faecium isolates from Brazil. Clin Microbiol Infect 2006; 12: 1123-1130. 37. Palazzo IC, Pitondo-Silva A, Levy CE, da Costa Darini AL.
Changes in vancomycin-resistant Enterococcus faecium causing outbreaks in Brazil. J Hosp Infect 2011; 79: 70-74.
38. Khan MA, van der Wal M, Farrell DJ, Cossins L, van Belkum A, Alaidan A, Hays JP. Analysis of vanA vancomycin-resistant Enterococcus faecium isolates from Saudi Arabian hospitals reveals the presence of clonal cluster 17 and two new Tn1546 lineage types. J Antimicrob Chemother 2008; 62: 279-283. 39. Udo EE, Al-Sweih N. Frequency of virulence-associated genes
in Enterococcus faecalis isolated in Kuwait hospitals. Med Princ Pract 2011; 20: 259-264.
40. Creti R, Imperi M, Bertuccini L, Fabretti F, Orefici G, Di Rosa R, Baldassarri L. Survey for virulence determinants among Enterococcus faecalis isolated from different sources. J Med Microbiol 2004; 53: 13-20.
41. Gülhan T, Aksakal A, Ekin İH, Savaşan S, Boynukara B. Virulence factors of Enterococcus faecium and Enterococcus faecalis strains isolated from humans and pets. Turk J Vet Anim Sci 2006; 30: 477-482.
42. Song JY, Cheong HJ, Seo YB, Kim IS, Heo JY, Noh JY, Choi WS, Kim WJ. Clinical and microbiological characteristics of vancomycin-resistant enterococci with the vanD phenotype and vanA genotype. Jnp J Infect Dis 2013; 66: 1-5.
43. Brilliantova AN, Kliasova GA, Mironova AV, Tishkov VI, Novichkova GA, Bobrynina VO, Sidorenko SV. Spread of vancomycin-resistant Enterococcus faecium in two haematological centres in Russia. Int J Antimicrob Agents 2010; 35: 177-181.