Published: February 25, 2011
pubs.acs.org/JPCC
Spectroscopic Study of Platinum and Rhodium Dendrimer
(PAMAM G4OH) Compounds: Structure and Stability
Yuri Borodko,
†Christopher M. Thompson,
‡Wenyu Huang,
‡Huseyin B. Yildiz,
‡,||Heinz Frei,
§and
Gabor A. Somorjai*
,†,‡†Materials Sciences Division, Lawrence Berkeley National Laboratory, Berkeley, California 94720, United States ‡Department of Chemistry, University of California, Berkeley, California 94720, United States
§Physical Biosciences Division, Lawrence Berkeley National Laboratory, Berkeley, California 94720, United States
’ INTRODUCTION
Hydroxyl-terminated, poly(amidoamine) dendrimer (PAMAM) has been used extensively as a macroligand for stabilizing metallic nanoparticles with different sizes.1
PAMAM acts as a flexible membrane around metallic nanoparticles, and the application of Pt-PAMAM and Rh-PAMAM nanoparticles in catalytic reactions has recently offered promising new opportunities to create tailored catalytic systems.2Several experimental techniques have been used to explore the fourth generation hydroxyl-terminated dendrimer (G4OH) containing platinum (PtG4OH) and rho-dium (RhG4OH).1,2However, the nature of interaction between the “star-burst” poly(amidoamine) dendrimer and Pt and Rh particles is not well-known. This information is important to the synthesis of PAMAM stabilized nanoparticles, since capping agent-metal interaction is often the main director of metal par-ticle size and shape, as well as to their application in catalysis, where the capping agent determines many parameters of the nanoparticle surface, such as electronic structure of metal atoms, accessible surface area, and stability.
We undertook in situ spectroscopic studies of dendrimer stabilized rhodium and platinum nanoparticles to understand the interaction between the dendrimer and the encapsulated metal. In particular, we have investigated the coordination site for
platinum ions with resonance UV-Raman spectroscopy, and from this data we present a possible reason for the anomalous resistance of platinum to reduction by sodium borohydride. The data for UV-vis diffuse-reflectance in situ spectra of PtG4OH supported on mesoporous silica (SBA-15) indicate on the formation of small Pt clusters, analogs of Pt-blue coordination compounds. To investigate the capping removal process and to gain information on the stability of the nanoparticles we have applied Fourier transform infrared spectroscopy to the study of thermal and photolytic degradation of the dendrimer-capped Pt and Rh nanoparticles in various conditions.
’ EXPERIMENTAL SECTION
Synthesis of Pt and Rh PAMAM (G4OH) Compounds. Dendrimer-encapsulated platinum and rhodium NPs were pre-pared following a previously published method.3Generation 4 dendrimers (MW = 14 215 amu) were purchased from Dendri-tech Inc. (Midland, MI) as 10.2% (mass) methanol solution and used without further purification. A dendrimer stock solution Received: December 7, 2010
Revised: January 24, 2011 ABSTRACT:Hydroxyl-terminated, poly(amidoamine) (PAMAM)
dendrimer-capped platinum and rhodium nanoparticles were studied with UV-vis, Fourier transform IR, and UV-Raman spectroscopy. The adsorption bands in the region of 190-900 nm were shown to be sensitive to the electronic structure of Pt compounds in solution and in the solid state. The electron charge-transfer Pt2þr N band at 260 nm was attributed to mononuclear Pt2þcompounds, and resonance Raman (244 nm) established that the electron donors are amide nitrogen atoms. Multidentate coordination bonding with Pt2þcauses a strong
stabilizing chelate effect, and this entropic factor hinders reduction of Pt2þby BH
4-. UV diffuse-reflectance spectra showed the appearance of new bands at 300 and 342 nm in PtG4OH deposited on mesoporous silica (SBA-15) induced by heating under reducing conditions. The new bands can be assigned to platinum clusters like binuclear Pt2þ-Pt2þand higher, dendrimer-capped analogs of platinum blue compounds. In the temperature range of 30 to 350°C, the decomposition of G4OH begins above 150 °C with dehydrogenation of backbone. The presence of platinum and rhodium particles decreased the initial temperature of decay. In reducing conditions, the PtG4OH undergoes rearrangements of its secondary structure due to the formation of metallic platinum clusters. UV- photochemical degradation of G4OH, Pt- and Rh-dendrimer systems in ozone-rich atmosphere as well in H2and Ar showed that effect of UV light is greater than the of ozone. The ratio of initial rates for photolysis and “dark” ozonolysis was Whv/WO3∼ 40.
(250 μM) was prepared by adding the dendrimer methanol solution to water. The dendrimer stock solution was mixed with 40 mol equivalents (40 mols Pt2þper mole of dendrimer) of an aqueous solution of 0.01 M K2PtCl4in a 20 mL vial. The vial was purged with Ar for 30 min, tightly sealed with a septum, and allowed 66 h for complexation. Then, a 20-fold excess (with respect to Pt2þ) of freshly prepared 0.5 M NaBH4(stored at 0°C before use) was injected into the vial dropwise under vigorous stirring. The reaction solution was stirred for an additional 8 h. The reaction solution (10 mL) was purified by dialysis against 2 L of deionized water in cellulose dialysis sacks with a molecular weight cutoff of 12 000 g/mol (Sigma-Aldrich, Inc., St. Louis, MO). Dialysis occurred over 24 h with the water being changed 4 times. UV Photolysis in O2, H2and Ar Atmosphere.Degradation by UV light took place in a homemade chamber with two 13W low pressure mercury germicidal lamps as described elsewhere.4 The sample was placed directly under a mercury low pressure lamp at a distance of approximately 1 mm. The appropriate gas flowed through the chamber for 60 min prior to illumination and continuously during illumination. Ozone effects were isolated from light effects in a“dark” experiment by placing the sample in an open-ended Pyrex tube wrapped in aluminum foil to block all incidents light.
’ SPECTROSCOPIC CHARACTERIZATION
UV-vis. Uv-vis optical properties of Pt and Rh nanoparticles were characterized using a UV-vis spectrophotometer, Perkin-Elmer,
LAMDA 650 (190-900 nm). Spectra were taken of drop cast films deposited on a quartz window in transmission or on Al foil in reflectance mode with an integrating sphere 60 mm in diameter coated with Spectralon. UV-spectra presented in ab-sorbance unit in the case of transmission mode measurements, or absorptance (100-T-R)% unit for reflectance mode. The influ-ence of heating in H2/Ar flow (20-250 °C) on diffuse reflec-tance spectra of drop cast films was studied in homemade cell and in quartz cell for liquids in the range of 20-100 °C.
FTIR-DRIFT. FTIR-DRIFT spectra were acquired with a Nicolet Nexus-670 spectrophotometer with integrated diffuse reflectance optics (Spectra-Tech Collector II). Improved spectra were obtained by using a thin layer of PtG4OH or RhG4OH deposited on aluminum foil. Since the layer thickness can be adjusted so as to render the sample partially IR transparent, we were able to optimize the ratio of diffuse to specular reflectance and obtain spectra of similar quality compared to those measured in transmission mode.5Infrared spectra for the UV degradation studies were acquired ex situ in a Nicolet 6700 FTIR with the Thermo DRIFTS accessory. Each spectrum was the average of at least 128 scans with resolution of 4 cm-1. The temperature/ vacuum chamber Spectra-Tech 0030-101 was used for in situ FTIR thermal degradation measurements in 10% H2balanced with Ar or pure O2flow.
ATR-FTIR.ATR-FTIR Spectra were measured by depositing samples on the ATR internal reflection element (ZnSe, Ge) of a variable angle horizontal ATR accessory ATRMax II from PIKE Technology. The angle of incidence was 60° and 7 reflections were used. ATR Spectra were corrected using OMNIC ATR Advance correction software from Thermo Electron.
Deep UV-Raman Spectroscopy. The deep UV-Raman spectroscopy system was described in detail elsewhere.6,7 Figure 1. UV-vis spectra of K2PtCl4 þ G4OH. (a) Absorption
spectrum in water solution without reduction by BH4-(complexation
stage) (1). Absorption spectrum of dry sample (on quartz window) after reduction by BH4-(2). Diffuse reflectance spectrum of dry sample after
reduction by BH4- (3). Dotted spectrum presents the background
correction of spectrum 1. (b) Comparison of UV absorption spectra of PtG4OH, RhG4OH, and pure G4OH in H2O. (c) Absorption spectra of
(Pt2þ)G4OH before reduction (1) and after reduction by BH4-(2).
(Inset of c) Background corrected and deconvoluted UV spectrum of reduced PtG4OH.
Figure 2. UV-vis spectra. (a) Diffuse reflectance spectra of PtG4OH (thick (1) and thin (2) layer) and pure SBA-15 (3). (b) Diffuse-reflectance spectra of RhG4OH/Al (1) and RhG4OH/SBA-15 (2).
A continuous wave (cw) intracavity-doubled argon ion laser operating at 244 nm was used as the excitation source. Backscattered light was collected and directed into a Spex 1877C, triple spectrometer that was optimized for perfor-mance in the deep UV region. Spectra were recorded with an LN2-cooled, UV-enhanced CCD camera. The instrument dispersion was 2.1 cm-1/ pixel; the typical resolution was 12 cm-1. To eliminate decomposition of PtG4OH and RhG4OH samples under UV irradiation, we used a custom designed rotating sample holder (400-1200 rpm) equipped with a second motor for lateral translation (240 rpm). In this manner, the laser beam was XY-rastered over the entire sample (deposited on Al foil) decreasing the UV exposure in a given spot by 10-3 when compared to a static sample holder. Typical collection times were 5-30 min, using 3-5 mW of 244 nm excitation energy. GRAMS/AI and Omnic software from Thermo Galactic was used for processing FTIR-DRIFT and UV-Raman spectra.
’ RESULTS AND DISCUSSION
UV-vis Spectra of Pt and Rh Compounds with Dendrimer As Stabilizer.Recently UV-vis absorption spectra have been presented in refs 3 and 8 for Pt and Rh nanoparticles stabilized with fourth and sixth - generation hydroxyl-terminated PA-MAM dendrimers. UV spectra were used to study the interac-tions of “guest” metal ions with the hetero atoms of a “host” organic stabilizer as well to quantify the degree of reduction of both the Pt2þand Pt4þions by BH4-and H2. It was previously shown that the absorption band observed near 260 nm may be assigned to electron charge transfer (CT) from the capping Figure 3. UV-vis diffuse-reflectance spectra of PtG4OH/Al. (a)
Spectrum of initial PtG4OH/Al (1) and after reduction at 150°C for 60 min inflow H2/Ar. (b) Background corrected spectra of (a) initial
PtG4OH/Al (1) and spectrum of PtG4OH/Al after reduction at 150°C for 60 min inflow H2/Ar. (c) Time dependence of the charge-transfer
band N f Pt2þduring reduction of PtG4OH in H2/Arflow at 150 °C:
a, initial; b, 30 min; and c, 90 min. (Inset of c) The deconvoluted CT band after reduction for 90 min with three component at 266, 302, and 342 nm.
Figure 4. (a) UV-Raman spectra of systems dried on aluminum foil Pure G4OH (1), PtG4OH (2), and RhG4OH(3). (b) UV-vis spectrum of PtG4OH and RhG4OH. (c) Raman spectra of PtG6OH in H2O after
dendrimer to the platinum ions. In this paper, we present the UV-vis spectra of G4OH, PtG4OH, RhG4OH, and PtG4OH/ SBA-15 as (i) absorbance of a homogeneous solution, (ii) absorbance of a drop-cast film deposited on a quartz window, and (iii) diffuse reflectance of a film deposited on aluminum foil. We also present UV-vis spectra of Pt and Rh nanoparticles subjected to reduction in flowing hydrogen at temperatures ranging from 30 to 200 °C. The spectra shown in Figure 1a show that the UV spectra of K2PtCl4 þ G4OH (before re-duction) in solution and as dry drop-cast film on quartz (transmission mode) or on Al foil (diffuse reflectance mode) all have a band at 260 nm.
After reduction of K2PtCl4þ G4OH solution by BH4-the band at 260 nm is reduced in intensity only slightly, suggesting that in our PtG4OH samples the reduction of Pt2þions by BH4 -is only partially complete and that the largest fraction of platinum is in the ionic form. A new band appears in the spectrum near 290 nm (Figure 1c), which may be assigned to charge transfer transition to a vacant d orbital of platinum(II) multinuclear clusters. Formation of binuclear and tetranuclear“platinum blue” compounds may induce a red shift of the CT band.9 The presence of the new band is more evident in the inset in Figure 1c.
A comparison was made between the diffuse reflectance spectra of PtG4OH and RhG4OH samples supported on mesoporous silica (SBA-15), which have been used as heterogeneous catalysts. As seen in the spectra of PtG4OH (Figure 2a) the CT band at 258 nm is still well-defined and resembles the spectrum of PtG4-OH in solution (Figure 1b). In contrast, the diffuse reflectance
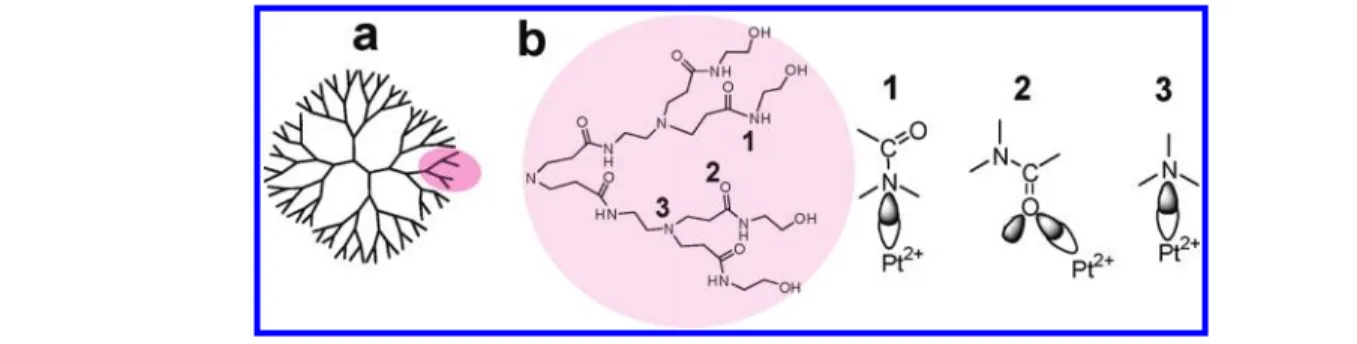
spectrum of RhG4OH deposited on SBA-15 does not show pronounced absorption bands and has only a weak feature at 290 nm (Figure 2b). For many metals, such as rhodium, gold, and silver, the reduction of dendrimer supported metal ions by sodium borohydride and the formation of nanoparticles inside the Scheme 1. (a) Cartoon of the Full-Branched Structure of G4OH and (b) an Enlarged Branch and Possible Coordination Sites for Pt2þ
Scheme 2. Suggested Composition of PtG4OH Fragment after reduction by BH4-in Water Solutiona
aInternal platinum cations with strong stabilizing chelate effect (blue circles) and external weekly bonded Pt2þ(orange circles) transformed into
binuclear Pt2þ-Pt2þ(3) and Pt colloids (4).
Table 1. IR Bands (cm-1) Assignments for G4OH PAMAM Dendrimer
IR assignments12, 14
3374 O-H str end group
3295 amide N-H stretch 3195 (sh) 3084 amide II overtone 2970 asym CH2stretch 2933 2872 sym CH2stretch 2824 1638 amide I, CdO 1550 amide II,ν(C-N) þ δ(C-N-H) 1461 CH2def scissoring 1432 CRH2def 1359 CH2wagging 1151 amide III 1132 1064 ν(NC3) as, skeletal C-C 916 ν(NC3) sym 691 CH2rocking
dendrimer is fast and goes to completion. Platinum is known to be different in that it is the only metal for which reduction of the main quantity of cations inside the dendrimer does not occur in the presence of sodium borohydride. Instead, nanoparticles are formed only from ions coordinated to terminal hydroxyl groups of the dendrimer. Inside the dendrimer, a minute quantity of Pt2þsmall clusters with 2-4 Pt2þatoms are formed by reduction of (Pt2þ)nG4OH, and other platinum ions are left unaffected, as detected by EXAFS.11Such small clusters of platinum coordi-nated to nondendrimeric amide ligands (“platinum blue”) have been isolated and structurally characterized,9and it is known that the (Ptδþ)ncluster, where n = 2, 4, has characteristic absorption bands at 290-300 nm and 347-375 nm.9
We attribute the new band in our spectra at 290 nm to binuclear Pt2þ- Pt2þ or tetranuclear Pt4 linear clusters stabilized by amide bridging ligands, as in the so-called“platinum blue” coordination com-pounds. Such Pt2þsmall clusters with 2-4 Pt2þatoms were detected by EXAFS after reduction of (Pt2þ)nG4OH by hydro-gen in a previous report.11
Reduction of platinum ions supported on SBA-15 can alter-natively be achieved by heating in hydrogen. The UV diffuse-reflectance in situ spectrum of PtG4OH/SBA-15 changes noticeably upon reduction in H2/Arflowing at 150 °C for 60 min (Figure 3a). In the background-corrected spectrum three bands may be perceived at 214 nm, 266 and 300 nm (Figure 3b). We assume that the band at 266 nm can be assigned to the CT n*fd transition for unreduced Pt2þand the two other new bands can be attributed to Pt clusters formed by the aggregation of two or four Pt ions.9The band at 300 nm can be assigned to charge transfer of electrons from the stabilizer to the Pt atoms of the cluster. The band at 214 nm has been previously assigned to isolated anionic Pt4clusters.10aBecause there is little likelihood
of the coexistence of cationic and anionic Pt clusters in a reducing atmosphere, we interpret the band at 214 nm as an interband transition10c in large Pt colloids due to reduction of weakly bonded “external” Pt2þ coordinated to the surface OH end-group. Time-resolved diffuse-reflectance in situ spectra of PtG4OH drop-cast on Al-foil show noticeable change of the CT-band upon heating in H2/Arflow at 150 °C (Figure 3c). Heating in hydrogen initially reduces the intensity of the 266 nm band (CT n*f Pt2þ) characteristic of single platinum ion coordination compounds and then causes the appearance of bands at 302 nm and at 342 nm (inset in Figure 3c). We attribute the new bands at 302 and at 342 nm to binuclear Pt2þ- Pt2þand tetranuclear Pt4linear clusters which we observed in PtG4OH samples reduced by sodium borohydride.
Resonance Raman spectra of PtG4OH and RhG4OH.The origin of the UV absorption band near 260 nm in (Pt2þ)40 G4OH during the“complexation” stage and after reduction by BH4-is not clear based on previous studies. Other authors have supposed8that this band arises from the ligand-to-metal charge-transfer from tertiary amines of the dendrimer to bound Pt2þ, but EXAFS studies of PtG4OH up to this point have not lead to a definite conclusion as to whether it is an amide or amine group of Figure 5. (a) FTIR-ATR Spectra of G4OH, PtG4OH, and RhG4OH. Drop castfilms on Ge prism, s-polarization. (b) Comparison of the FTIR-DRIFT spectra for G4OH heated in O2flow at 40 and 270 °C. Intensity normalized to N-H stretch at 3296 cm-1. (c) Deconvolution of CH stretching bands
(background corrected in panel b) at 40°C. (d) Deconvolution of CH stretching bands at 270 °C.
Scheme 3. Likely Products of Dendrimer Dehydrogenation Following Hydrogen Abstraction at the Amide-Neighboring Methylene Group
the host which is ligated to platinum.11The nitrogen atoms of these groups are not differentiable by EXAFS due to their similar phase shifts and backscattering amplitudes. This exact identity of the coordination site is important in understanding the com-plexation process in the synthesis of dendrimer encapsulated nanoparticles and, moreover, in understanding the resistance of the (Pt2þ)40G4OH complex to reduction by NaBH4and H2.
We used deep UV Raman (244 nm) spectroscopy to study the resonance Raman spectra of both PtG4OH and RhG4OH. Resonance Raman enhances only those few vibration modes associated with the chromophore embedded in the dendrimer structure, which participates in CT electron transition at 260 nm. We were able to determine the structure of the electron-donor group of the dendrimer involved in the CT-transition at 260 nm, because this band partly overlaps the excitation laser line at 244 nm. Depending on the identity of Pt r ligand couple, we might expect a selective enhancement of only specific vibration modes, for example, Amide I (>CdO str), Amide II (CR-N-H bend, C-N str) or ν(NC3 str). The absorption bands at 1650 and 1570 cm-1 in vibrational spectra of high molecular weight polyamides, as well as the PAMAM dendrimer, have been assigned to the Amide I and Amide II modes. It is recognized that the intensity of these bands is sensitive to the secondary structure of the polyamide. The vibration modes of Amide I and Amide II, hereafter denoted“AmI” and “AmII”, are mixed, and DFT calculation estimates have given the composition of AmI as CO str (86), CN str (11), and CRCN bend (10), and AmII as CNH bend (59), CN str (34).12
The deep UV Raman spectra of pure G4OH were collected for samples in two aggregate states: as concentrated solution and as a
thick drop-castfilm on Al foil. The Raman spectrum of G4OH is “normal”, since the dendrimer does not absorb UV light near 244 nm (Figure 1b). The spectra of dry G4OH (Figure 4a-1) show bands at 1643 cm-1(AmI), 1560 cm-1(AmII), 1440 cm-1,and 1300 cm-1. The intensity ratio of these bands in the aqueous sample is substantially different from those in the solid phase (data not shown) due to the influence of hydrogen bonding between water and amide groups on the secondary structure of G4OH. The Raman spectrum of PtG4OH in Figure 4a-2 demon-strates the selective enhancement of intensities for only two vibrational modes at 1440 and 1565 cm-1. Under the same experimental conditions bands for RhG4OH (Figure 4a-3) were detected at 1590, 1420, and 1310 cm-1, but the Raman signal was 2 orders of magnitude weaker and could be distinguished above the noise level only after increased acquisition time. This is due to the fact that the CT bands of RhG4OH have poor overlap with the laser excitation line 244 nm (Figure 4b) resulting in a weaker resonance effect than for PtG4OH. For both PtG4OH and RhG4OH, we observed enhancement for neither the Amide I mode, nor the modes characteristic of ν(NC3) symmetric stretching for tertiary amines of the dendrimer. Thus the reso-nance Raman spectrum identifies structure (1) in Scheme 1 as the most probable for both metals since this explains the selec-tive enhancement for two coupled vibration motions: Amide II (1565 cm-1) and H-N-CR/C (1440 cm-1).
Previous EXAFS data showed the presence of nitrogen atoms of PAMAM amide or amine groups in the first coordination sphere of platinum cations.11The presented resonance Raman data are direct evidence that the charge-transfer band at 260 nm is attributed to electron transition between platinum cations and Figure 6. FTIR-DRIFT spectra of PtG4OH and RhG4OH heated in aflow of O2(2.5°C/min.) (a) Three-dimensional spectra of PtG4OH. (b) The
change in intensities for characteristic bands: N-H ((), C-H (b), and Amide I þ Amide II (2). (c) Three-dimensional spectra of RhG4OH. (d) The change in intensities for characteristic bands: N-H, C-H, and Amide I þ Amide II.
nitrogen of amide groups of the dendrimer. It should be noted that Raman spectra in H2O for (Pt2þ)40G6OH before and after treatment with BH4-are identical (Figure 4c). The laser beam (244 nm) induces partial photodecomposition of PtG4OH system and evolution of carbon monoxide, as inferred from the appearance of a band at 2143 cm-1.
We assume that during complexation, the dendrimer acts as three-dimensional (3D)-multidentate ligand, interacting with Pt2þvia two or more Pt2þr N(amide) coordination bonds, and the strongly stabilizing chelate effect and corresponding entropic factor hinder reduction of Pt2þby BH4- inside the three-dimensional PAMAM. Our data suggest the formation of three types of Pt compounds: mononuclear Pt2þcoordination compounds, binuclear Pt2þ-Pt2þand/or Pt4clusters and Ptn nanoparticles (Scheme 2). The Pt colloids are formed largely on the surface of dendrimers due to reduction of weakly bonded Pt2þ coordinated to the surface OH end-group, whereas the internal Pt2þions are stabilized via the aforementioned chelate effect. Reduction of Pt2þ cations supported on or in the dendrimer by BH4-or by H2is described by eq 1 ðPt2þÞ nG4OH s
f
BH4-=H2 ðPt2þÞG4OH þ ðPt2þÞ 2G4OHþ ðPt0ÞmG4OH ð1ÞThe results from several experimental techniques support this hypothesis. For example a large amount of mononuclear Pt2þ remaining after NaBH4reduction has been shown by UV-vis spectroscopy8 and present work, XPS spectroscopy8,3 and Raman spectroscopy (present work), and a small amount of
Pt2þ-Pt2þ(and tetramers) by EXAFS11and UV-spectroscopy [ ref 9 and present work]. The presence of Pt-colloids was detected by TEM,8XPS,8,3and EXAFS.11
Thermal Degradation of PAMAM-Capped Pt and Rh Par-ticles in O2 and H2 Environments. Thermal degradation of amide-containing polymers is a widely studied subject and the thermal stability of G4OH and PtG4OH has also been considered.13Recently we utilized spectroscopic techniques to monitor the thermal degradation of poly(vinylpyrrolidone) (PVP) on Pt and Rh nanocrystals.6,7 It was found, that PVP transforms into a“polyamide-polyene”-like material near 300 °C due to dehydrogenation of the aliphatic units of the backbone. Our hydroxyl-terminated, poly(amidoamine) dendrimer also possesses amide groups, but its tertiary amine functionalities and its hyperbranched structure set it apart from PVP and may cause it to undergo thermal degradation by unique pathways.
The empirical assignment of IR bands of pure G4OH is summarized in Table 1. Our assignments are informed by the interpretation of infrared spectra of polyamides, the recent anal-ysis of G4OH vibrational spectra, and theoretical calculations of the vibrational spectrum of trimethyl amines.14
The specific assignment of bands in the region 3000-2800 cm-1 is hampered by the fact, that in the dendrimer there are four types of methylene groups whose stretching vibrations overlap. Since the number of CH2groups adjacent to a terminal OH is relatively small, the most intense bands in the IR spectra are assigned toνsymandνas modes of CH2 groups adjacent to tertiary amines, to carbonyl groups and to amides (Scheme 2). The ATR-FTIR spectra of G4OH, PtG4OH, and RhG4OH (drop-castfilms on Ge prism) in Figure 5a show substantial differences. The absorption bands of N-H/O-H in the range of 3500-3000 cm-1in Pt and Rh compounds are very strong in comparison with the AmI and AmII bands in pure G4OH, probably due to contribution from H-bonded water. The ratio of band intensities for AmI/AmII in G4OH and RhG4OH is different from PtG4OH. This is an indication of different secondary structure of capping dendrimers in RhG4OH and PtG4OH. Interestingly, the structure of the capping stabilizer in RhG4OH is the same as in pure dendrimer, so this difference in structure must be ascribed to the ionic nature of the platinum inside the dendrimer. Thermal Degradation of the Pure Dendrimer.The effect of heating on the spectrum of G4OH in the region 3700-2500 cm-1is depicted in Figure 5b. A comparison of the spectra at 40 and 270°C reveals a decrease of the intensity of the band at 3505 cm-1corresponding to the desorption of water and the emergence of the O-H stretch of hydroxyl-end group at 3374 cm-1that was initially shielded by the water band. Also, Figure 5c,d clearly show the disappearance of bands of νsym -(CH2) at 2824 cm-1andνas(CH2) at 2971 cm-1. Polyamides are known to undergo thermally induced hydrogen abstraction at the methylene group adjacent to the amide nitrogen atom.15The subsequent hydrogen elimination from the amide nitrogen results in the formation of unsaturated bonds. The decrease in absorption bands at 2824 and 2971 cm-1is accompanied by the decrease of intensities of N-H bands and the rise of new, intense Figure 7. (a) FTIR spectra of PtG4OH heated in aflow of oxygen
(2.5 °C/min) at three temperatures: RT-30, 230, and 350 °C. (b) Absorption bands AmI and AmII of G4OH (black) and PtG4OH (red) upon heating in H2at 30 and 200°C.
bands in the region 1605-1620 cm-1, which may be attributed to the CdN stretching vibration (Scheme 3), is evidence of such dendrimer dehydrogenation.
Effect of the Rh and Pt on Dendrimer Decomposition.The effect of heating PtG4OH and RhG4OH in oxygen flow is shown in Figure 6. The 3D presentations of FTIR-DRIFT spectra show the decline of band intensity with rising the temperature due to the fragmentation of the dendrimer into volatile compounds.16 The appearance of CO2bands at 2349 and 667 cm-1indicates considerable oxidation of the capping dendrimer above 150°C (Figure 6a,c). As can be seen in Figure 6b,d, the broad band in the region of NH/OH stretching vibrations (3100-3500 cm-1) decreases starting from 50 °C resulting from the evaporation H-bonded water. Above 100°C, we assume that the tempera-ture-dependent change of the integral intensities of absorption bands (NH, CH, AmI, and AmII) with increasing temperature reflects a change in the quantity of this characteristic group. However, we still must take into account the results of previous TGA studies,16which showed that the mass of thermally treated PAMAM dendrimer monotonically decreases with temperature. Therefore we do not infer that the relative rise of C-H absorption bands seen for PtG4OH in O2is due to an increasing concentration of C-H bonds, but rather that the reaction results in stronger C-H transition dipole moments. The mechanism of thermal degradation of G4OH-capped Rh particles (Figures 6c,d) is complex, but it is evident that decay of G4OH starts from dehydrogenation of amide N-H bond as for the pure dendrimer, and above 350 °C the particles are finally left covered with carbonaceous polyamide-polyene-like material, which is similar
to what we have seen for PVP.6,7Additionally, at 150°C bands at 2070, 1950, and 1795 cm-1arise in spectra of RhG4OH. These bands are characteristic of the CO stretch of carbon monoxide adsorbed on the rhodium nanoparticle surface. The presence of three bands is explained by the existence of three distinct adsorp-tion sites: the atop, bridging, and 3-fold sites. The rhodium nano-particle evidently catalyzes the decarbonylation of the dendrimer, leading to its fragmentation. It is surprising to witness the adsorbed carbon monoxide in the presence of oxygen, because under these conditions, CO should be oxidized to form CO2.
In hydrogen, the degradation of RhG4OH generally follows the same trend as in oxygen. However, the decomposition of PtG4OH in hydrogen, shown in Figure 7a, is different from the degradation of RhG4OH, and it is distinct from the degradation of PtG4OH in oxygen and nitrogen. Figure 7b shows the differences between the room temperature spectra of the pure G4OH dendrimer and PtG4OH at 30 and 200°C. The ratio of the Amide I to the Amide II band at 30°C is 1.1 for G4OH and 1.2 for RhG4OH (not shown). For the PtG4OH, the ratio is 0.87, suggesting that the interaction with platinum cations prevents the dendrimer from assuming the“relaxed” secondary structure of the pure dendrimer. Upon reaching 150 °C in hydrogen this ratio increases and approaches that of the pure Figure 8. (a) Time-dependent spectra of PtG4OH irradiated in O2environment. (b) PtG4OH irradiated in H2environment. (c) RhG4OH irradiated
in hydrogenflow for 0, 180, 1200 min and (d) RhG4OH irradiated in argon flow for 0, 180, 1200 min. Scheme 5
dendrimer. Evidently, the PtG4OH in a reducing atmosphere undergoes a rearrangement of its secondary structure, but this rearrangement is seen in neither inert nor oxidizing atmospheres. These FTIR results show that platinum cations strongly bonded with more than one amide group in the dendrimer, serve to cross-link the dendrimer branches and constrain the dendrimer secon-dary structure. Their reduction and aggregation generates Pt0n nanoparticles, which weakly interact with fewer number of amide groups and therefore constrain of dendrimer secondary struc-ture reduced.
Photodecomposition of G4OH, PtG4OH, and RhG4OH.A routine procedure used to activate metallic nanoparticle catalysts is the redox cycling treatment of the catalysts in H2 and O2 environments at elevated temperatures. This may induce changes in the electronic structure of metallic atoms or the surface area accessible to reactants, or it may lead to aggregation of nano-particles. The photochemical degradation of poly(amidoamine) stabilizer of metallic Pt and Rh nanoparticles at low temperatures is a promising option for removing or modifying capping agents.4 In solution, Pt2þcations under UV-irradiation were transformed into small Ptn clusters stabilized with PAMAM
17
or other polyamide capping agents.18The photodegradation of capping PAMAM and“photoetching” of polyamide carbonaceous ma-terial on the surface of nanoparticles may increase the accessible surface area of metallic colloids for reactants. In this paper, we report our study of photochemical degradation for pure G4OH and Pt- and Rh-dendrimer systems in ozone-rich atmosphere as well in H2and Ar environments.
We studied the effects of photochemical reaction (irradiation by low pressure Hg-lamp) in different atmospheres, the effect of
“dark” oxidation of PtG4OH and RHG4OH by O3(ozonolysis) and the influence of Pt and Rh nanoparticles on photodegrada-tion of capping dendrimer. The PAMAM dendrimer evidently undergoes very different degradation reactions under UV irradia-tion compared to thermal treatment.
Photolysis of PtG4OH and RhG4OH in O2, H2, and Ar Environments.The photolysis of PAMAM-capped Pt and Rh nanoparticles as well as pure dendrimer G4OH and G6OH in different atmospheres supplies information on the most effective conditions for the removal of the organic capping agent, the influence of metallic particles on photochemical reactions, and the relative contribution of photolysis and ozonolysis to degrada-tion. The UV photodegradation was monitored with FTIR spectroscopy, which shows the structural changes of the den-drimer. As in the thermal degradation experiments, we assume that the time-dependent decrease of absorption band intensities reflects the decreasing amount of the capping layer of G4OH, but gravimetric methods are necessary to verify this assumption, since some new carbonaceous material may have very weak IR absorbance.
The main photochemical reaction of polyamides is known to be the Norrish reaction, in which conversion of free radicals forms a few stable products (Scheme 4).19
The time-dependent FTIR spectra of PtG4OH UV-irradiated in O2 and H2 media are presented in Figure 8. In this case, samples were subjected to both UV light (largely 254 nm) and a mix of ozone and molecular oxygen generated by reaction of O2 under deep UV light. The intensity of IR bands gradually decreases with increasing irradiation time, and new bands appear in the spectra of PtG4OH at 2230, 2030, and 1820 cm-1. Figure 9. (a) Influence of the joint action of UV light (photolysis) and ozonic environment (ozonolysis) on Amide I and Amide II bands of PtG4OH. (b) The previous spectra were normalized to intensity of Amide I. (c) Ozonolysis of PtG4OH. (d) Effect of ozone-rich environment on characteristic bands for NC3group of PtG4OH tertiary amine.
The new bands reflect the photocatalytic effect of platinum on the formation of nitrile band at 2230 cm-1and carbon monoxide (2030, 1820 cm-1) that adsorbs onto platinum. It should be noted that initially only the CO band for linear structure appears, and after 20 min CO modes of bridging structures can be seen (Figure 10c,d). While the formation of nitrile end groups is more evident in oxygen, the formation of bridging CO modes is more visible inflowing hydrogen. We also observe that as the radiation time increases, the AmI/AmII ratio of intensities for PtG4OH changes and become similar to the ratios for pure G4OH. We believe that the“relaxed” dendrimer 3D structure is also restored under illumination in O2and H2as a result of the reduction of platinum ions and formation of nanoparticles. Further evidence for nanoparticle formation comes from the appearance of a bridging CO band at 1816 cm-1in the spectrum of PtG4OH (Figure 8a). The formation of Ptn nanoparticles under UV irradiation in solution is well established from Pt2þand Pt4þ ions.17,18In comparing the UV light-induced decomposition of the pure dendrimer in oxygen and hydrogen, it is apparent that the presence of oxygen accelerates the decomposition. At the same time, decay of PtG4OH in O2and H2do not significantly differ (Figure 10a,b). Figure 10b, which illustrates the decom-position of the CH, NH, and combined AmI and AmII chemical groups in the dendrimer, shows that the catalytic effect of platinum in hydrogen serves to attack the amide groups but not the CH groups. The representative spectra of time-depen-dent photodecomposition of RhG4OH in hydrogen and argon flow are presented in Figure 8c,d. It is evident that photode-gradation of capping G4OH in hydrogen and argon atmosphere proceeds at approximately the same rate which indicates the major role in decomposition is that of UV-light and the minor role that of reactive media such as H2.
“Dark” Reactions of PtG4OH, RhG4OH and G4OH with Ozone.We studied the“dark” reaction to discriminate between the effect of UV light (photolysis) and the effect of reactive
media, for example, a mix of O2 þ O3 (ozonolysis), on the decomposition of the dendrimer stabilizer. The effect of ozone on G4OH was studied in the same photoreactor but the samples were shielded from direct UV light as described in Experimental Section. As follows from comparison of photodegradation of G4OH and PtG4OH in (O2 þ O3) with “dark” ozonation, photolysis is the major process. The reaction mechanism for ozone with amines and amides has been investigated.20 It was proposed that in the initial stage the ozone molecule forms an adduct with the tertiary amine group, which may decompose immediately into a nitroxyl radical (a) or into an aminium cation-radical (b) (Scheme 5).
If ozone attacks the nitrogen atom of tertiary amines, vibration bands for NC3fragment must be sensitive to interaction NC3 with O3. Recently it has been shown that IR active absorption bands at 1040 cm-1(νasNC3)e and at 830 cm-1(νsNC3)a1are attributed to vibration modes of the NC3 group in tertiary amines.12,14 As can be seen in Figure 9a,b, the bands of AmI, AmII and the bands at 1030 cm-1, 916 cm-1are very sensitive to the simultaneous effect of UV light and gaseous environment, but in “dark” conditions (Figure 9c) ozone attack of amide group is barely noticeable. Instead, the spectra indicate a major change only in bands associated with the tertiary amine group (Figure 9d). This result is in agreement with proposed mechan-ism for initial stage of ozone attack of tertiary amines.20The effect of UV light (mainly 254 nm) and reactive environments on some characteristic absorption bands of dendrimer presented in Figure 10. As can be seen in Figure 10a intensity of N-H, C-H and AmI, AmII bands of PtG4OH changed drastically in Ar atmosphere during thefirst 90 min and then the rate of decay decreases, which shows the dominant role of light (over ozone) in the photodegradation of dendrimer. The kinetic curves for the decay of G4OH and PtG4OH in hydrogen take the same initial shape (Figure 10b). The kinetic curves in the case of “dark” ozonolysis on the other hand are more linear and show only a Figure 10. The change of relative intensities of N-H ()), C-H (O), and sum of AmI þ AmII (4) band during joint action of photolysis and ozonolysis and only“dark” ozonolysis. (a) PtG4OH exposed to UV irradiation in argon. (b) PtG4OH (black closed symbols) and G4OH irradiated in hydrogen. (c) RhG4OH irradiated in oxygen and“dark” ozonation. (d) PtG4OH irradiated in oxygen and “dark” ozonation (black closed symbols).
weak slope during thefirst 90 min on degradation of RhG4OH and PtG4OH (Figure 10c,d). The “two-slope” shape of the kinetic curves in the presence of light shows that for thefirst 90 min decay is dominantly photolytic in nature, and afterward ozonation is the primary actor (in oxygenflow). At the beginning of UV treatment of RhG4OH in an ozone-rich atmosphere (Figure 10c) light generates free radicals that interact with ozone molecules. In this period of time, photolysis and ozonolysis reaction may be considered coupled reactions, since they have a joint intermediate.21In addition, a study of thin and thick layers of Pt and RhG4OH nanoparticles showed that only for thin layers of nanoparticles was extensive photolytic cleaning observed in an oxidative environment. We suspect that the reason for the drop in photodecomposition rate is the formation of light-protective layer on the surface capping agent, which strongly absorbs UV light, for example, polyamide-polyene material. From the slope of kinetic curves for 0-60 min, we estimate that ratio of rates for photolysis and“dark” ozonolysis Whv/WO3was∼40.
’ CONCLUSIONS
In this paper, we show that Pt2þcations in PtG4OH strongly bonded to amide nitrogen atoms, which form a coordination sphere around platinum with a strong stabilizing chelate effect, which accounts for the resistance of platinum to reduction by sodium borohydride. The diffuse-reflectance UV-vis spectra reveal the formation small Pt clusters, whose spectroscopic signature resembles platinum-blue binuclear and tetranuclear linear clusters. A spectroscopic study of thermal and photoche-mical decay of the capping stabilizer G4OH shows different mechanisms of stabilizer degradation. Initially photolysis and ozonolysis of capping agent are coupled, simultaneous reactions with a ratio of rates, photolysis/dark ozonolysis∼ 40.
Notes
)
On leave from the Department of Chemistry, Kamil Ozdag Science Faculty, Karamanoglu Mehmetbey University, 70100 Karaman, Turkey.
’ ACKNOWLEDGMENT
We are truly grateful to Professor Herbert L. Strauss for his valuable advice and help during the preparation of this paper. This work was supported by the Director, Office of Science, Office of Basic Energy Sciences, U.S. Department of Energy under Contract No. DE-AC02-05CH11231.
’ REFERENCES
(1) (a) Astruc, D.; Chardac, F. Chem. Rev. 2001, 101, 2991. (b) Crooks, R. M.; Lemon, B. I., III; Sun, L.; Yeung, L. K.; Zhao, M. Top. Curr. Chem. 2001, 212, 81. (c) Knecht, M. R.; Weir, M. G.; Myers, V. S.; Pyrz, W. D.; Ye, H.; Petkov, V.; Buttrey, D. J.; Frenkel, A. I.; Crooks, R. M. Chem. Mater. 2008, 20, 5218.(d) Deutsch, D. S.; Williams, C. T.; Amiridis, M. D. Handbook of Catalyst Preparation; Regalbuto, J., Ed.; CRC Press: Boca Raton, FL, 2006; pp 209-235. (e) Deutsch, D. S.; Lafaye, G.; Liu, D.; Chandler, B. D.; Williams, C. T; Amiridis, M. D. Catal. Lett. 2004, 97 (3-4), 139.
(2) (a) Zhao, M.; Crooks, R. M. Angew. Chem., Int. Ed. 1999, 38, 364; (b) Adv. Mater. 1999, 11, 217.(c) Fanson, P. T.; Hirata, H.; Amiridis, M. D.; Williams, C. T.; Deutsch, D. S.; Siani, A.; Matsumoto, S. Supported Catalysts with Controlled Metal Cluster Size. U.S. Patent 7,582,586, Sept. 1, 2009. (d) Deutsch, D. S.; Lafaye, G.; Liu, D.; Chandler, B.; Williams, C. T.; Amiridis, M. D. Catal. Lett. 2004, 97, 139. (e) Singh, A.; Chandler, B. D. Langmuir 2005, 21, 10776.
(f) Witham, C. A.; Huang, W.; Tsung, C.-K.; Kuhn, J. N.; Somorjai, G. A.; Toste, F. D. Nature Chem. 2010, 2, 36.
(3) Huang, W.; Kuhn, J. N.; Tsung, C.-K.; Zhang, Y.; Habas, S. E.; Yang, P.; Somorjai, G. A. Nano Lett. 2008, 8 (7), 2027.
(4) Aliaga, C.; Park, J. Y.; Yamada, Y.; Lee, H. S.; Tsung, C. K.; Yang, P.; Somorjai, G. A. J. Phys. Chem. C 2009, 113, 6150.
(5) Borodko, Y.; Ager, J. W., III; Marti, G. E.; Song, H.; Niesz, K.; Somorjai, G. A. J. Phys. Chem. B 2005, 109, 17386.
(6) Borodko, Y.; Habas, S. E.; Koebel, M.; Yang, P.; Frei, H.; Somorjai, G. J. Phys. Chem. B 2006, 110, 23052.
(7) (a) Borodko, Y.; Humphrey, S. M.; Don Tilley, T.; Frei, H.; Somorjai, G. A. J. Phys. Chem. C 2007, 111 (14), 6288. (b) Borodko, Y.; Lee, H. S.; Joo, S. H.; Zhang, Y.; Somorjai, G.J. Phys. Chem. C 2010, 114, 1117.
(8) Knecht, M. R.; Weir, M. G.; Myers, V. S.; Pyrz, W. D.; Ye, H.; Petkov, V.; Buttrey, D. J.; Frenkel, A. I.; Crooks, R. M. Chem. Mater. 2008, 20, 5218.
(9) (a) Sakai, K.; Matsumoto, K. J. Mol. Catal. 1990, 62, 1–14. (b) Sakai, K.; Tanaka, Y.; Tsuchiya, Y.; Hirata, K.; Tsubomura, T.; Iijima, S.; Bhattachardjee, A. J. Am. Chem. Soc. 1998, 120, 8366. (c) Fedotova, T. N.; Aleksandrov, G. G.; Kuznetsova, G. N. Russ. J. Inorg. Chem. 2008, 53 (3), 372.
(10) (a) Siani, A.; Wigal, K. R.; Alexeev, O. S.; Amiridis, M. D. J. Catal. 2008, 257, 16; (b) J. Catal. 2008, 257, 5. (c) Weaver, J. H. Phys. Rev. B 1975, 11 (4), 1416. (d) Henglein, A.; Ershov, B. J.; Malow, M. J. Phys. Chem. 1995, 99, 14129.
(11) Alexeev, O. S.; Siani, A.; Lafaye, G.; Williams, C. T.; Ploehn, H. J.; Amiridis, M. D. J. Phys. Chem. B 2006, 110, 24903.
(12) Lee, S. H.; Krimm, S. Biopolymers 1998, 46 (5), 283. (13) Deutsch, D. S.; Siani, A.; Fanson, P. T.; Hirata, H.; Matsumoto., S.; Williams, C. T.; Amiridis, M. D. J. Phys. Chem. C 2007, 111, 4246.
(14) (a) Colthup, N. B.; Daly, L. H. Introduction to Infrared and Raman Spectroscopy; Academic Press: San Diego, CA, 1990. (b) Murphy, W. F.; Zerbetto, F.; Duncan, J. L.; McKean, D. C. J. Phys. Chem. 1993, 97, 581. (c) Goldfarb, T. D.; Khare, B. N. J. Chem. Phys. 1967, 46 (9), 3379.
(15) (a) Levchik, S. V.; Weil, E. D.; Lewin, M. Polym. Int. 1999, 48, 532.(b) Pielichowski, K.; Njuguna, J. Thermal Degradation of Polymeric Materials, Rapra Technology Limited: Shawbury, U.K., 2005. (16) Ozturk, O.; Black, T. J.; Perrine, K.; Pizzolato, K.; Williams, C. T.; Parsons, F. W.; Ratliff, J. S.; Gao, J.; Murphy, C. J.; Xie, H.; Ploehn, H. J.; Chen, D. A. Langmuir 2005, 21, 3998.
(17) (a) Luo, X.; Imae, T. J. Mater. Chem 2007, 17, 567. (b) Bai, L.; Zhu, H.; Thrasher, J. S.; Shane, C. S. ACS Appl. Mater. Interfaces 2009, 1 (10), 2304.(c) Zhu, H. Ph.D. Dissertation, University of Alabama, Tuscaloosa, AL, 2009.
(18) Einaga, H.; Harada, M. Langmuir 2005, 21, 2578.
(19) Braslavsky, S. E. Photochemistry, Pure Appl. Chem. 2007, 79, 375.
(20) (a) Baily, P. S. Ozonation in Organic Chemistry; Academic Press: New York, 1982. (b) Baily, P. S.; Keller, J. E. J. Organomet. Chem. 1968, 33, 2675. (c) Kazanskii, M. M.; Privalova, L. G.; Zaikov, G. Y. Polym. Sci. U.S.S.R. 1985, 27 (11), 2685. (d) Moore, R. F. Polymer 1963, 4, 493.
(21) Laidler, K. J. Chemical Kinetics; Harper Collins: New York, 1987.