Education and Science
Vol 43 (2018) No 193 289-315A National Comparison of Pre-service Elementary Mathematics
Teachers’ Beliefs about Mathematics: The case of Turkey
*Derya Çelik
1, Zeynep Medine Özmen
2, Serhat Aydın
3, Mustafa Güler
4,
Osman Birgin
5, Gökay Açıkyıldız
6, Kadir Gürsoy
7, Duygu Arabacı
8,
Gönül Güneş
9, Ramazan Gürbüz
10Abstract
Keywords
The aim of present study is to reveal pre-service elementary mathematics teachers’ (PEMTs) beliefs about mathematics in national perspective and to compare the regional differences. The sample of study was composed of 1418 PEMTs enrolled in 21 different universities as 4th year students in Turkey.
12 regions determined in Nomenclature of Territorial Units for Statistics (NUTS) Level 1 were considered during the selection of sample universities. As data collection tools, “beliefs about the nature of mathematics”, “beliefs about mathematics learning” and “beliefs about the achievement in mathematics” scales which were developed in TEDS-M study and contain a total of five factors were used. The collected data were analyzed to descriptive statistics, one-way ANOVA test using SPSS packet software. The findings indicated that PEMTs commonly have dynamic views toward nature of mathematics in the context of universities and regions. However, the static view representing the traditional aspect of mathematics also had a reasonably high percentile. Significant differences among universities and regions were determined in terms of beliefs about nature of mathematics, learning mathematics and mathematics achievement. To identify the possible reasons of the differences, it is suggested to carry out in-depth qualitative investigations to examine the variables such as courses and their contents, classroom applications in education faculties on the basis of universities and regions.
Pre-service elementary mathematics teachers Beliefs on nature of mathematics Beliefs on learning mathematics Beliefs on mathematics achievement Comparative educational research
Article Info
Received: 02.13.2017 Accepted: 01.23.2018 Online Published: 03.01.2018 DOI: 10.15390/EB.2018.7133* This study is supported by TÜBİTAK (Project No: 113K805).
1 Karadeniz Tech. University, Fatih Education Faculty, Dept. of Mathematics and Science Education, Turkey, [email protected]
2 Karadeniz Tech. University, Fatih Faculty of Education, Dept. of Educational Sciences, Turkey, [email protected]
3 Karamanoğlu Mehmetbey University, Faculty of Education, Dept. of Mathematics and Science Education, Turkey, [email protected]
4 Karadeniz Tech. University, Fatih Faculty of Education, Dept. of Mathematics and Science Education, Turkey, [email protected]
5 Uşak University, Faculty of Education, Dept. of Mathematics and Science Education, Turkey, [email protected]
6 Karadeniz Tech. University, Fatih Faculty of Education, Dept. of Mathematics and Science Education, Turkey, [email protected]
7 Karadeniz Tech. University, Fatih Faculty of Education, Dept. of Mathematics and Science Education, Turkey, [email protected]
8 Medipol University, Education of Faculty, Dept. of Mathematics and Science Education, Turkey, [email protected]
9 Karadeniz Tech. University, Fatih Faculty of Education, Dept. of Primary Education, Turkey, [email protected]
Introduction
With up-to-date education domain approaches, we are experiencing a transition from the question ‘What to teach?’, which traditional approach has long come up with, towards ‘How to teach.’ This transition paved way to emergence of pedagogical content knowledge in teacher education. Teachers expected to possess not only field knowledge but also pedagogic field knowledge (Baki, 2012; Ball, Thames, & Phelps, 2008; Shulman, 1986, 1987). Accordingly, the researchers have conducted studies to define the components of pedagogical content knowledge (Baki, 2012; Shulman, 1986, 1987; Ball et al., 2008). These studies have determined the type of knowledge that a teacher should possess. Certain researchers also referred beliefs towards mathematics among basic components of teaching knowledge (Baki, 2012; Fennema & Franke, 1992). Some studies emphasized that beliefs have substantial contribution on competences of mathematics teachers (Calderhead, 1996; Richardson, 1996). Fennema and Franke (1992) referred teacher beliefs towards mathematics as one of the principal components of teaching knowledge. Some other studies have underlined that teacher beliefs have an important role in their mathematics instruction (Ernest, 1991; Güven, Karataş, Öztürk, Arslan, & Gürsoy, 2013; Pajares, 1992; Philipp, 2007; Thompson, 1992). Moreover, teacher beliefs are also associated with mathematics achievement of students, which is the output of instruction (Campbell et al., 2014; Staub & Stern, 2002). Therefore, it seems that besides knowledge that teachers possess, beliefs also play an active role in planning, implementing and assessment processes of instructional activities and consequently they affect mathematics achievements of students (Baumert et al., 2010; Hill, Rowan, & Ball, 2005; Fennema & Franke, 1992; Lloyd & Wilson, 1998; Stein, Baxter, & Leinhardt, 1990; Van Dooren, Verschaffel, & Onghena, 2002).
There is not a mainly agreed definition for belief concept. Some researchers defined the concept rather from cognitive point of view (Thompson, 1992; Schoenfeld, 1985; Sigel, 1985). Some others, on the other hand take the issue in affective point of view (Furinghetti & Pehkonen, 2002; Richardson, 1996). By emphasizing the cognitive aspect of belief, Schoenfeld (1985) defined the belief as mental structures composed of human experiences and understanding. In another definition rather focusing affective aspects, Richardson (1996) defined the belief concept as understanding premises or propositions about the world that are held to be true. No matter whether it was handled with affective or cognitive point of view, the conducted studies clearly stated that there is a relation between teacher beliefs and their instructional decisions and finally student achievement (Carter & Norwood, 1997; Steinbring, 1998; Stipek, Givvin, Salmon, & MacGyvers, 2001; Thompson, 1992). Hereby, it is undeniable that teacher belief is one of the crucial factors on student achievement, effectiveness of instruction and teacher competences. This situation implies that beliefs of prospective teachers are important for their future instructions.
Likewise, knowledge and beliefs that pre-service teachers have are distinctive indicators of teacher training program they are instructed (Tatto et al., 2008). In this context, Maasepp and Bobis (2015) found that quality of lecturer and presented instructions have effects on alteration of mathematics beliefs of pre-service teachers. This shows that variety of factors like education provided to pre-service teachers in education faculties, approaches of education staff and instruction practices greatly affect pre-service teachers’ adopting beliefs supporting reforms in mathematics education.
Beliefs about Mathematics
When the literature is investigated, it can be said that beliefs about mathematics were generally investigated under three categories as; the nature of mathematics, learning mathematics and beliefs towards mathematics instruction (Ernest, 1989; Pajares, 1992; Pehkonen, 1997). Since they affect an individual’s thoughts about learning and teaching mathematics (Ernest, 1989; Pajares, 1992; Richardson, 1996; Wilkins & Brand, 2004), beliefs about the nature of mathematics have a central role in individual’s belief system. A large number of researchers have studied on beliefs about the nature of mathematics and they have suggested various theoretical frameworks to characterize these beliefs. Although these frameworks differently conceptualize beliefs about the nature of mathematics, they can be said to be more or less interrelated to each other (Liljedahl, Rolka, & Rösken, 2007). Ernest (1989) examined beliefs
that teachers possess about the nature of mathematics in three categories. These categories were instrumentalist, Platonist and problem solving view.
Dionne (1984) classified beliefs towards mathematics as; traditional, formalist and constructivist. Another conceptualization by Grigutsch, Raatz, and Törner (1998) emphasized four different orientations as; formalism related orientation, schema related orientation, process related orientation and application related orientation (as cited in Felbrich, Kaiser, & Schmotz, 2014). Formalism related orientation is rather similar to Platonist orientation by Ernest and formalist perspective by Dionne. This orientation perceives mathematics as a deductive discipline with an axiomatic system. Schema related orientation can be related to instrumentalist perspective by Ernest and traditional perception by Dionne. This perception assumes that mathematics consists of terms, rules and formulas. Process related orientation corresponds to problem solving by Ernest and constructivist perception by Dionne. This perception accepts mathematics as a discipline including problem solving processes and discovering its order and structure by itself. Application related orientation defines mathematics as a discipline which is closely related to society and life (Felbrich et al., 2014). Grigutsch et al. (1998) argued that these four orientations actually represent two perceptions. While formalism and schema related orientations include features to characterize mathematics as a static science, process and application related orientations conceptualize mathematics as a dynamic science (as cited in Felbrich et al., 2014).
Although beliefs have been differently classified in the perspective of mathematics teaching (Ernest, 1991; Handal, 2003; Kuhs & Ball, 1986), “teacher centered (traditional)” and “student centered (constructivist)” are two widely accepted perspectives. Teacher centered perspective assigns teacher the role of transferring mathematics knowledge to students. The perspective charges students with the role of attentively following the teacher’s instructions for the sake of success of transfer process. Student centered perspective, on the other hand, gives teacher the responsibility of preparing learning environments which provide students with the opportunity of constructing their own understandings (Tang & Hsieh, 2014).
Beliefs about learning mathematics are clearly interrelated to beliefs about teaching mathematics. Two principal perspectives of teaching mathematics named as teacher centered approach and student centered approach form a basis for two perspectives of learning which reflect to “learning is a passive accepting process” and “learning is an active constructing process” opinions respectively (Ernest, 1989, 1991). The view perceiving learning as an active construction process based on students’ construct their own knowledge, which complies with constructivist learning theory. Teachers holding this perspective assume learning mathematics as a dynamic research process (Prawat, 1992) and value problem solving (Ball, 1993). On the other hand, the perspective which refers learning as a passive acquiring process adopts a point of view reflecting traditional approach, which gives teacher the central role of learning process and suggests direct transfer of mathematics knowledge to students.
When beliefs are considered in terms of mathematics achievement, competences which individuals possess have an important role. Beliefs based on competences are divided into two categories as; “mathematics is a fixed ability” and “mathematics is an ability that can be improved” (Stipek et al., 2001). For the former view mathematical talent is stable and it hardly changes. This perspective mainly carries the thought that all efforts sacrificed for achievement cannot exceed a certain level. Contrary, the second perspective emphasizes that mathematical talent can be improved when an appropriate environment is provided (Tang & Hsieh, 2014).
When the national literature is reviewed, there have been number of studies associated with teachers’ or pre-service teachers’ beliefs about mathematics (Aksu, Engin Demir, & Sümer, 2002; Boz, 2008; Çakıroğlu, 2008; Dede & Karakuş, 2014; Eryılmaz Çevirgen, 2016; Haser & Doğan, 2012; Güven, Öztürk, Karataş, Arslan, & Şahin, 2012; Kayan, Haser, & Işıksal Bostan, 2013; Toluk Uçar & Demirsoy, 2010). For instance, Kayan et al. (2013) investigated beliefs of 584 pre-service mathematics teachers registered to 3rd and 4th years of their studies in 10 different universities and compared the pre-service
school year variables. The study revealed that for gender variable, there was a significant difference in beliefs favoring female pre-service teachers. There was no significant divergence in beliefs about mathematics with respect to school year variable. Haser and Doğan (2012) conducted a study to state the effects of courses in teacher training program on pre-service teachers’ belief systems. The results of the study indicated that pre-service teachers possess beliefs that can be classified as: formal and personal. Through the study, while formal beliefs of the pre-service teachers did not change much, there were significant changes in personal beliefs. Similarly, Dede and Karakuş (2014) aimed to determine effect of the curriculum on beliefs about mathematics of sampled 173 pre-service teachers. The results of the study showed that there was not a significant difference between the beliefs of 1st grade and 4th
grade university students. Toluk Uçar and Demirsoy (2010) designed a study with 3 mathematics teachers in order to define the relations between teachers’ beliefs and classroom implementations (course activities). The study results indicated certain inconsistencies between teachers’ beliefs about mathematics and their instructional implementations. Although the two of sampled three teachers had
non-traditional or close to non-traditional level belief about mathematics, all three teachers carried out their
instructions just in a traditional way. This situation states the inconsistency between teacher beliefs and instructional implementations. Çakıroğlu (2008) compared beliefs of pre-service teachers’ in Turkey and in the USA about effectiveness of mathematics education. The study was performed with 141 pre-service teachers from Turkey and 104 from the USA. The results indicated that Turkish pre-pre-service teachers tend to have a stronger belief that teaching can influence student learning compared to the Americans.
Teacher training programs are responsible for establishing the mathematics knowledge of teachers. The effects of teacher training programs on mathematics teaching knowledge of pre-service teachers, on beliefs about mathematics learning-teaching is a necessary and important study (Brouwer & Korthagen, 2005; Kleickmann et al., 2013). it seems impossible to teach mathematics at schools at an intended level without improving teacher competences (Baki, 2008). When the national literature of Turkey reviewed in terms of beliefs about mathematics, it can be said that previous studies in the field have been mainly clustered around; the relations between beliefs of pre-service teachers and certain variables (Kayan et al., 2013), the effect of teacher training program on beliefs of pre-service teachers (Dede & Karakuş, 2014; Haser & Doğan, 2012), the relations between beliefs of teachers and their classroom applications (Toluk Uçar & Demirsoy, 2010). The mentioned literature review did not yield any studies on PEMTs’ beliefs about mathematics providing a general glimpse of Turkey with a large sample and national comparisons. In this sense, it is important to investigate beliefs of pre-service teachers from different regions and different universities about the nature of mathematics, teaching mathematics and mathematics achievement with a large sample. Furthermore, comparing the beliefs of pre-service teachers from different universities and regions in Turkey towards mathematics is required for the sake of reviewing and consolidating the present state of teacher competences, mathematics teacher training policies and reforms. In this context, the aim of present study is to compare mathematics beliefs of PEMTs in national and regional scale. In the pursuit of this aim, the answers for the following questions were sought;
a) How do PEMTs’ beliefs about the nature of mathematics differ with regards to university they are educated and regions they are situated in Turkey?
b) How do PEMTs’ beliefs about learning mathematics differ with regards to university and regions in Turkey?
c) How do PEMTs’ beliefs about mathematics achievement differ with regards to university and regions in Turkey?
Method
This research is intended to compare PEMTs’ beliefs about mathematics through the universities in Turkey. Due to the beliefs of pre-service teachers were analyzed at at only one point in time, cross-sectional survey method was adopted into this study (Olsen & George, 2004). As a matter of fact this method is particularly appropriate for studies performed with large groups and appropriate to describe feelings, thoughts, opinions and attitudes of certain groups about a phenomenon or a case (Karasar, 2005).
Sample
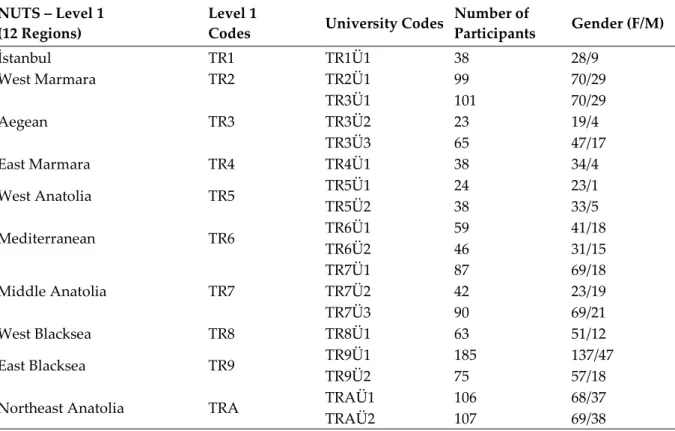
The sample of the study was composed of 1431 PEMTs (1418 after the application of data reduction procedure) registered to their 4th year at 21 universities which were selected considering Level
1 classification of the Nomenclature of Territorial Units for Statistics (NUTS) with stratified sampling method. Under the title of Nomenclature of Territorial Units for Statistics (NUTS), Turkey is divided 12 sections in Level 1, 26 sections in Level 2 and 81 sections in Level 3 (Turkish Statistical Institute, 2015). By these classifications a reference system presenting the socio-economic structure of Turkey was formed. Considering that education is a socio-cultural-economic entity, this classification was decided to be used in the selection process of the sample universities. After forming NUTS regions, Turkish Statistical Institute announced that they would process all data and information based on Nomenclature of Territorial Units for Statistics and statistical data of all scientific studies can only be accessed in NUTS regions levels (Taş, 2006). This is an indicator of that in the future units for statistics presented based on region levels will be more effective in education policies and other fields. Backed with all these grounds, it was decided Level 1 classification to be used as a framework for this study. In addition, the fact that there were not universities with education faculty in each 26 of the regions in Level 2 directed us to choose Level 1. In this study the level of regions were coded as (TR1, TR2, TR3, …., TR9, TRA, TRB and TRC). The universities situated in these regions; for example the universities in TR7 region were coded as TR7Ü1, TR7Ü2 and TR7Ü3. The demographics data of the sample pre-service teachers were summarized in Table 1.
Table 1. Participants’ Demographics Summary NUTS – Level 1
(12 Regions) Level 1 Codes University Codes Number of Participants Gender (F/M)
İstanbul TR1 TR1Ü1 38 28/9 West Marmara TR2 TR2Ü1 99 70/29 Aegean TR3 TR3Ü1 101 70/29 TR3Ü2 23 19/4 TR3Ü3 65 47/17 East Marmara TR4 TR4Ü1 38 34/4 West Anatolia TR5 TR5Ü1 24 23/1 TR5Ü2 38 33/5 Mediterranean TR6 TR6Ü1 59 41/18 TR6Ü2 46 31/15 Middle Anatolia TR7 TR7Ü1 87 69/18 TR7Ü2 42 23/19 TR7Ü3 90 69/21 West Blacksea TR8 TR8Ü1 63 51/12 East Blacksea TR9 TR9Ü1 185 137/47 TR9Ü2 75 57/18
Table 1. Continued NUTS – Level 1 (12 Regions)
Level 1
Codes University Codes
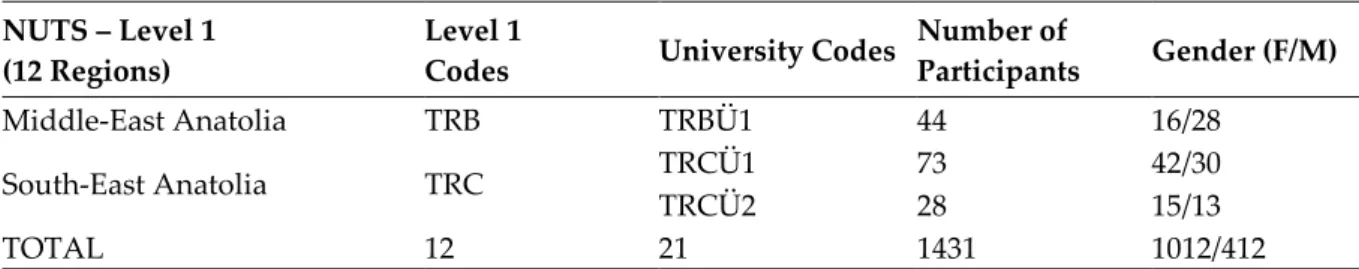
Number of Participants Gender (F/M) Middle-East Anatolia TRB TRBÜ1 44 16/28 South-East Anatolia TRC TRCÜ1 73 42/30 TRCÜ2 28 15/13 TOTAL 12 21 1431 1012/412
* 7 participants did not state their gender.
Data Collection Tools
This study was undertaken of a TÜBİTAK project which was led by the first author. “Beliefs about Mathematics” scales were used as data collecting tool in this study. The scales were formerly developed in Teacher Education and Development Study in Mathematics (TEDS-M, Tatto et al., 2012) study and the necessary permissions were taken in order to use them in the project. Adaptation of the scales into Turkish and the study of validity and reliability were introduced in detailed in the doctoral dissertation of Aydın (2014) which is one of the outcomes of the project. In this study, “beliefs about the nature of mathematics”, “beliefs about learning mathematics” and “beliefs about mathematics achievement” scales were used. The belief scales about the nature of mathematics, learning mathematics and mathematics achievement have 5 factors, 2 of which are positive cases in terms of contemporary learning theories and the remaining 3 are negative. The positive factors are mathematics is a process of
inquiry and mathematics is learned through active involvement and the negative factors are mathematics is a set of rules and procedures, mathematics is learned through following teacher direction and mathematics is a fixed ability. Each of the scales is 6-choice Likert-type with choices “Strongly disagree”, “Disagree”, “Slightly
disagree”, “Slightly agree”, “Agree”, and “Strongly agree”. The scales and information about their sub-factors were summarized in Table 2.
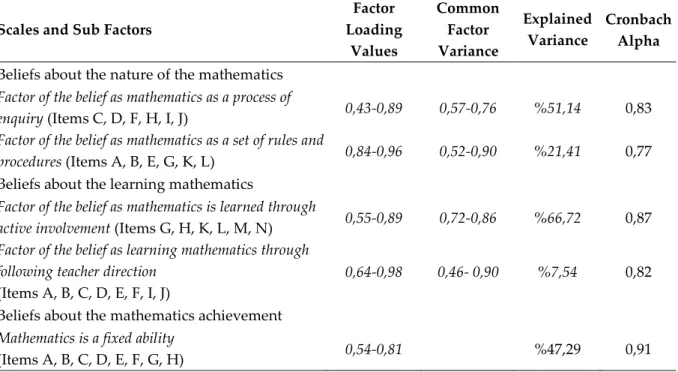
Aydın (2014) has applied exploratory factor analysis (EFA) and confirmatory factor analysis (CFA) to test reliability of the beliefs scales (Table 2). As the result of the EFA for the beliefs about the nature of the mathematics scale, it was seen that the factor loading values were varied between 0.43 and 0.93, items of the scales were collected under two main factors, and it explained the 72.6 % of the total variance. As the result of the EFA for the beliefs about learning mathematics scale, it was seen that the factor loading values were varied between 0.55 and 0.92, items of the scales were collected under two main factors, and it explained the 74.3 % of the total variance. As the result of the EFA for the beliefs about mathematics achievement scale, it was seen that the factor loading values were varied between 0.54 and 0.81, items of the scales were collected under one main factor, and it explained the 47.3 % of the total variance. As the result of the CFA for the beliefs about the nature of the mathematics scale, the fit indices values were calculated as χ2=118.71 (p=.000), χ2/sd=5.93, RMSEA=.010, GFI= 0.80, AGFI=0.88, CFI=0.89, NNFI=0.94. For the beliefs about learning mathematics scale, CFA fit indices values were calculated as χ2=60.71 (p=.000), χ2/sd=3.47, RMSEA=.09, GFI=0.83, AGFI=0.86, CFI=0.94, NNFI=0.91. For the beliefs about mathematics achievement scale, CFA fit indices values were calculated as χ2=40.35 (p=.000), χ2/sd=2.01, RMSEA=.07, GFI=0.92, AGFI=0.86, CFI=0.95, NNFI=0.93. While confirmatory factor analysis results had indicated that the original factor structure of each scale confirmed in low degree or had values close to the acceptable level in Turkish culture context, explanatory factor analysis results clearly validated the original factor structure. The items disturbing the model fit with regards to the results of confirmatory factor analysis, in other words items with low item-latent variant (factor) correlation and items with high error variation were reconsidered and reorganized. Since the results of the explanatory factor analysis fully fitted the original factor structures of the scales it was decided not to exclude any of the items but just to review certain items (Aydın, 2014). As the beliefs about mathematics scales were Likert type, Cronbach Alpha coefficient was determined for the scale itself and its sub-factors to test the reliability of the measuring. The obtained data were presented in Table 2.
Table 2. Reliability Coefficients and Factor Load Values of Beliefs about Mathematics Scales Scales and Sub Factors
Factor Loading Values Common Factor Variance Explained Variance Cronbach Alpha
Beliefs about the nature of the mathematics
Factor of the belief as mathematics as a process of
enquiry (Items C, D, F, H, I, J) 0,43-0,89 0,57-0,76 %51,14 0,83
Factor of the belief as mathematics as a set of rules and
procedures (Items A, B, E, G, K, L) 0,84-0,96 0,52-0,90 %21,41 0,77
Beliefs about the learning mathematics
Factor of the belief as mathematics is learned through
active involvement (Items G, H, K, L, M, N) 0,55-0,89 0,72-0,86 %66,72 0,87
Factor of the belief as learning mathematics through following teacher direction
(Items A, B, C, D, E, F, I, J)
0,64-0,98 0,46- 0,90 %7,54 0,82
Beliefs about the mathematics achievement
Mathematics is a fixed ability
(Items A, B, C, D, E, F, G, H) 0,54-0,81 %47,29 0,91
As seen in Table 2, the reliability values of three belief scales and their 5 factors were between 0.77 and 0.91. There are different reports about the acceptable values of alpha, however, for social sciences 0.70 is accepted as sufficient while 0.90 or greater is high (Şeker & Gençdoğan, 2006). Referencing that criteria, the reliability rates of the factors belong to the belief scales were at sufficient, high and very high levels. Therefore, it could be said that the measurements obtained from the belief scales are reliable.
Data Analysis
Within the scope of this study, the data gathered from 1418 PEMTs were analyzed using SPSS packet software. Since the findings and results obtained from the participant countries by “Beliefs about the Nature of Mathematics Scale”, “Beliefs about Learning Mathematics Scale” and “Beliefs about Mathematics Achievement Scale” had been presented in detail in the report released after TEDS-M study. In order to display the results comparable the data obtained from these three scales in the present study, data was analyzed through the framework followed in TEDS-M project. Based on this analysis manner, each participant’s scores for two positive and three negative totally five factors in these three scales were calculated separately. When belief scores of the pre-service teachers for one of these factors calculated, negative answers; “Strongly Disagree”, “Disagree”, “Partially Disagree” and “Partially Agree” were valued as “0”and positive answers; “Agree” and “Strongly Agree” were assigned as “1”. The arithmetic mean of the scores of the answers given by a pre-service teacher in a particular factor represents the pre-service teacher’s belief score for that factor. When belief score of a particular university was determined the arithmetic average of all pre-service teachers in that university was calculated. Likewise, in order to figure out belief score of a particular region, the arithmetic average of all pre-service teachers in that region was calculated. Based on these calculations the percentile equivalents of these average belief scores were determined for universities, regions and Turkey-wide respectively.
Overall belief score of a factor for Turkey was determined with the arithmetic average of the scores of 1418 PEMTs from 21 different universities. In order to monitor the divergence of the student answers, besides arithmetic average, standard deviations were also calculated for any particular scale in university, region and nationwide levels. Certain statistical tests were carried out to check whether the differences among the regions were significant. For this purpose, normality of distribution of beliefs about mathematics and the related groups were examined in the first place. It was observed that most of the groups showed normal distributions in beliefs about mathematics. The skewness values were
checked for the groups that were identified as having non-normal distribution by normality tests. That skewness value is between -1 and +1 is a criterion to make assumption that groups have normal distribution (Büyüköztürk, 2009). In this sense, it was determined that all groups verified at least one of these requirements. In order to test whether there were differences among the different regions ANOVA test, which provides opportunity to compare more than two groups, was applied. When there was a significant difference between the groups, Post-Hoc analyses were conducted. Before this analysis, homogeneity of the variances was tested by Levene Test. If Levene test showed that the variances were homogeneous (i.e. p>.05), multiple comparisons were made with Tukey test, if the variances were not homogeneous (i.e. p<.05) Tamhane’s T2 test results were checked.
Findings
Findings Related to PEMTs’ Beliefs about Mathematics
Beliefs of the pre-service mathematics teachers about the nature of mathematics examined in two dimensions as; “Mathematics is a process of inquiry (MIPOI)” and “Mathematics is a set of rules and
procedures (MISORAP)”. MIPOI represents positive and MISORAP represents negative beliefs about the
nature of mathematics. The beliefs about learning mathematics considered in two sections, as well. They were “Mathematics is learned through active involvement (MILTAI)”, which represents positive beliefs, and “Mathematics is learned through following teacher direction (MILTFT)”, which represents negative beliefs. Beliefs about achievement in mathematics are only composed of negative beliefs under the title of “Mathematics is a fixed ability (MIFA)”. The average belief scores of the PEMTs for the mentioned five factors in university, NUTS Level-1 regions and Turkey nationwide scale were presented in Table 3.
Table 3. Belief Percentiles of PEMTs about the Nature of Mathematics, Learning Mathematics and
Mathematics Achievement
NUTS
Level-1 University
MIPOI MISORAP * MILTAI MILTFT * MIFA *
% SE % SE % SE % SE % SE TR1 TR1Ü1 76,75 0,25 44,73 0,27 80,70 0,21 9,86 0,12 16,77 0,20 TR2 TR2Ü1 90,64 0,08 54,25 0,17 86,22 0,09 11,60 0,09 31,12 0,15 TR3 TR3Ü1 TR3Ü2 85,18 84,78 0,13 0,32 49,83 51,44 0,39 0,18 83,33 81,48 0,29 0,12 10,86 15,15 0,18 0,12 25,54 30,68 0,16 0,32 TR3Ü3 83,84 0,17 46,92 0,24 80,00 0,15 17,11 0,14 31,92 0,17 Region Average 84,67 0,10 49,01 0,13 81,19 0,09 15,30 0,08 30,48 0,11 TR4 TR4Ü1 89,47 0,15 46,92 0,25 85,52 0,15 11,84 0,25 27,63 0,23 TR5 TR5Ü1 TR5Ü2 82,63 75,67 0,32 0,29 61,80 58,55 0,30 0,38 76,57 78,47 0,25 0,31 17,56 15,62 0,20 0,24 23,31 29,16 0,36 0,21 Region Average 78,41 0,21 59,83 0,23 77,32 0,19 16,80 0,15 25,61 0,19 TR6 TR6Ü1 77,87 0,20 59,77 0,23 77,01 0,18 22,62 0,18 35,34 0,23 TR6Ü2 75,92 0,23 51,48 0,29 79,25 0,23 13,88 0,23 30,55 0,24 Region Average 77,02 0,15 56,14 0,18 77,99 0,14 18,81 0,15 33,25 0,16 TR7 TR7Ü1 76,43 0,17 51,34 0,19 73,37 0,17 16,95 0,14 27,01 0,18 TR7Ü2 77,38 0,24 55,95 0,27 78,17 0,24 18,15 0,24 33,92 0,27 TR7Ü3 78,78 0,15 46,02 0,18 82,38 0,12 11,78 0,11 24,00 0,15 Region Average 77,57 0,10 50,07 0,12 77,95 0,09 15,09 0,08 27,13 0,11 TR8 TR8Ü1 89,94 0,12 34,12 0,18 82,53 0,13 9,32 0,11 17,26 0,16 TR9 TR9Ü1 TR9Ü2 84,51 78,00 0,08 0,18 38,94 48,66 0,19 0,12 80,22 86,50 0,11 0,07 15,16 10,93 0,13 0,06 31,83 31,18 0,11 0,19 Region Average 82,62 0,07 41,76 0,10 84,68 0,06 12,16 0,05 31,37 0,10
TRA TRAÜ1 TRAÜ2 81,26 74,21 0,15 0,16 47,46 56,44 0,18 0,19 75,62 75,55 0,16 0,16 15,21 15,59 0,11 0,12 32,54 36,19 0,16 0,17
Region Average 77,72 0,11 51,97 0,13 75,59 0,11 15,4 0,08 34,36 0,11 TRB TRBÜ1 82,95 0,18 56,06 0,27 85,22 0,15 15,34 0,16 32,38 0,20 TRC TRCÜ1 79,34 0,16 56,10 0,20 73,00 0,15 16,54 0,15 29,04 0,20 TRCÜ2 73,80 0,31 52,38 0,35 79,16 0,27 18,75 0,21 32,14 0,27 Region Average 77,77 0,14 55,05 0,17 74,74 0,13 17,17 0,12 29,92 0,16
Turkey Overall Average 81,38 0,03 49,44 0,04 80,28 0,03 14,40 0,03 29,73 0,04
* Since MISORAP, MILTFT, and MIFA dimensions include negative opinions, lower percentiles indicate that pre-service teachers exhibited more positive beliefs.
Among the beliefs of PEMTs, the least frequently accepted negative belief was that mathematics is learned through following teacher direction (14.40%) and the most frequently accepted negative believe was that mathematics is a set of rules and procedures (49.14%) . On the other hand, among the positive beliefs the views of mathematics is a process of inquiry (81.38%) and mathematics is learned through
active involvement (80.28%) were adopted more frequently by the PEMTs. Besides, pre-service teachers
most frequently did not agree on the views that mathematics is leaned through teacher direction (85.60%). Also the views about mathematics is a process of inquiry and mathematics is learned through active involvement are accepted with a high percentile. In this way, it was seen that while positive beliefs were adopted more frequently, negative beliefs were not been approved in general. Although the percentile of the approving the views of mathematics is a fixed ability was 29.73%, an important percentile of the PEMTs as 70.27% did not agree upon this belief. In conclusion, it can be said that the positive beliefs of the PEMTs were rather dominant but the negative belief of mathematics is a set of rules and procedures was also pretty common. It was seen that about half of the PEMTs were adopted this belief.
Findings Related to PEMTs Beliefs about the Nature of Mathematics
The percentile of PEMTs’ belief about the nature of mathematics indicating that mathematics is a
process of inquiry was presented below with university distribution and Turkey’s overall score average
(Graph 1).
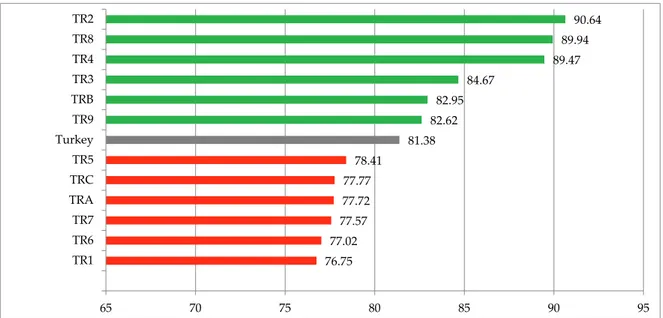
Graph 1. Percentiles of PEMTs Considering Mathematics as an Inquiry Process in Sampled Universities
Graph 1 shows that the belief towards considering “mathematics as an inquiry process” was most common in TR2Ü1, TR8Ü1 and TR4Ü1 universities. In TRCÜ2 and TRAÜ2 universities the percentile of the PEMTs was lower. When the issue is dealt with the perspective of average of Turkey; 12 universities were below the average (TRCÜ2, TRAÜ2, TR5Ü2, TR6Ü2, TR7Ü1, TR1Ü1, TR6Ü1, TR7Ü2, TR9Ü2, TR7Ü3, TRCÜ1,TRAÜ1) and 9 universities were above the average (TR2Ü1, TR8Ü1, TR4Ü1, TR3Ü1, TR3Ü2, TR9Ü1, TR3Ü3, TRBÜ1, TR5Ü1). Distribution of the beliefs in this dimension with respect to regions was presented in Graph 2.
73.80 74.21 75.67 75.92 76.43 76.75 77.38 77.87 78.00 78.78 79.34 81.26 81.38 82.63 82.95 83.84 84.51 84.78 85.18 89.47 89.94 90.64 0 10 20 30 40 50 60 70 80 90 100 TRCÜ2 TRAÜ2 TR5Ü2 TR6Ü2 TR7Ü1 TR1Ü1 TR7Ü2 TR6Ü1 TR9Ü2 TR7Ü2 TRCÜ1 TRAÜ1 Turkey TR5Ü1 TRBÜ1 TR3Ü3 TR9Ü1 TR3Ü2 TR3Ü1 TR4Ü1 TR8Ü1 TR2Ü1
Graph 2. Distribution of PEMTs Considering Mathematics as an Inquiry Process with respect to NUTS
As seen in Graph 2, the PEMTs educated in the university in TR2 region had the belief towards mathematics is a process of inquiry with higher percentile. TR2 region was followed by TR8 and TR4 regions. The belief with the lowest percentile was in TR1 region. In addition, six regions were above the average in terms of belief towards mathematics is a process of inquiry (TR2, TR8, TR4, TR3, TRB, TR9) while six others were below the average (TR1, TR6, TR7, TRA, TRC, TR5).
When the tendency towards the belief of mathematics is an inquiry process was examined in terms of regions and universities in these regions, it was observed that there were considerable differences among the average scores of the universities in certain regions. For example, belief score percentile about considering mathematics as a process of inquiry in TRAÜ1 university in TRA region was 81.26%. Whereas in TRAÜ2, in the same region, the belief score percentile was 74.21%. Similarly, in TR9 region, while the average of TR9Ü1 university was 84.51%, at TR9Ü2 the belief average was 78%.
In order to test whether the distribution of the belief towards mathematics is a process of inquiry diverse in different regions, One-Way ANOVA test was applied. The analysis showed that PEMTs’ beliefs significantly changed with the development state of the regions [F (11-1406) = 4.644,
p < .01]. Applied Levene test indicated that the variances of average belief scores of the regions were not
homogeneous for mathematics is a process of inquiry dimension (F=7.163, p=<.01). Accordingly, Tamhane’s T2 test results were controlled, the results of which were presented in Table 4.
Table 4. ANOVA Results of the Mathematics is an inquiry Process Dimension
Source Sum of Squares df Mean Square F sig Significant Difference*
Between Groups 103.018 11 9.365 4.644 .000 TR2-TR6, TR2-TR7, TR2-TR9, TR2-TRA, TR2-TRC, TR4-TR7, TR4-TRA, TR6-TR8, TR7-TR8, TR8-TRA, TR8-TRC Within Group 2835.549 1406 2.017
*The bold printed items are the groups which significant difference favors.
Table 4 presents that there were significant differences between TR2 region and TR6, TR7, TR9, TRA and TRC regions favoring TR2 region. Additionally, there were also significant differences between TR4 and TR7, TRA; TR8 and TR6, TR7, TRA, TRC. These differences came from the reason that pre-service teachers continuing their education in TR2, TR4 and TR8 regions had higher belief scores for mathematics is a process of inquiry dimension.
76.75 77.02 77.57 77.72 77.77 78.41 81.38 82.62 82.95 84.67 89.47 89.94 90.64 65 70 75 80 85 90 95 TR1 TR6 TR7 TRA TRC TR5 Turkey TR9 TRB TR3 TR4 TR8 TR2
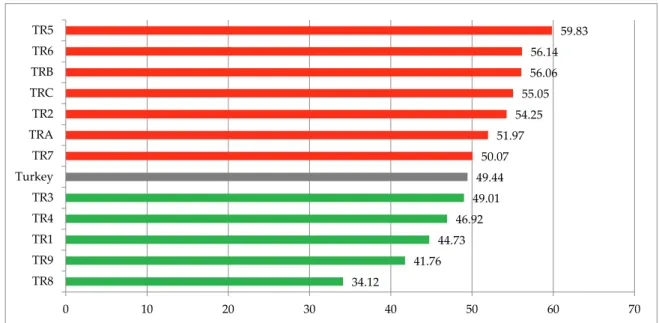
Since mathematics is a set of rules and procedures dimension is a negative belief, PEMTs’ having low percentile from this dimension means that they do not consider mathematics as a set of rules and procedures. For this reason, universities agreeing this opinion with the rate of overall Turkey average or lower than it can be accepted as mainly adopt the positive belief. Graph 3 presents distribution of PEMTs’ beliefs in this dimension with respect to universities with Turkey average.
Graph 3. Distribution of the PEMTs Considering Mathematics as a Set of Rules and Procedures with
Respect to Universities
Graph 3 tells that agreeing this belief in 8 universities (TR8Ü1, TR9Ü1, TR1Ü1, TR7Ü3, TR3Ü3, TR4Ü1, TRAÜ1, TR9Ü2) was below average of Turkey and in the rest of 13 universities (TR3Ü1, TR7Ü1, TR3Ü2, TR6Ü2, TRCÜ2, TR2Ü1, TR7Ü2, TRBÜ1, TRCÜ1, TRAÜ2, TR5Ü2, TR6Ü1, TR5Ü1) it was above the average. In universities, percentile of agreeing the belief saying mathematics is a set of rules and
procedures was generally accumulated in the range of 46-56%. This means that almost half of the teachers
agreed the belief mathematics is a set of rules and procedures. While TR8Ü1 and TR9Ü1were universities agreed this thought with the lowest rate, TR5Ü1 was the university agreed the belief with the highest rate. TR6Ü1 and TR5Ü2 followed the rate of TR5Ü1. Distribution of the beliefs in this dimension versus regions is presented in Graph 4.
34.12 38.94 44.73 46.02 46.92 46.92 47.46 48.66 49.44 49.83 51.34 51.44 51.48 52.38 54.25 55.95 56.06 56.1 56.44 58.55 59.77 61.8 0 10 20 30 40 50 60 70 TR8Ü1 TR9Ü1 TR1Ü1 TR7Ü3 TR3Ü3 TR4Ü1 TRAÜ1 TR9Ü2 Turkey TR3Ü1 TR7Ü1 TR3Ü2 TR6Ü2 TRCÜ2 TR2Ü1 TR7Ü2 TRBÜ1 TRCÜ1 TRAÜ2 TR5Ü2 TR6Ü1 TR5Ü1
Graph 4. Distribution of PETMs’ Considering Mathematics as a Set of Rules and Procedures
with Respect to NUTS
Graph 4 exhibits that the belief of considering mathematics as a set of rules and procedures mostly agreed by the participants in TR5 and least agreed in TR8 regions. The highest rate of TR5 was followed by TR6 and TRB regions. The difference between the region with the lowest percentile (TR8) and the region having the second lowest percentile (TR9) was reasonably great. In agreeing this belief 5 regions were (TR8, TR9, TR1, TR4, TR3) below average of Turkey and in the rest of 7 regions (TR7, TRA, TR2, TRC, TRB, TR6, TR5) were above the average.
In order to test whether the belief towards mathematics is a set of rules and procedures diverted in different regions, One-Way ANOVA test was applied. The analysis showed that PEMTs’ beliefs significantly changed with the development state of the regions [F (11-1406) = 5.129, p < .01]. With Levene test homogeneity of the variances were tested. Applied Levene test indicated that the variances of average belief scores of the regions were not homogeneous for mathematics is a set of rules and procedures dimension (F=2.573, p=<.01). Tamhane’s T2 test results were checked and the results were presented in Table 5.
Table 5. ANOVA Results of the Mathematics is a Set of Rules and Procedures Dimension Source Sum of Squares df Mean Square F sig Significant Difference**
Between Groups 184.088 11 16.735 5.129 .000 TR2-TR8, TR2-TR9, TR3-TR8, TR5-TR8, TR5-TR9, TR6-TR8, TR6-TR9, TR7-TR8, TR8-TRA, TR8-TRB, TR8-TRC, TR9-TRA, TR9-TRC Within Group 4587.354 1406 3.263
**This dimension includes negative beliefs. For this reason the side with significantly lower average was indicated as the side that significant difference favors. Bold printed items are the groups which significant difference favors.
Table 5 shows that there were significant differences between TR8 region and TR2, TR3, TR5, TR6, TR7, TRA, TRC regions, favoring TR2 region. These differences came from the reason that PEMTs continuing their education in TR8 region had lower belief scores for mathematics is a set of rules and procedures dimension. Besides, there were significant differences between TR9 region and TR2, TR5, TR6, TRA, TRC regions, favoring TR9 region. These differences came from the reason that pre-service teachers continuing their education in TR9 region had lower belief scores for mathematics is a set of rules and procedures dimension.
34.12 41.76 44.73 46.92 49.01 49.44 50.07 51.97 54.25 55.05 56.06 56.14 59.83 0 10 20 30 40 50 60 70 TR8 TR9 TR1 TR4 TR3 Turkey TR7 TRA TR2 TRC TRB TR6 TR5
Findings Related to PEMTs’ Beliefs about Learning Mathematics
Graph 5 presents distribution of the PEMTs having the belief of mathematics is learned through
active involvement with regards to the universities and general average of Turkey.
Graph 5. Distribution of PEMTs Considering Mathematics is Learned through Active Involvement
with respect to Universities
When Graph 5 is examined, it can be observed that the percentile of approving the belief that
mathematics is learned through active involvement is high for all of the universities. In other words, PEMTs
think that mathematics should be learned through active involvement. The universities agreeing this belief with highest percentile were respectively; TR9Ü1 (86.5%), TR2Ü1 (86.22%) and TR4Ü1 (85.52%). On the other hand, the universities approving the belief with the lowest percentiles were TRCÜ1 (73%) and TR7Ü1 (73.37%). When Graph 5 is evaluated in terms of general average of Turkey, 9 universities were above average of Turkey (TR9Ü1, TR2Ü1, TR4Ü1, TRBÜ1, TR3Ü2, TR8Ü1, TR7Ü3, TR3Ü1, TR1Ü1) but 12 universities were below the average (TR9Ü2, TR3Ü3, TR6Ü2, TRCÜ2, TR5Ü1, TR7Ü2, TR6Ü1, TR5Ü2, TRAÜ2, TRAÜ1, TR7Ü1, TRCÜ1). TR9Ü2 and TR3Ü3 universities had quite close values to general average of Turkey. Distribution of the beliefs in this dimension with respect to regions is presented in Graph 6. 73 73.37 75.55 75.62 76.57 77.01 78.17 78.47 79.16 79.25 80 80.22 80.28 80.7 81.48 82.38 82.53 83.33 85.22 85.52 86.22 86.5 65 70 75 80 85 90 TRCÜ1 TR7Ü1 TRAÜ1 TRAÜ2 TR5Ü2 TR6Ü1 TR7Ü2 TR5Ü1 TRCÜ2 TR6Ü2 TR3Ü3 TR9Ü2 Turkey TR1Ü1 TR3Ü1 TR7Ü3 TR8Ü1 TR3Ü2 TRBÜ1 TR4Ü1 TR2Ü1 TR9Ü1
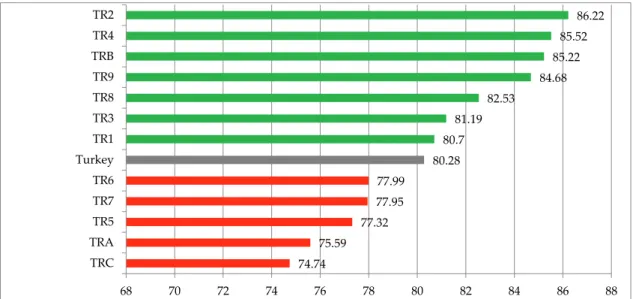
Graph 6. Distribution of PEMTs’ Beliefs about Mathematics is Learned through Active Involvement
Beliefs with respect to NUTS
Examining Graph 6 it is seen that, the percentile of the PEMTs’ belief of mathematics is learned
through active involvement in TR2 region was higher than the other regions. TR2 was followed by TR4
and TRB regions in terms of approving the belief. The lowest rate of approving the belief of mathematics should be learned through active involvement was in TRC region. When the region averages compared with average of Turkey, seven regions were above the average in terms of belief towards mathematics is
learned through active involvement (TR2, TR4, TRB, TR9, TR8, TR3, TR1) while the rest; five were below
the average (TR6, TR7, TR5, TRA, TRC). Although TR9Ü1 was the university accepting this belief with the highest rate, TR9Ü2 fell into just below of the average of Turkey, which caused TR9 became the region with 4th highest percentile in Turkey in terms of accepting this belief. However in TRA region
universities TRAÜ1 and TRAÜ2 had similar percentiles and eventually their individual percentiles and the region’s percentile were parallel.
In order to test whether mathematics is learned through active involvement belief diverted with respect to different NUTS Level 1regions, One-Way ANOVA test was applied. The analysis showed that PEMTs’ beliefs significantly changed with the development state of the regions [F (11-1406) = 3.860, p < .01]. Before the test, homogeneity of the variances was tested with the help of Levene test. Levene test indicated that the variances of average belief scores of the regions were not homogeneous for mathematics is learned through active involvement dimension (F=5.971, p=<.05). Therefore, Tamhane’s T2 test results were checked and the results were presented in Table 6.
Table 6. ANOVA Results of the Mathematics is Learned through Active Involvement Dimension Source Sum of Squares df Mean Square F sig Significant Difference*
Between
Groups 75.619 11 6.874 3.860 .000 TR2-TR7, TR2-TRA,
TR2-TRC, TR9-TRA, TR9-TRC
Within
Group 2504.075 1406 1.781
* Bold printed items are the groups which significant difference favors.
Table 6 presents that there were significant differences between TR2 region and TR7, TRA, TRC regions favoring TR2 region, which means PEMTs in TR2 region had higher belief scores for student centered mathematics learning dimension. In addition, there were also significant differences between TR9 and TRA, TRC regions. These differences came from the reason that PEMTs continuing their education in TR9 region had higher belief scores for mathematics is learned through active involvement
74.74 75.59 77.32 77.95 77.99 80.28 80.7 81.19 82.53 84.68 85.22 85.52 86.22 68 70 72 74 76 78 80 82 84 86 88 TRC TRA TR5 TR7 TR6 Turkey TR1 TR3 TR8 TR9 TRB TR4 TR2
dimension. Nevertheless, it can be said that mathematics is learned through active involvement belief was not diverse much among regions.
Since mathematics is learned through following teacher direction dimension is a negative belief, PEMTs’ having low percentile from this dimension means that participants do not consider mathematics is learned through following teacher direction. For these reason universities agreeing this opinion with lower rate can be accepted as mainly adopt the positive belief. Graph 7 presents distribution of PEMTs’ learning related mathematics is learned through following teacher direction beliefs with respect to universities with the average of Turkey.
Graph 7. Distribution of PEMTs Considering Mathematics is Learned through Following
Teacher Direction in the Sampled Universities
When Graph 7 is examined, it can be said that the percentile of approving the belief that
mathematics is learned through following teacher direction was low for all of the universities and it was
commonly ranged between 14-18%. This tells that the PEMTs in general do not agree the belief that mathematics should be learned through following teacher direction. The university approving the belief with the lowest percentiles was TR8Ü1 and it was followed by TR1Ü1. The university agreeing this belief with highest percentile and being divergent from the other universities was TR6Ü1. Almost one fifth of the participants from this university agreed to the belief that mathematics is learned through
following teacher direction. When the graph is evaluated in terms of general average of Turkey 8
universities were below average of Turkey (TR8Ü1, TR1Ü1, TR3Ü2, TR9Ü1, TR2Ü1, TR7Ü3, TR4Ü1, TR6Ü2) and the rest of 13 universities were above the average (TR3Ü1, TR9Ü2, TRAÜ2, TRBÜ1, TRAÜ1, TR5Ü1, TRCÜ1, TR7Ü1, TR3Ü3, TR5Ü2, TR7Ü2, TRCÜ2, TR6Ü1). Distribution of the beliefs in this dimension with respect to NUTS Level 1regions is presented in Graph 8.
9.86 9.32 10.86 10.9311.6 11.7811.84 13.8814.4 15.15 15.16 15.21 15.3415.59 15.6216.54 16.9517.11 17.5618.15 18.75 22.62 0 5 10 15 20 25 TR1Ü1 TR8Ü1 TR3Ü2 TR9Ü1 TR2Ü1 TR7Ü3 TR4Ü1 TR6Ü2 Turkey TR3Ü1 TR9Ü2 TRAÜ2 TRBÜ1 TRAÜ1 TR5Ü1 TRCÜ1 TR7Ü1 TR3Ü3 TR5Ü2 TR7Ü2 TRCÜ2 TR6Ü1
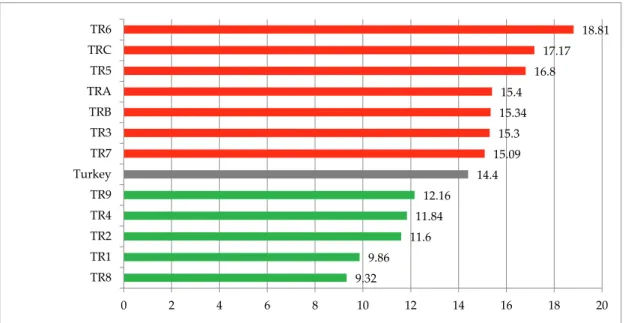
Graph 8. Distribution of PEMTs Thinking That Mathematics is Learned through
Following Teacher Direction with respect to NUTS
Examining Graph 8 it is seen that, the lowest rates of approving the belief were in TR8 (9.32%) and TR1 (9.86%) regions respectively. This situation means that PEMTs in these regions do not agree that mathematics is learned through following teacher direction. Conversely, TR6 (18.81%) was the region with the highest approval rate. In addition, while 7 regions (TR7, TR3, TRB, TRA, TR5, TRC, TR6) were above the average of Turkey, 5 regions (TR8, TR1, TR2, TR4, TR9) below the average in approving this belief.
In order to test whether the belief towards mathematics is learned through following teacher direction diverted in different regions, One-Way ANOVA test was carried out. The analysis showed that PEMTs’ beliefs significantly changed with the development state of the regions [F (11-1406) = 3.542, p < .01]. With the help of Levene test homogeneity of the variances were tested. Levene test indicated that the variances of average belief scores of the regions were not homogeneous for mathematics s learned through following teacher direction dimension (F=5.583 p=<.05). For this reason Tamhane’s T2 test results were checked and the results were presented in Table 7.
Table 7. ANOVA Results of Mathematics is Learned through Following Teacher Direction Dimension Source Sum of Squares df Mean Square F sig Significant Difference**
Between
Groups 53.367 11 4.852 3.542 .000 TR1-TR6, TR6-TR8, TR8-TRC Within
Group 1925.731 1406 1.370
**This dimension inquires negative beliefs. For this reason the side with significantly lower average was indicated as the side that significant difference favors. Bold printed items are the groups which significant difference favors. When Table 7 is examined it can be seen that there were significant differences between TR8 region and TR6, TRC regions favoring TR2 region. These differences came from the reason PEMTs continuing their education in TR8 region had lower belief scores for mathematics is learned through
following teacher direction dimension. Besides, there were significant differences between TR1 region and
TR6 region, favoring TR1 region. These differences came from the reason that PEMTs continuing their education in TR1 region had lower belief scores for this dimension. The smallest divergence among the regions was in the belief of mathematics is learned through following teacher direction. This situation states that the beliefs about teacher centered mathematics learning do not differ much in the regions.
9.32 9.86 11.6 11.84 12.16 14.4 15.09 15.3 15.34 15.4 16.8 17.17 18.81 0 2 4 6 8 10 12 14 16 18 20 TR8 TR1 TR2 TR4 TR9 Turkey TR7 TR3 TRB TRA TR5 TRC TR6
Findings Related to PEMTs’ Beliefs about Mathematics Achievement
Since mathematics is a fixed ability belief is a negative belief about mathematics achievement, universities and regions having low percentile from this dimension is evaluated as a positive situation, when student centered approaches concerned. Graph 9 presents distribution of PEMTs’ opinions about
mathematics is a fixed ability belief in the sampled universities with the average of Turkey.
Graph 9. Distribution of PEMTs Considering Mathematics is a Fixed Ability
in the Sampled Universities
When Graph 9 is examined, it can be said that the percentile of approving the belief that
mathematics is a fixed ability commonly ranged between 29-33%. The university approving the belief with
the lowest percentiles was TR1Ü1 (16.77%) and TR8Ü1 (17.26%). The rate of approving this belief by these two universities substantially differs from the rest. The university agreeing this belief with the highest percentile was TRAÜ1 (36.19%). When general average of Turkey considered it seemed that the belief that mathematics is not a fixed ability was the dominant belief. 9 universities were below the average of Turkey (TR1Ü1, TR8Ü1, TR5Ü2, TR7Ü3, TR3Ü2, TR7Ü1, TR4Ü1, TRCÜ1, TR5Ü1) and the rest of 12 universities were above the average (TR6Ü2, TR3Ü1, TR2Ü1, TR9Ü1, TR9Ü2, TR3Ü3, TRCÜ2, TRBÜ1, TRAÜ2, TR7Ü2, TR6Ü1, TRAÜ1). Distribution of the beliefs in this dimension with respect to NUTS Level 1regions is presented in Graph 10.
16.77 17.26 23.31 24 25.54 27.01 27.63 29.04 29.16 29.73 30.55 30.68 31.12 31.18 31.83 31.92 32.14 32.38 32.54 33.92 35.34 36.19 0 5 10 15 20 25 30 35 40 TR1Ü1 TR8Ü1 TR5Ü2 TR7Ü3 TR3Ü2 TR7Ü1 TR4Ü1 TRCÜ1 TR5Ü1 Turkey TR6Ü2 TR3Ü1 TR2Ü1 TR9Ü1 TR9Ü2 TR3Ü3 TRCÜ2 TRBÜ1 TRAÜ2 TR7Ü2 TR6Ü1 TRAÜ1
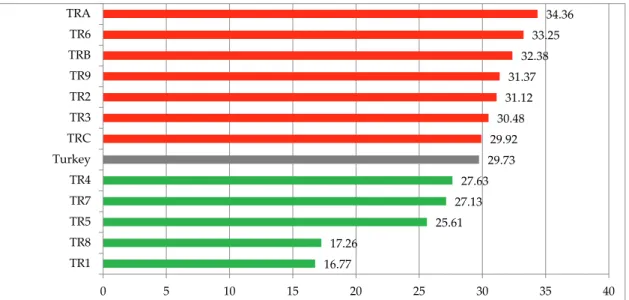
Graph 10. Distribution of PEMTs’ Belief about Mathematics is a Fixed Ability
with respect to NUTS
Examining Graph 10 it is seen that, PEMTs in TR1 region expressed that mathematics is not a fixed ability with the highest frequency. TR8 region followed TR1. On the other hand PEMTs in TRA region had the belief of mathematics requires a fixed ability with the highest frequency. When the average of Turkey is considered in terms of approving the opinion arguing mathematics is a fixed ability, 5 regions (TR1, TR8, TR5, TR7, TR4) were below the average of Turkey, and 7 regions (TRC, TR3, TR2, TR9, TRB, TR6, TRA) were above the average.
In order to test whether the belief towards mathematics is a fixed ability diverted in different regions, One-Way ANOVA test was carried out. The analysis showed that PEMTs’ beliefs significantly changed with the development state of the regions [F (11-1406) = 5.784, p <.01]. With the help of Levene test homogeneity of the variances were tested. Levene test indicated that the variances of average belief scores of the regions were homogeneous for mathematics is a fixed ability dimension (F=1.396, p=.168). For this reason Tukey test results were checked and the results were presented in Table 8.
Table 8. ANOVA Results of Mathematics is a Fixed Ability Dimension
Source Sum of Squares df Mean Square F sig Significant Difference**
Between Groups 166.042 11 15.095 5.784 .000 TR2, TR3, TR6, TR1-TR9, TR1-TRA, TR1-TRB, TR1-TRC, TR2-TR8, TR3-TR8, TR6-TR8, TR7-TR8, TR7-TRA, TR8-TR9, TR8-TRA, TR8-TRB, TR8-TRC Within Group 3669.594 1406 2.610
**This dimension inquires negative beliefs. For this reason the side with significantly lower average was indicated as the side that significant difference favors. Bold printed items are the groups which significant difference favors. When Table 8 is examined it can be seen that there were significant differences between TR8 region and TR2, TR3, TR6, TR7, TR9, TRA, TRB, TRC regions favoring TR2 region. These differences came from the reason that PEMTs continuing their education in TR8 region had lower belief scores for
mathematics is a fixed ability dimension. Besides there were significant differences between TR1 region,
and TR2, TR3, TR6, TR9, TRA, TRB, TRC regions favoring TR1 region. These differences came from the reason that PEMTs continuing their education in TR1 region had lower belief scores for this dimension. Although TR1 region had lower percentile than TR8 in terms of agreeing this negative belief, more significant differences were detected between TR8 and other regions. The widest divergence among the regions was in the belief of mathematics is a fixed ability. In other words pre-service teachers had the widest differences in this dimension.
16.77 17.26 25.61 27.13 27.63 29.73 29.92 30.48 31.12 31.37 32.38 33.25 34.36 0 5 10 15 20 25 30 35 40 TR1 TR8 TR5 TR7 TR4 Turkey TRC TR3 TR2 TR9 TRB TR6 TRA
Discussion and Conclusion
In this section the findings about the beliefs of 1418 PEMTs from 21 different universities towards the nature of mathematics, learning mathematics and mathematics achievement were discussed in terms of universities and regions.
With the framework of this study the beliefs about the nature of mathematics had examined from the perspective of these opinions; mathematics is a process of inquiry and mathematics is a set of rules and procedures. There have been various attempts to define the beliefs about the nature of mathematics (Ernest, 1991; Liljedahl et al., 2007). Grigutsch et al. (1998) classified the perspectives towards the nature of mathematics as dynamic and static view (as cited in Felbrich et al., 2014). Dynamic view considers mathematics as adopting process-related or contemporary approaches. Whereas Static view is referred as rule or formula related. The view arguing mathematics is a process of inquiry consists of positive beliefs towards the nature of mathematics. This view takes mathematics not as a traditional field of study but it rather concerns constructivist aspects of mathematics. The beliefs related to this dimension have also been referred as constructivist approach (Dede & Karakuş, 2014; Tatto et al., 2012,). Based on belief scores it can be said that among 21 universities across Turkey context TR2Ü1in West Marmara was the university mostly agreed to the dynamic view (90.64%) and on the other hand, TRCÜ2 in South East Anatolia was the university adopting the dynamic view with the lowest percentile (73.8%). In overall Turkey context it was observed that PEMTs’ beliefs toward this view were high and dynamic view was dominant (81.38%). It was found out that the general average of Turkey fell exactly in the middle of the universities sampled for their distribution i.e. the average of Turkey was also the median of the distribution.
When the issue is examined in region level, the PEMTs in West Marmara (TR2) region had this dynamic view with the highest level (90.64%). Almost all of the participants agreed this opinion in the region. In contrast, the beliefs of the PEMTs in İstanbul (TR1) region were at lowest percentile (76.75%). In terms of approving this belief there was not a remarkable difference among the rest of the regions, backed with which it can be said that the regions had a homogeneous structure in approving this belief. Although there was not a wide range across the regions, there were discrepancies between certain regions. It was determined that differences between these regions were statistically significant as well. These differences favored West Marmara (TR2), East Marmara (TR4) and West Blacksea (TR8) regions and it can be said that Middle Anatolia (TR7) and Northeast Anatolia (TRA) regions had effect on these differences to be occurred. Although İstanbul (TR1) region had the lowest belief percentile for this view, the region had no statistically significant difference from any of the regions. The probable factors causing this situation were (a) number of the participants from İstanbul (TR1) region was low, (b) number of the participants from Northeast Anatolia (TRA) and Middle Anatolia (TR7) regions were too high and they constituted a considerable part of the sample (approximately one third), (c) the standard deviation values of belief distributions of all these three regions were close to each other.
When nationwide level considered, it can be said that the PEMTs agreed that mathematics is a process of inquiry with a high percentile (81.38%). Previous national studies also pointed that this belief was highly approved in general (Dede & Karakuş, 2014; Eryılmaz Çevirgen, 2016; Kayan et al., 2013). When the equivalent sample, the sample of TEDS-M (Germany, Thailand, the USA, Singapore, Malaysia, and Poland) was considered a similar result can be seen. TEDS-M countries also had high averages for this belief (Felbrich et al., 2014; Tatto et al., 2012), which shows that PEMTs approve this belief independent from society and culture context. This situation can be associated with the opinion that student centered learning theories are world-wide accepted. It was thought that this acceptance also affects the view point of the teacher educators. Therefore, one of the factors that underlies this
widespread belief could be the student centered learning theories emphasized and taught at education faculties.
Mathematics is a set of rules and procedures opinion is formed by negative beliefs towards the
nature of mathematics. It implies that mathematics is rather formula and rule-related. Previous studies also defined the beliefs in this dimension as traditional approach based beliefs (Tatto et al., 2012). The opinions accepting mathematics as a set of rules and procedures were referred as static view (Grigutsch et al., 1998; as cited in Felbrich et al., 2014). Across Turkey, this static view was mostly accepted by PEMTs in TR5Ü1 (61.8%) in West Anatolia and least accepted by the PEMTs in TR8Ü1 (34.12%) in West Blacksea. It was observed that the range was quite wide in the distribution of this static view, which means that the idea arguing mathematics is a set of rules and procedures had a heterogeneous distribution. When the average of Turkey checked, 49.44% of the PEMTs thought that mathematics is a set of rules and procedures. When the regional level averages considered, it can be seen that, the average of Turkey fell into middle group. The static view of mathematics is a set of rules and procedures was least accepted by PEMTs in West Blacksea (TR8) and mostly accepted by PEMTs in West Anatolia (TR5). It was observed that for this belief the regions had a wide average range and showed a heterogeneous distribution. The differences in the averages of the regions were also statistically significant. These divergences favored West Blacksea (TR8) and East Blacksea (TR9) regions but there was not a single dominant region.
Dynamic belief and static belief represents two opposite views about the nature of mathematics. While dynamic view represents constructivist approach, static view prioritizes traditional approach. Considering the fact that middle school1 curricula in Turkey have been based on student centered
approach (Ministry of National Education Turkey [MEB], 2005, 2009, 2013), PEMTs’ beliefs towards the nature of mathematics are expected to being dynamic view dominated. When distributions of two views are evaluated in region level, some regions (Aegean (TR3), (East Marmara (TR4), West Blacksea (TR8), East Blacksea (TR9)) were above the average of Turkey in terms of dynamic view and below the average of Turkey in terms of static view. These regions were described as have consistent dynamic view. On the other hand, certain other regions (West Anatolia (TR5), Mediterranean (TR6), Middle Anatolia (TR7), Northeast Anatolia (TRA), South-East Anatolia (TRC) were below the average of Turkey in terms of dynamic view and above the average of Turkey in terms of static view. These regions were described as have consistent static view. The remaining three regions (İstanbul (TR1), West Marmara (TR2), Middle-East Anatolia (TRB)) could not be classified under these two topics. Hereby drawing a general conclusion like regions had a static/dynamic view about the nature of mathematics is not meaningful. This shows that the opinions about the nature of mathematics were not homogeneous in region level. The opinions held about the nature of mathematics also varied in TEDS-M countries. Blömeke and Kaiser (2014) noted that divergences on views about the nature of mathematics were affected by intercultural dimensions. Hofstede (2001) pointed out that the culture of a country has an influence on learning preferences in the socialization process. Blömeke and Kaiser (2014) associated the dominant opinions in their country with Hofstede's Cultural Dimensions Theory (2001). Hofstede rated and classified countries with respect to dominance of individualist or collectivist. In this classification when Hofstede score of a country increases this means that individual dimension is more dominant in that country. In countries with higher score of individuality, dynamic view is more dominant and in countries which are rather socially oriented static view is more dominant (Blömeke & Kaiser, 2014; Tatto et al., 2012). Hofstede score of Turkey indicates that the country is in social group, which implies the dominance of static view. Under these circumstances, although the dynamic view dominated in Turkey, the static view also occupied a considerable ratio. From this point of view; it is concluded that the opinions about the nature of mathematics were inconsistent. When both Hofstede report and the results
of this study are examined, it is understood that the idea of categorizing a multi-cultural country considering two components, such as Turkey in Hofstede, may cause to make a limited inference.
Beliefs about learning mathematics have been explained with traditional and constructivist approaches (Dede & Karakuş, 2014; Philipp, 2007; Staub & Stern, 2002). The view of mathematics is learned
through active involvement was classified as constructivist approach and mathematics is learned through following teacher directions view was classified as traditional approach. The participants from TR9Ü1
(86.5%) in East Blacksea mostly agreed to mathematics is learned through active involvement belief and the participants from TRCÜ1 (73%) in South-East Anatolia accepted the belief with the lowest frequency. In national scale it was observed that constructivist view was dominant (80.28%) about beliefs of PEMTs in this dimension. When it is examined in regions scale, it was observed that the average of Turkey fell into the middle. PEMTs in West Marmara (TR2) region accepted that mathematics is learned through active
involvement with the highest percentile (86.22%). This belief was agreed with lowest percentile by
PEMTs in South-East Anatolia (TRC) region (75.74%). Although TR9Ü1 in East Blacksea was the top in university ranking, in regions level East Blacksea (TR9) could not be the region with highest percentile. This result arose from the reason that PEMTs in TR9Ü2 in this region agreed this opinion with lower frequency and eventually they reduced the region average. Across the regions, it was observed that accepting this view had similar frequencies and there was not a wide range. Thus, it can be said that the distribution was homogeneous in regions level. There were only a few differences between regions detected. These differentiations were favoring West Marmara (TR2) and East Blacksea (TR9) regions. Northeast Anatolia (TRA) and South-East Anatolia (TRC) regions took part in the occurrence of these statistically significant differences. It is thought that, the highest acceptance level of the PEMTs in TR9 and TR2 regions and the lowest level in TRA and TRC regions toward the view of mathematics is learned
through active involvement could be effective on these differences, The view that mathematics is learned
through following teacher direction is composed of negative beliefs about mathematics learning. It remarks that mathematics is rather formula and rule-related and it is learned through following teacher direction. Beliefs in this dimension have been defined as traditional approach (Dede & Karakuş, 2014; Philipp, 2007; Staub & Stern, 2002). This view was accepted with the highest frequency by the PEMTs from TR6Ü1 (22.62%) in Mediterranean and with the lowest frequency by TR1Ü1 (9.86%) in İstanbul. The figures tell that in general traditional approach towards learning mathematics was not dominant among the PEMTs. Besides the range of distribution about this view at university level was quite narrow. It can be said that the views of PEMTs about this belief homogeneously distributed. When the general average of Turkey is considered, it can be seen that PEMTs had a low percentile for this belief. When the averages of the regions were examined, it was found out that the general average of Turkey was close to the lower group (the one which agreed this view with a lower percentile). The view that mathematics is learned through following teacher direction was least agreed by PEMTs in West Blacksea (TR8) (9.32%) and mostly agreed by Mediterranean (TR6) (18.81%). Therefore, it can be said that region and university distribution of this belief were parallel. Also, the regions had the minimum number of statistical difference for this view.
When the averages of the PEMTs for both views about learning mathematics were examined, it can be seen that the traditional view was not prioritized and constructivist view was dominant. Similarly some researches from Turkey (Boz, 2008; Eryılmaz Çevirgen, 2016; Kayan et al., 2013) stated that PEMTs had more frequently constructivist views than traditional views. It is speculated that the education given to PEMTs in education faculties had an effect on this situation. In education faculties, besides subject knowledge and general pedagogical knowledge, student centered various approach and techniques are taught within the courses about pedagogical content knowledge like “Mathematics Instruction” or “Special Instruction Methods”. Likewise, there have been studies reporting that these