COMPUTER AIDED DIAGNOSIS OF BREAST CANCER
FATİH KALELİ
COMPUTER AIDED DIAGNOSIS OF BREAST CANCER
A THESIS SUBMITTED TO THE GRADUATE SCHOOL
OF
BAHCESEHIR UNIVERSITY BY
FATİH KALELİ
IN PARTIAL FULFILLMENT OF THE REQUIREMENTS FOR THE DEGREE OF MASTER OF SCIENCE
IN
THE DEPARTMENT OF COMPUTER ENGINEERING
Approval of Institute of Science of Bahcesehir University
________________
Assoc. Prof. Dr. İrini Dimitriyadis
Director
I certify that this thesis satisfies all the requirements as a thesis for the degree of Master of Science
___________________
Asst. Prof. Dr. Adem Karahoca
Coordinator
This is to certify that we have read this thesis and that in our opinion it is fully adequate, in scope and quality, as a thesis for the degree of Master of Science.
_________________
Prof. Dr. Nizamettin Aydin
Supervisor
Examining Committee Members
Asst. Prof. Dr. Adem Karahoca _____________________ Prof. Dr. Nizamettin Aydin _____________________ Asst. Prof. Dr. Orhan Gokcol _____________________ ... _____________________ ... _____________________
ABSTRACT
COMPUTER AIDED DIAGNOSIS OF BREAST CANCER
Kaleli, Fatih
M.S. Department of Computer Engineering Supervisor: Prof. Dr. Nizamettin Aydin
February 2007, 41 pages
Breast cancer is a common problem among women with more than 1 million cases occurring worldwide annually. Breast cancer incidence is 42.7 per 100.000 in Turkey and it is the second leading cause of mortality among Turkish women, after lung cancer. Deaths due to breast cancer constitute 24.1% of all carcinoma cases reported among women in Turkey. In the United States (91.6 per 100.000), breast cancer incidence is relatively high when compared with Turkey. Now there are slightly over 2 million women living in the United States who have been treated for breast cancer.
In recent years, breast cancer death rates are going down. This decline is probably the result of diagnosing the cancer earlier and improved treatment. For this reason, early diagnosis of breast cancer has been playing very important role on women’s lives.
The goal is to identify cancers before they start to cause symptoms. The type of a breast cancer and its spreading speed are the most important factors in successful treatment for the patients. Therefore, early detection tests for breast cancer save many thousands of lives each year.
There are different guidelines for finding breast cancer early in women without symptoms such as clinical breast exam, breast awareness and breast self-exam (BSE), imaging tests (mammograms, MRI, Breast ultrasound, PET scan, CT scan etc.), and biopsy. MR technique is the best method among imaging tests. The segmentation of MR images is an important step to improve the detection and diagnosis of breast cancer. If the breast tissue is not segmented, it takes more time to extract needed information from breast images in computer aided diagnosis systems. Therefore, segmentation is an important issue in automated identification of cancerous breast tissue.
Main problem in breast images is the identification of the boundary between chest wall and breast tissue. Minimizing patient motion effects is also important step in segmentation process. In this study, we will discuss the techniques for the segmentation of MR breast images.
Key words: medical image processing, computer aided diagnosis,
magnetic resonance imaging (MRI), image segmentation and classification, morphological operators, histogram, artificial neural networks
ÖZET
MEME KANSERİNİN BİLGİSAYAR DESTEKLİ TEŞHİSİ
Kaleli, Fatih
Yüksek Lisans, Bilgisayar Mühendisliği Bölumu Tez Yöneticisi: Prof. Dr. Nizamettin Aydin
Şubat 2007, 41 sayfa
Meme kanseri kadınlar arasında dünya genelinde 1 milyondan daha fazla bir oranda ortaya çıkan yaygın bir sorundur. Türkiye’de meme kanserinin görülme oranı 100.000’de 42.7’dir ve dolayısıyla Türk kadınları arasında akciğer kanserinden sonra ölüme neden olma açısından ikinci sıradadır. Türkiye’de kadınlar arasındaki kanser ölümlerinin %24.1’i meme kanserindendir. Amerika Birleşik Devletleri’nde (91.6/100.000) ise meme kanserinin görülme oranı Türkiye’deki oranla karşılaştırıldığında oldukça yüksektir. Şu an Amerika Birleşik Devletleri’nde yaşayan 2 milyonun üzerindeki kadın meme kanseri tedavisi görmekte.
Son yıllarda meme kanseri ölüm oranları ise düşmekte. Erken teşhis ve gelişen tedavi yöntemlerinin, büyük olasılıkla bunda etkisi vardır. Bundan dolayı meme kanserinin erken teşhisi kadınların hayatında çok önemli rol oynuyor.
Kanserlerin semptomlara(belirti) yol açmadan teşhis edilmesi, ana hedeftir. Meme kanserinin çeşidi ve yayılma hızı hastalar için başarılı bir tedavi açısından en önemli faktörlerdir. Dolayısıyla, meme kanseri için erken tanı testleri her sene binlerce hayatı kurtarır.
Kadınlarda meme kanserinin semptomlara yol açmadan erken teşhisi için klinik meme testi, kişisel meme testi, görüntüleme testleri(mammagromlar, manyetik resonans görüntüleme, meme ultrasonu, PET scan metodu, CT scan metodu vs.) ve biyopsi gibi farklı tanı metodları vardır. MR tekniği ise görüntüleme testleri arasındaki en iyi yöntemdir. MR görüntülerinin segmentasyonu meme kanserinin teşhisi ve tanımlanmasını geliştirebilmek için önemli bir basamaktır. Meme dokusu bölümlenmezse, bilgisayar destekli teşhis sistemlerinde meme görüntülerinden gerekli bilginin çıkartılması fazla zaman alır. Bu sebeple, bölümme işlemi kanserli meme dokusunun otamatik olarak tanımlanmasında önemli bir konudur.
Meme görüntülerindeki temel problem, göğüs kafesiyle meme dokusu arasındaki sınırın tanımlanmasıdır. Hasta hareketlerinden kaynaklanan etkileri en aza indirmek te segmentasyon işleminde
önemli bir basamaktır. Bu çalışmada MR meme görüntülerinin bülümlenmesi ile ilgili teknikleri inceleyeceğiz.
Anahtar Kelimeler: medikal görüntü işleme, bilgisayar destekli
teşhis, manyetik rezonans görüntüleme, görüntü bölümleme ve sınıflandırma, morfolojik işlemler, histogram, yapay sinir ağları, bilgi bulma, XML, veritabanı tasarımı, karşılaştırma testi
ACKNOWLEDGMENTS
This thesis is dedicated to my mother for her patience and understanding during my master’s study and the writing of this thesis.
I would like to express my gratitude to Prof. Dr. Nizamettin Aydin, for not only being such a great supervisor but also encouraging and challenging me throughout my academic program.
My special thanks to coordinator Asst. Prof. Dr. Adem Karahoca who guided me with his knowledge and experience during preparation of this thesis.
I also wish to thank Assoc. Prof. Dr. Halil Gülçür, who helped me on selecting this thesis topic in the area of biomedical engineering.
The breast images are provided by Bogazici University (Turkey), Institute of Biomedical Engineering, for this study.
TABLE OF CONTENTS
ABSTRACT ... IV TABLE OF CONTENTS ...X LIST OF TABLES ... XI LIST OF FIGURES ... XII LIST OF ABBREVIATIONS ... XIII
1 INTRODUCTION ... 1
2 COMPUTER AIDED DIAGNOSIS OF BREAST CANCER ... 3
2.1 BREAST CANCER: THE BASICS... 3
2.1.1 WHAT IS THE BREAST CANCER?... 3
2.1.2 WHAT IS THE RISK FOR BREAST CANCER? ... 4
2.1.3 HOW CAN BREAST CANCER BE PREVENTED?... 5
2.1.4 WHAT ARE THE SIGNS OF BREAST CANCER? ... 6
2.1.5WHAT SCREENING TESTS ARE AVAILABLE? ... 6
2.2 BREAST MR IMAGING... 7
2.2.1 BREAST POSITIONING IN MRI?... 7
2.2.2 MR IMAGE TYPE (DICOM FILES)... 11
3 SEGMENTATION OF MR IMAGES OF BREAST AND RELATED WORK... 18
3.1 REGION BASED THRESHOLDING METHOD... 18
3.2 NOISE REDUCTION... 19
3.2.1 LINEAR SPATIAL FILTERING ... 20
3.2.2NON-LINEARSPATIALFILTERING ... 21
3.3 OTSU’S THRESHOLDING METHOD... 22
3.4 FUZZY C-MEANS BASED THRESHOLDING METHOD... 23
3.5 THE STEPS OF THE ALGORITHM... 26
3.6EXPERIMENTAL RESULTS... 31
4 CONCLUSIONS ... 36
REFERENCES... 37
LIST OF TABLES
LIST OF FIGURES
Figure 2.1 Structure of the breast tissue………. 3
Figure 2.2 MR imaging unit……….. 8
Figure 2.3 example MR images……….8
Figure 2.4 MR examination……….. 9
Figure 2.5 Human Body Orientations………10
Figure 2.6 Sagittal, Axial and Coronal MR Images………11
Figure 2.7 An example breast dicom file……….. 12
Figure 3.1 Noise (artifacts) on breast boundary………..19
Figure 3.2 the result of performing the linear filtering operation………20
Figure 3.3 the result of performing the non-linear filtering operation………...21
Figure 3.4 Regions R1 & R2………...… 26
Figure 3.5 Step1 of the Algorithm ………. 27
Figure 3.6 Step2 of the Algorithm ………. 28
Figure 3.7 Step3.1 of the Algorithm ………. 29
Figure 3.8 Step3.2 of the Algorithm ………. 30
Figure 3.9 Step4 of the Algorithm……….. 31
Figure 3.10 An experimental image and corresponding histogram of experimental image………….. 32
Figure 3.11 Segmentation process for MR breast images………. 33
Figure 3.12 Segmentation process for MR breast images………. 34
LIST OF ABBREVIATIONS
MRI Magnetic Resonance Imaging
GD-DTPA Gadolinium-diethylene-triamine-pentacetic acid DICOM Digital Imaging and Communications in Medicine
1 INTRODUCTION
Breast cancer is a common problem among women with more than 1 million cases occurring worldwide annually. For this reason, early diagnosis of breast cancer has been playing very important role on women’s lives. The goal is to identify cancers before they start to cause symptoms. The type of a breast cancer and its spreading speed are the most important factors in successful treatment for the patients. Therefore, early detection tests for breast cancer save many thousands of lives each year.
The segmentation of MR images is an important step to improve the detection and diagnosis of breast cancer. If the breast tissue is not segmented, it takes more time to extract needed information from breast images in computer aided diagnosis systems. Main problem in breast images is the identification of the boundary between chest wall and breast tissue. Minimizing the effects of patient motion is also important step in segmentation process. There are many different segmentation algorithms. The most common method is thresholding because of its usability and high level performance. The aim of using thresholding operation is to separate the objects and background into different regions in an image. Successful separation of an image in thresholding applications can be evaluated if the regions are non-overlapping. This is dependent on grouping the intensity levels of the image into two dominant modes.
In this study, we have examined and tested common thresholding methods such as Otsu’s thresholding method, and Fuzzy C Means based thresholding for dynamic contrast enhanced MR breast images. In general, gray level images can be easily segmented by using thresholding methods which are used to segment MR images in the study. However, they are not effective for axial breast images completely because of the fact that the breast has non-rigid structure and the sequence artifacts in axial MR breast images are very high. This thesis proposes a regional thresholding algorithm to segment MR breast images successfully. The outstanding problem is how to obtain an automatic procedure for detecting boundary between breast tissue and chest wall. This study also provides comparisons of the quality of segmentations among the proposed method and others. Extending this approach, the goal of this study was to evaluate the success of thresholding based method without binarization in the segmentation of DCE-MR breast images.
The remaining part of this thesis is organized as follows: The Basics information about breast cancer and MRI are explained in Section 2, Thresholding methods used in the segmentation problem of this thesis study, the proposed algorithm and the steps of the proposed algorithm are described in Section 3, experimental results and quantitative comparison with other methods also are discussed in Section 3 and finally, conclusions are presented in Section 4.
2 COMPUTER AIDED DIAGNOSIS OF BREAST
CANCER
2.1 Breast Cancer: The Basics
2.1.1 What is the Breast Cancer?
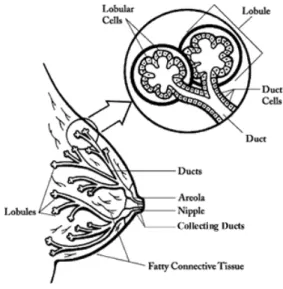
The breast consists of glands and fatty tissue that lies between the skins, the chest wall, blood vessels and lymph vessels. Each gland is also called a lobule, and many lobules make up a lobe. There are 15 to 20 lobes in each breast.
Figure 2.1 Structure of the breast tissue
Lymph is a clear liquid waste product that gets drained out of the breast into lymph nodes. Lymph nodes are small, pea-sized pieces of tissue that filter and clean the lymph. Most lymph nodes that drain the breast are under the arm in what is called the axilla.
Breast cancer happens when cells in the breast begin to grow out of control and can then invade nearby tissues or spread throughout the body. Large collections of this
out of control tissue are called tumors. However, some tumors are not really cancer because they cannot spread or threaten someone's life. These are called benign tumors. The tumors that can spread throughout the body or invade nearby tissues are considered cancer and are called malignant tumors. Theoretically, any of the types of tissue in the breast can form a cancer, but usually it comes from either the ducts or the glands. It may take months to years for a tumor to get large enough to feel in the breast.
2.1.2 What is the Risk for Breast Cancer?
Breast cancer is the most common malignancy affecting women in North America and Europe. Every woman is at risk for breast cancer. Close to 200,000 cases of breast cancer were diagnosed in the United States in 2001. Breast cancer is the second leading cause of cancer death in American women behind lung cancer. The lifetime risk of any particular woman getting breast cancer is about 1 in 8 although the lifetime risk of dying from breast cancer is much lower at 1 in 28.
Between 3% to 10% of breast cancers may be related to changes in either the gene BRCA1 or the gene BRCA2. Women can inherit these mutations from their parents and it may be worth testing for either mutation if a woman has a particularly strong family history of breast cancer (meaning multiple relatives affected, especially if they are under 50 years old when they get the disease). If a woman is found to carry either mutation, she has a 50% chance of getting breast cancer before she is 70. Family members may elect to get tested to see if they carry the mutation as well. If a woman does have the mutation, she can get more rigorous screening or even undergo preventive (prophylactic) mastectomies to decrease her chances of contracting
cancer. The decision to get tested is a highly personal one that should be discussed with a doctor who is trained in counseling patients about genetic testing.
2.1.3 How can Breast Cancer be prevented?
The most important risk factors for the development of breast cancer cannot be controlled by the individual. There are some risk factors that are associated with an increased risk, but there is not a clear cause and effect relationship. In no way can strong recommendations be made like the cause and effect relationship seen with tobacco and lung cancer. There are a few risk factors that may be modified by a woman that potentially could influence the development of breast cancer. If possible, a woman should avoid long-term hormone replacement therapy, have children before age 30, breastfeed, avoid weight gain through exercise and proper diet, and limit alcohol consumption to 1 drink a day or less. For women already at a high risk, their risk of developing breast cancer can be reduced by about 50% by taking a drug called Tamoxifen for five years. Tamoxifen has some common side effects (like hot flashes and vaginal discharge), which are not serious and some uncommon side effects (like blood clots, pulmonary embolus, stroke, and uterine cancer) which are life threatening. Tamoxifen isn't widely used for prevention, but may be useful in some cases. There are limited data suggesting that vitamin A may protect against breast cancer but further research is needed before it can be recommended for prevention. Other things being investigated include phytoestrogens (naturally occurring estrogens that are in high numbers in soy), vitamin E, vitamin C, and other drugs. Further testing of these substances is also needed before they can be recommended for breast cancer prevention. Right now, the most important thing any woman can do to decrease her risk of dying from breast cancer is to have regular mammogram
screening, learn how to perform breast self exams, and have a regular physical examination by their physician.
2.1.4 What are the Signs of Breast Cancer?
Unfortunately, the early stages of breast cancer may not have any symptoms. This is why it is important to follow screening recommendations. As a tumor grows in size, it can produce a variety of symptoms including:
• lump or thickening in the breast or underarm • change in size or shape of the breast
• nipple discharge or nipple turning inward • redness or scaling of the skin or nipple • ridges or pitting of the breast skin
2.1.5 What Screening Tests are available?
The earlier that a breast cancer is found; the more likely it is that treatment can be curable. For this reason, we screen for breast cancer using mammograms, clinical breast exams, and breast self-exams. Screening mammograms are simply x-rays of each breast. The breast is placed between two plates for a few seconds while the x-rays are taken. If something appears abnormal, or better views are needed, magnified views or specially angled films are taken during the mammogram. Mammograms often detect tumors before they can be felt and they can also identify tiny specks of calcium that could be an early sign of cancer. Regular screening mammograms can decrease the mortality of breast cancer by 30%. The majority of breast cancers are associated with abnormal mammographic findings. Woman should get a yearly
mammogram starting at age 40 (although some groups recommend starting at 50), and women with a genetic mutation that increases their risk or a strong family history may want to begin even earlier.
Between the ages of 20 and 39, every woman should have a clinical breast exam every 3 years; and after age 40 every woman should have a clinical breast exam done each year. A clinical breast exam is an exam done by a health professional to feel for lumps and look for changes in the size or shape of your breasts. During the clinical breast exam, you can learn how to do a breast self-exam. Every woman should do a self breast exam once a month, about a week after her period ends. If you find any changes in your breasts, you need to contact your doctor. About 15% of tumors are felt but cannot be seen by regular mammographic screening.
There are some experimental screening modalities that are currently being studied. These include MRI, ductal lavage, ultrasound, optical tomography, PET scan, and digital mammograms.
2.2 Breast MR Imaging
2.2.1 Breast Positioning in MRI?
Magnetic resonance medical imaging is very important issue in the clinical treatment of patients. Medical information detail in magnetic resonance is more than that available in other imaging methods such as mammogram, computed tomography (X-ray CT) etc. due to the fact that the magnetic resonance technique consists of four separate components: density of the nuclear species, two relaxation time (T1 and T2), and motion.
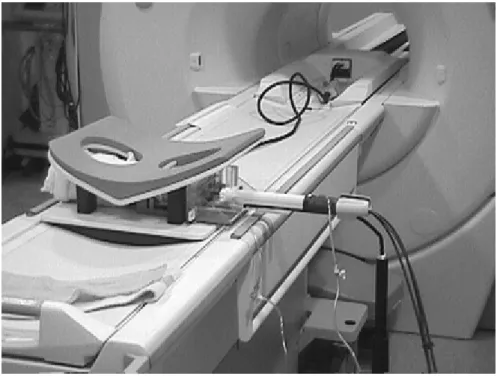
Figure 2.2 MR imaging unit
MR uses magnetic energy and radio waves to create cross-sectional images or "slices" of the human body. The main component of most MR systems is a large tube shaped or cylindrical magnet. Also now available are MR systems with a C-shaped magnet or other type of open design. The strength of the MR systems magnetic field is measured in metric units called "Tesla". Most of the cylindrical magnets have strength between 0.5 and 1.5 Tesla and most of the Open or C-shaped magnets have
a magnetic strength between 0.01 and 0.35 Tesla. A 1.5 Tesla MR system has a magnetic field 30,000 times stronger than the pull of gravity on the earth's surface. The patient aperture or bore of the cylindrical magnet is usually between 55 cm and 65 cm wide (21.6" to 25.6") and they have a total end to end length of 160 cm to 260 cm (5‘ 3" to 8' 6"). Approximately 3% of MR patients suffer from claustrophobia and may not tolerate an MR exam in a traditional cylindrical MR system.
Figure 2.4 MR examination
These patients may now have the option of having an MR study with an Open MR system where typically many sides of the system are open and claustrophobic anxiety is lessened.
To begin the MR examination, the patient is positioned on a special table and positioned inside the MR system opening where the magnetic field is created by the magnet. Each total MR examination typically is comprised of a series of 2 to 6 sequences, with each sequence lasting between 2 and 15 minutes. An "MR sequence" is an acquisition of data that yields a specific image orientation and a specific type of image appearance or "contrast." Thus a typical exam can last for a total of ten
minutes to an hour, depending on the type of exam being run and the MR system being used.
During the examination, a radio signal is turned on and off, and subsequently the energy which is absorbed by different atoms in the body is echoed or reflected back out of the body. These echoes are continuously measured by the MR scanner and a digital computer reconstructs these echoes into images of the body. The tapping heard during the MR exam is created when "gradient coils" are switched on and off to measure the MR signal reflecting back out of the patient's body. A benefit of M RI is that it can easily acquire direct views of the body in almost any orientation, while CT scanners typically acquire images perpendicular to the long body axis.
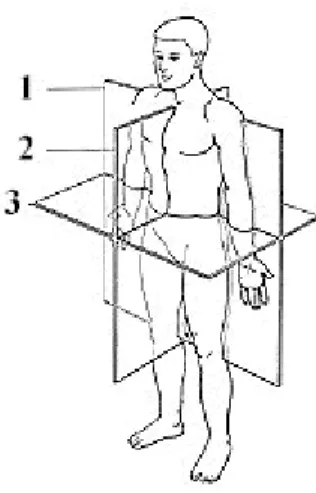
The following diagram shows the three main planes of acquisition used in MR imaging.
Medical images taken of the human body are acquired or displayed in three main orientations:
1. Coronal orientation: in a cross section (plane), for example, across the shoulders, dividing the body into front and back halves
2. Sagittal orientation: in a cross section (plane), for example, down the middle, dividing the body into left and right halves
3. Axial orientation: in a cross section (plane), perpendicular to the long axis of the body, dividing the body into upper and lower halves
Views which are combinations of the above three orientations (called oblique views) can also be directly acquired with the MR system. These oblique views are especially important for orthopedic and sports medicine applications when tendons and ligaments that run at oblique angles need to be clearly imaged.
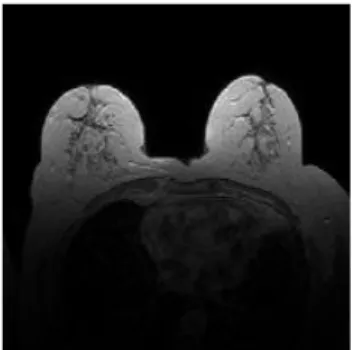
(a) Sagittal breast image (b) Axial breast image (c) Coronal brain image Figure 2.6 Sagittal, Axial and Coronal MR images
2.2.2 MR Image Type (Dicom Files)
The Digital Imaging and Communications in Medicine (DICOM) standard was created by the National Electrical Manufacturers Association (NEMA) to aid the distribution and viewing of medical images, such as CT scans, MRIs, and ultrasound.
A single DICOM file contains both a header (which stores information about the patient's name, the type of scan, image dimensions, etc), as well as all of the image data (which can contain information in three dimensions). This is different from the popular Analyze format, which stores the image data in one file (*.img) and the header data in another file (*.hdr). Another difference between DICOM and Analyze is that the DICOM image data can be compressed (encapsulated) to reduce the image size. Files can be compressed using lossy or lossless variants of the JPEG format, as well as a lossless Run-Length Encoding format (which is identical to the packed-bits compression found in some TIFF format images).
DICOM is the most common standard for receiving scans from a hospital. Neuroimagers and neuropsychologists who wish to use SPM to normalize scans to stereotaxic space will need to convert these files to Analyze format.
Figure 2.7 shows an example dicom file. The following information is about the dicom file.
Figure 2.7 An example breast dicom file
strF = 'D:\Tez
Calismalari\biomedical\ThesisStudy\Documentation\FatmaAydin_29_6'; info = dicominfo(strF);
>> info info = Filename: [1x72 char] FileModDate: '21-Dec-2004 00:14:42' FileSize: 561436 Format: 'DICOM' FormatVersion: 3 Width: 512 Height: 512 BitDepth: 12 ColorType: 'grayscale' SelectedFrames: [] FileStruct: [1x1 struct] StartOfPixelData: 37122 FileMetaInformationGroupLength: 208 FileMetaInformationVersion: [2x1 uint8] MediaStorageSOPClassUID: '1.2.840.10008.5.1.4.1.1.4' MediaStorageSOPInstanceUID: '1.3.12.2.1107.5.2.6.22697.4.0.13475114029872032' TransferSyntaxUID: '1.2.840.10008.1.2.1' ImplementationClassUID: '1.2.840.113619.6.48.2' ImplementationVersionName: 'SHS_MV300_VA40B' SourceApplicationEntityTitle: 'MagicView 300' SpecificCharacterSet: 'ISO_IR 100' ImageType: 'ORIGINAL\PRIMARY\M\ND' SOPClassUID: '1.2.840.10008.5.1.4.1.1.4'
SOPInstanceUID: '1.3.12.2.1107.5.2.6.22697.4.0.13475114029872032' StudyDate: '20041217' SeriesDate: '20041217' AcquisitionDate: '20041217' ContentDate: '20041217' StudyTime: '195522.234000' SeriesTime: '201945.000000' AcquisitionTime: '201808.999981' ContentTime: '201951.828000' AccessionNumber: '' Modality: 'MR' Manufacturer: 'SIEMENS'
InstitutionName: 'ISTANBUL UNI. TIP FAK.'
InstitutionAddress: 'MILLET CAD. , ISTANBUL, ISTANBUL, 34390, TURKEY' ReferringPhysicianName: [1x1 struct] StationName: 'MRC22697' StudyDescription: 'ITF_^meme' SeriesDescription: 't1_fl3d_tra_dyn' ManufacturerModelName: 'Symphony' ReferencedPerformedProcedureStepSequence: [1x1 struct] ReferencedImageSequence: [1x1 struct] PatientName: [1x1 struct] PatientID: '5122 RU' PatientBirthDate: '19481217' PatientSex: 'F'
PatientAge: '056Y' PatientWeight: 77 PatientComments: 'MEME' ScanningSequence: 'GR' SequenceVariant: 'SP' ScanOptions: '' MRAcquisitionType: '3D' SequenceName: '*fl3d1' AngioFlag: 'N' SliceThickness: 2.5000 RepetitionTime: 9.8000 EchoTime: 4.7600 NumberOfAverages: 1 ImagingFrequency: 63.7447 ImagedNucleus: '1H' EchoNumber: 0 MagneticFieldStrength: 1.4940 NumberOfPhaseEncodingSteps: 218 EchoTrainLength: 1 PercentSampling: 85.1563 PercentPhaseFieldOfView: 100 PixelBandwidth: 150 DeviceSerialNumber: '22697'
SoftwareVersion: 'syngo MR 2002B 4VA21A' ProtocolName: 't1_fl3d_tra_dyn'
DateOfLastCalibration: '20041208' TimeOfLastCalibration: '110525.000000' TransmitCoilName: 'Body' AcquisitionMatrix: [4x1 uint16] InPlanePhaseEncodingDirection: 'ROW' FlipAngle: 25 VariableFlipAngleFlag: 'N' SAR: 0.5006 dBdt: 0 PatientPosition: 'HFP' StudyInstanceUID: '1.3.12.2.1107.5.2.6.22697.4.0.13378210990561923' SeriesInstanceUID: '1.3.12.2.1107.5.2.6.22697.4.0.13475062238057585' StudyID: '1' SeriesNumber: 10 AcquisitionNumber: 5 InstanceNumber: 29 ImagePositionPatient: [3x1 double] ImageOrientationPatient: [6x1 double] FrameOfReferenceUID: '1.3.12.2.1107.5.2.6.22697.20041217195818890.0.0.0' PositionReferenceIndicator: '' SliceLocation: 35.5155 SamplesPerPixel: 1 PhotometricInterpretation: 'MONOCHROME2' Rows: 512 Columns: 512
PixelSpacing: [2x1 double] BitsAllocated: 16 BitsStored: 12 HighBit: 11 PixelRepresentation: 0 SmallestImagePixelValue: 0 LargestImagePixelValue: 405 WindowCenter: 210 WindowWidth: 495 WindowCenterWidthExplanation: 'Algo1'
Private_0029_10xx_Creator: 'SIEMENS CSA HEADER' Private_0029_11xx_Creator: 'SIEMENS MEDCOM HEADER' Private_0029_1008: 'IMAGE NUM 4'
Private_0029_1009: '20041217' Private_0029_1010: [5319x1 uint8] Private_0029_1018: [2x1 uint8] Private_0029_1019: [8x1 uint8] Private_0029_1020: [29244x1 uint8] Private_0029_1131: [14x1 uint8] Private_0029_1134: [12x1 uint8]
RequestedProcedureDescription: 'ITF_ meme' PerformedProcedureStepStartDate: '20041217' PerformedProcedureStepStartTime: '195522.234000' PerformedProcedureStepID: '40133782116'
3 SEGMENTATION OF MR IMAGES OF BREAST AND
RELATED WORK
3.1 Region Based Thresholding Method
Magnetic resonance medical imaging is very important issue in the clinical treatment of patients. Medical information detail in magnetic resonance is more than that available in other imaging methods such as mammogram, computed tomography (X-ray CT) etc. due to the fact that the magnetic resonance technique consists of four separate components: density of the nuclear species, two relaxation time (T1 and T2), and motion.
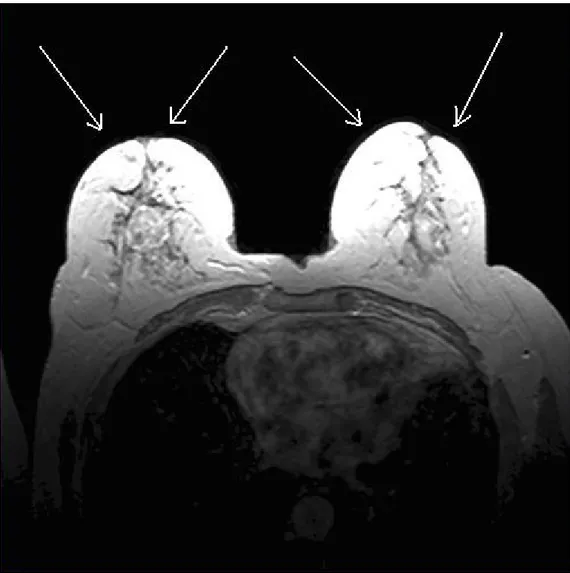
This study considers image data from dynamic contrast enhanced breast MR images. Contrast agents play very important role in Magnetic Resonance Imaging (MRI) because of being used in medical imaging to change the signal value between objects and background. The contrast agent is “Gadolinium-diethylene-triamine-pentacetic acid [Gd-DTPA]” in our MR images. In background of MR breast images, there are little free protons which produces a near-zero regions. While crossing from the background region, a great increase in the pixel values appear and this means that the boundary of the breast begins to be identified in MR image. Since the breast has non-rigid structure and the sequence artifacts which are being resulted from patient motion, segmentation is very complicated. However, sequence artifacts may be minimized easily by using global registration techniques.
3.2 Noise Reduction
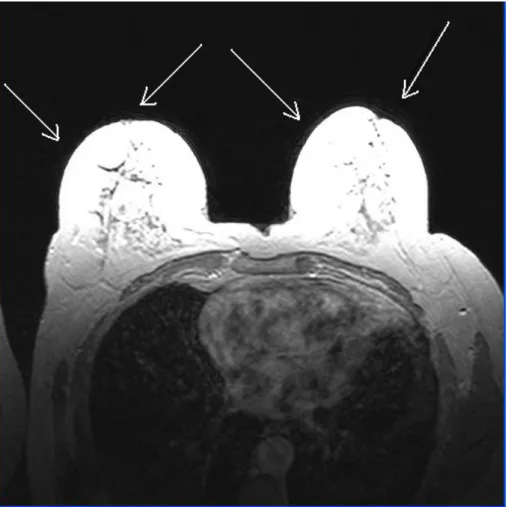
Figure 3.2 shows the noise (artifacts) on breast boundary. These artifacts cause segmentation of the breast image unsuccessfully. For this reason, removing this noise from image background is very important. There are valuable filtering operations to reduce noise in image processing. In our study, we have examined the non-linear and linear spatial filtering methods. The following titles show reduction of noise from the image background.
3.2.1 Linear Spatial Filtering
Linear Spatial Filtering is the process of moving the center of the filter mask from pixel to pixel in an image. It consists of two processes: correlation and convolution. Correlation is the process of passing the mask by the image array. Convolution is the same process, except that filter mask is rotated by prior to passing it by the image array.
0
180
We have considered the simple 4 * 4 filter which is proportional to an averaging filter. Then, we have applied the correlation process. Figure 3.2 shows the result of performing the filtering operation.
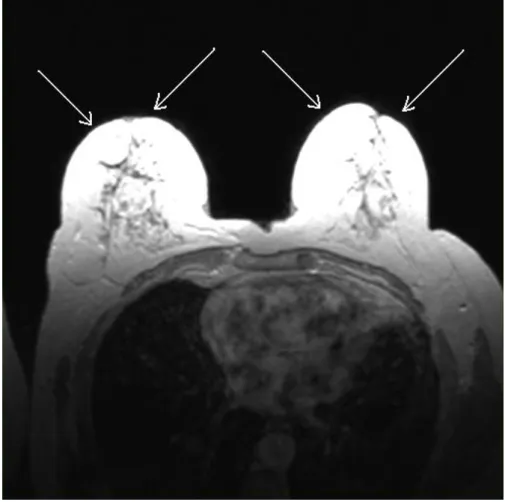
3.2.2 Non-Linear Spatial Filtering
Nonlinear spatial filtering is based on neighborhood operation also, and the mechanics of defining m x n neighborhoods by sliding the center point through an image are the same as in linear filtering. Figure 3.3 shows the result of performing the filtering operation.
Figure 3.3 the result of performing the non-linear filtering operation.
When we compared the effect of linear spatial filtering with the effect of non-linear spatial filtering for our MR images, nonlinear filtering methods is more suitable and effective. So, to reduce the noise effect of sequence artifacts, a 3 x 3 x 3 median filter
is applied to the image and the near-zero intensity values in the background are set to zero intensity value.
3.3 Otsu’s Thresholding Method
Secondly, a proper threshold values is estimated from the histogram of the filtered image. One of the well-known methods is Otsu’s thesholding method among thresholding based methods. [1] This method is described as follows:
1. To examine the formulation, start by treating the normalized histogram as a discrete probability density function, as in
n n r
pr( q)= q =q 0,1,2,...,L−1 (3.1)
: Total number of pixels in the image n
q
n : Number of pixels that have intensity level rq
: Total number of possible intensity levels in the image. L
2. A threshold k is chosen such that is the set of pixels with levels
[0,1,……,k-1] and is the set of pixels with levels [k,k+1,…..,L-1]. 0
C
1
C
3. Threshold value k maximizes the between-class variance , which is
defined as 2 b σ 2 1 1 2 0 0 2 ) ( ) ( T T b ω μ μ ω μ μ σ = − + − (3.2) where
∑
− (3.3) = = 1 0 0 ( ) k q q q r p ω
∑
− (3.4) = = 1 1 ( ) L k q q q r p ω∑
− (3.5) = = 1 0 0 ( )/ 0 k q q q r qp ω μ∑
− (3.6) = = 1 1 ( )/ 1 L k q q q r qp ω μ∑
− (3.7) = = 1 0 ) ( L q q q T qp r μIn this study, we take the threshold value for our proposed method using Otsu’s thresholding method. But, the proposed method uses the thresholding value in different manner. While Otsu’s method and Fuzzy C Means based thresholding method which is the other test method in this study and the rest of all other thresholding methods create a binary image (binarization), our method does not produce a binary image. Therefore, segmentation process does not require binary mask image to represent the thresholded image. It creates segmented image directly. The steps of the proposed method are explained in next section.
3.4 Fuzzy C-Means based Thresholding Method
Fuzzy c-means is the clustering method which finds number of clusters in the data set. Data set is size M-by-N, where M is the number of data points and N is the number of coordinates for each data point. This method (developed by Dunn in 1973[3] and improved by Bezdek in 1981[4] is frequently used in pattern recognition. It is based on minimization of the following objective function:
∑∑
(3.8) = = − = N i C j j i m ij m x c J 1 1 2 || || μwhere m is any real number greater than 1, μij is the degree of membership of in
the cluster j, is the of d-dimensional measured data, is the d-dimension center of the cluster, and || * || is any norm expressing the similarity between any measured data and the center.
i x
i
x ith cj
Fuzzy partitioning is carried out through an iterative optimization of the objective function shown above, with the update of membership μ and the cluster centers ij
by: j c , || || || || 1 1 2 2 2
∑
⎟⎟⎞ − ⎜ ⎜ ⎛ − − = C m j i ij c x c x μ 1 = ⎝ ⎠ k i k∑
∑
= = = N i m ij N i i m ij j x c 1 1 μ μ (3.9)This iteration will stop when max
{
|μ( +1) −μ(k)|}
<ε,ij k
ij
ij where ε is a termination
criterion between 0 and 1, whereas k are the iteration steps. This procedure converges to a local minimum or a saddle point of jm.
The algorithm is composed of the following steps:
a. Initialize U =
[ ]
μij matrix, U(0);b. At k-step: calculate the centers vectors k
[ ]
j c
∑
∑
= = = N i m ij N i i m ij j x c 1 1 μ μ (3.10) c. Update (k), (k+1), U U , || || || || 1 1 1 2 2 2∑
= − ⎟ ⎟ ⎠ ⎞ ⎜ ⎜ ⎝ ⎛ − − = C k m k i j i ij c x c x u (3.11)d. If || (k+1) − (k) ||<ε then stop; otherwise return to step 2.
U U
Fuzzy C-Means based thresholding method finds the optimum threshold by using fuzzy c-means clustering. An image which will be used as input must be transformed into x*y*z matrix, where x*y is the dimensions of image and z =1 for a grey level image. The clustering process stops when the maximum number of iterations is reached, or when the objective function improvement between two consecutive iterations is less than the minimum amount of improvement specified.
Fuzzy c-means based thresholding method takes the binary form of the breast image and segmentes the image using threshold value which is founded by using this method.
3.5 The steps of the algorithm
Main objective of our proposed method is to partition MR breast images into two regions. Boundaries in each region are found by evaluating the discontinuities in intensity levels depending on the threshold value.
Let R represent the image area. R is divided into sub regions, R1 & R2 such that
i (3.12) i
R
R
2 1 == U
R1 R2 RFigure 3.4 Regions R1 & R2
R1∩ R2=Ø (3.13) R1 and R2 are connected to each other.
The most significant aspect of this method is to analyze the segmentation problem in smaller problem domains. Therefore, the discontinuity and similarity of the grey levels of an image can be tested in more detail.
The proposed algorithm is summarized as follows:
Step 1. Automatic threshold value is calculated by using iterative procedure. This
value is called “level”. Middle point is determined as a reference point in the image. Image is scanned vertically from reference point. First point, which its intensity value is greater or equal to level, is identified and called b. Then, image is scanned vertically from that point. Second point, which its intensity value is smaller than level, is identified and called c. Average of these points are calculated and set as splitting reference point. This point is called a. Fig. 3.5 illustrates these points.
level : threshold value m : row dimension n : column dimension reference point : m/2
x : distance from reference point to b. y : distance from point b to point c.
first point : b second point : c splitting reference point : a
x y a= + b c y= − (3.14) 2
Step 2. Image is divided into two regions (R1 & R2), by taking splitting reference
point a as reference. It is shown in Figure 3.6.
R1 region is segmented easily by using classical segmentation methods. Segmentation problems appear due to the contrasted different intensity values on a uniform background and different non-trivial structures in R2 region. So, third step is for R2.
Step 3. Two different procedures are applied in R2. Following steps are for these
3.1 R2 image is scanned from point a to the right while the intensity values are
greater than “0” value horizontally. Automatically, first point, which its intensity value is equal to “0”, is identified and called “T1”.
R2 image is scanned again from point a to the left while the intensity values are greater than “0” value horizontally. Automatically, second point, which its intensity value is equal to “0”, is identified and called “T2”.
After determining T1 and T2 points, the image is scanned from point a to point T1and from point a to T2 vertically. Intensity values, which are greater than or equal to level, are identified. Pixels below these points are set to “0” value and the regions which include “0” pixel values become a part of background. Figure 3.7 shows scanning process which is explained in step 3.1.
3.2 R2 image is scanned from point T1 to the end of row (on the right) and from T2
point to the end of row (on the left) vertically. Because of the fact that the intensity values of top points on the right and on the left are “0”, first set of points which includes intensity values that are greater than “0” is identified.
Image is scanned again vertically from the points in the first set to determine the points which their intensity values that are greater than or equal to level. Pixels which are standing below these points in the second set are set to “0” value and the regions which include these pixel values become the part of background. Fig. 3.8 shows scanning process which is explained in step 3.2.
Step 4. Regions (R1 & R2) are merged into one region. Noise reduction methods are
3.6 Experimental Results
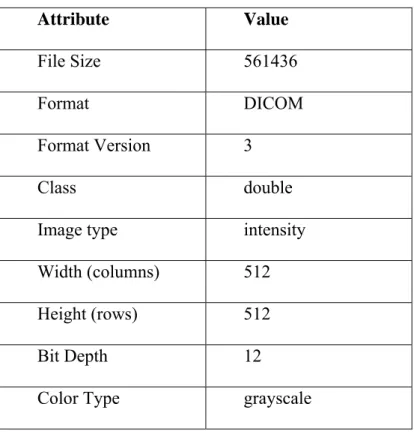
Breast images used in this study have matrix size 512 x 512 pixels and Table 3.6 shows some information about breast images.
Attribute Value
File Size 561436
Format DICOM
Format Version 3
Class double
Image type intensity
Width (columns) 512
Height (rows) 512
Bit Depth 12
Color Type grayscale
Table 3.6 Properties of MR breast images.
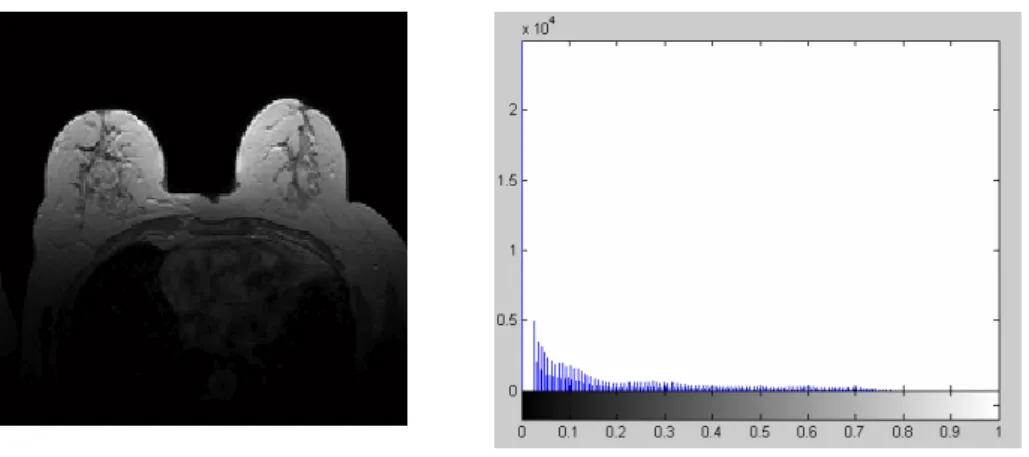
Fig. 3.10 and Fig. 3.11 show the histogram of the original image and the original image which is used in order to evaluate the performance of our proposed method respectively.
Fig. 3.10 An experimental image and corresponding histogram of experimental image
We have compared our method with two others: Otsu’s thresholding method (Otsu, 1979), and Fuzzy C Means based thresholding method. In this study, Otsu's method calculates threshold value better than fuzzy c-means based thresholding method on MR breast images. Our method does not produce a binary image. For this reason, the number of operations to segment a MR breast image is decreased and any data loss, which can be caused by morphological operations, is prevented because of the fact that our method does not consist of any morphological operations. This property shows that the representation of the segmented boundary is same as the boundaries of the breast in the proposed method. In other methods, approximate boundary to the breast wall is represented and the segmentation is realized according to this approximation.
The thresholded and segmented images using the proposed method and other two methods are shown vertically in Fig. 3.11, Fig. 3.12, and Fig. 3.13. According to expert opinions, segmentation by the proposed method appears to be better than the others as shown in Fig. 3.11, Fig. 3.12, and Fig. 3.13.
Otsu’s Threshoding Fuzzy C Means based Thresholding
The Proposed Method
a
Original Original Original
b
Thresholded Thresholded Thresholded
c
Morph. Closing Morph. Closing Noise Reduction
d
Segmented Segmented Segmented
Otsu’s Threshoding Fuzzy C Means based Thresholding
The Proposed Method
a
Original Original Original
b
Thresholded Thresholded Thresholded
c
Morph. Closing Morph. Closing Noise Reduction
d
Segmented Segmented Segmented
Otsu’s Threshoding Fuzzy C Means based Thresholding
The Proposed Method
a
Original Original Original
b
Thresholded Thresholded Thresholded
c
Morph. Closing Morph. Closing Noise Reduction
d
Segmented Segmented Segmented
Fig. 3.13
Fig. 3.11, Fig. 3.12, and Fig. 3.13 Segmentation process for MR breast images. Row a shows Original images. Row b shows Thresholded images. Row c shows Operations on the thresholded images. Row d shows Segmented images.
4 CONCLUSIONS
In this thesis, several segmentation methods for segmenting of axial MR breast images, based on pixel intensity, have been presented. In third section, a comprehensive review of existing methods was first undertaken to establish the progress of knowledge in that area and the current state of the art. After the analysis of existing work, new algorithm was proposed to segment the MR image into its background, noise and breast tissue regions. Region based thresholding method which was proposed by this thesis is applicable to axial MR breast images. The proposed algorithm method is based on evaluating the discontinuity and similarity of pixel values within each region depending on the threshold value. The qualitative results show that the proposed technique outperforms the existing methods. This result was also confirmed by the experts. In the future, we will extend the method and we will compare our method with other methods quantitatively.
REFERENCES
[1] Digital Image Processing with Matlab, Rafael C. Gonzalez, Richard E. Woods, Steven L. Eddins.
[2] Agus Zanial Arifin, Akira Asano, Image segmentation by histogram thresholding using hierarchical cluster analysis, Pattern Recognition Letters, 2006.
[3] Thorsten Twellmann, Oliver Lichte, Tim W. Nattkemper, An Adaptive Tissue Characterization Network for Model-Free Visualization of Dynamic Contrast-Enhanced Magnetic Resonance Image Data, IEEE Transactions on Medical Imaging, Vol. 24, No. 10, October 2005.
[4] Dunn, J. C., “A Fuzzy Relative of the ISODATA Process and Its Use in Detecting Compact Well-Separated Clusters,” Journal of Cybernetics, Vol. 3, 32-57, 1973.
[5] Bezdek, J. C., Pattern Recognition with Fuzzy Objective Function Algorithms, Plenum Press, New York, 1981.
[6] An algorithm for extracting the skin surface in MR breast images, Michael A. Wirth, Rui Wang, Alexei Stapinski, Dept. of Computing and Information Science, University of Guelph, Guelph, Canada, Scientific Meeting of the
International Society of Magnetic Resonance in Medicine, 2003, Toronto, Canada.
[7] An Adaptive Tissue Characterization Network for Model-Free Visualization of Dynamic Contrast-Enhanced Magnetic Resonance Image Data, Thorsten Twellmann*, Oliver Lichte, and Tim W. Nattkemper, IEEE TRANSACTIONS ON MEDICAL IMAGING, VOL. 24, NO. 10, OCTOBER 2005, *T. Twellmann is with the Applied Neuroinformatics Group, Faculty of Technology, Bielefeld University, P.O. Box 100131, 33501 Bielefeld, Germany, O. Lichte and T. W. Nattkemper are with the Applied Neuroinformatics Group, Faculty of Technology, Bielefeld University, 33501 Bielefeld, Germany, Digital Object Identifier 10.1109/TMI.2005.854517
[8] Meyers, D., Skinner, S., Sloan, K., "Surfaces from contours", ACM Transactions on Graphics, 1992, Vol.11, pp.228-258.
[9] Maintz, J.B.A., van den Elsen, P.A. and Viergever, M.A., “Registration of 3D medical images using simple morphological tools,” Information Processing in Medical Imaging, 1997, Vol. 1230, pp. 204-217.
[10] Kittler, J., Illingworth, J., “Minimum error thresholding,” Pattern Recognition, 1986, Vol.19, pp.41-47.
[11] Soille, P. Morphological Image Analysis: Principles and Applications, Springer-Verlag, 1999, pp. 173-174.
[12] Detection and Quantification of Breast Tumor Necrosis with MR Imaging: Value of the Necrosis-Avid Contrast Agent Gadophrin-3, Academic Radiology,
Volume 10, Issue 5, May 2003, Pages 484-490, Stephan Metz, Heike E.
Daldrup-Link, Thomas Richter, Christoph Räth, Wolfgang Ebert, Marcus Settles, Ernst J. Rummeny, Thomas M. Link and Morand Piert
[13] Breast imaging technology: Application of magnetic resonance imaging to angiogenesis in breast cancer, Martin O Leach, CRC Clinical Magnetic Resonance Research Group, The Institute of Cancer Research and The Royal Marsden NHS Trust, Sutton, Surrey, UK
[14] Color-coded automated signal intensity-curve for detection and characterization of breast lesions: Preliminary evaluation of a new software for MR-based breast imaging, International Congress Series, Volume 1281, May 2005, Pages
1081-1086, Federica Pediconi, Carlo Catalano, Fiammetta Venditti, Mauro
Ercolani, Luigi Carotenuto, Simona Padula, Antonella Roselli and Roberto Passariello
[15] Identification Of Regions Of Interest In Digital Mammograms, Sameer Singh, Reem Al-Mansoori, R. 2000. Identification of Regions of Interest in Digital Mammograms. Journal of Intelligent Systems 2000 10: issue 2.
[16] S. G. Orel and M. D. Schnall, “MR imaging of the breast for the detection, diagnosis, and staging of breast cancer,” Radiology, vol. 220, no.13–30, 2001. [17] Computer aided detection of microcalcifications in digital
mammograms, Computers in Biology and Medicine, Volume 30, Issue 5, 1
September 2000, Pages 267-286, Giuseppe Boccignone, Angelo Chianese and
Antonio Picariello.
[18] Artificial neural networks for early detection and diagnosis of cancer Cancer
Letters, Volume 77, Issues 2-3, 15 March 1994, Pages 79-8, Steven K. Rogers,
Dennis W. Ruck and Matthew Kabrisky.
[19] Mammographic feature enhancement by computerized image processing, Computer Methods and Programs in Biomedicine, Volume 27,
Issue 1, July-August 1988, Pages 23-35, Atam P. Dhawan and Eric Le Royer.
[20] Image segmentation feature selection and pattern classification for mammographic microcalcifications, Computerized Medical Imaging and
Graphics, Volume 29, Issue 6, September 2005, Pages 419-429, J.C. Fu, S.K.
Lee, S.T.C. Wong, J.Y. Yeh, A.H. Wang and H.K. Wu.
[21] Comparative analysis of logistic regression and artificial neural network for computer-aided diagnosis of breast masses, Academic Radiology, Volume 12,
Issue 4, April 2005, Pages 487-495, Jae H. Song, Santosh S. Venkatesh, Emily
A. Conant, Peter H. Arger and Chandra M. Sehgal.
[22] Computer aided diagnosis of breast cancer in digitized mammograms,
September-October 2002, Pages 309-319, I. Christoyianni, A. Koutras, E. Dermatas and
G. Kokkinakis.
[23] An evolutionary artificial neural networks approach for breast cancer diagnosis,
Artificial Intelligence in Medicine, Volume 25, Issue 3, July 2002, Pages 265-281, Hussein A. Abbass.
[24] Perceptron error surface analysis: a case study in breast cancer diagnosis,
Computers in Biology and Medicine, Volume 32, Issue 2, March 2002, Pages 99-109, Mia K. Markey, Joseph Y. Lo, Rene Vargas-Voracek, Georgia D.
Tourassi and Carey E. Floyd Jr.
[25] Feature extraction and classification of breast cancer on dynamic magnetic resonance imaging using artificial neural network, Cancer Letters, Volume 171,
Issue 2, 10 October 2001, Pages 183-191, Parviz Abdolmaleki, Lawrence
Danso Buadu and Hossein Naderimansh.
[26] Use of artificial neural networks (computer analysis) in the diagnosis of microcalcifications on mammography, European Journal of Radiology, Volume
39, Issue 1, July 2001, Pages 60-65, Christos Markopoulos, Efstratios Kouskos,
Konstantinos Koufopoulos, Vasiliki Kyriakou and John Gogas
[27] Model selection for a medical diagnostic decision support system: a breast cancer detection case, Artificial Intelligence in Medicine, Volume 20, Issue 3,
November 2000, Pages 183-204, David West and Vivian West.
[28] The Reliability Issue of Computer-Aided Breast Cancer Diagnosis, Computers
and Biomedical Research, Volume 33, Issue 4, August 2000, Pages 296-313,
Boris Kovalerchuk, Evangelos Triantaphyllou, James F. Ruiz, Vetle I. Torvik and Evgeni Vityaev.
[29] Generating concise and accurate classification rules for breast cancer diagnosis,
Artificial Intelligence in Medicine, Volume 18, Issue 3, March 2000, Pages 205-219, Rudy Setiono.
[30] Neural networks improve the prediction of survival in breast cancer, European
Journal of Cancer, Volume 34, Supplement 5, September 1998, Page S100, P.
J. Drew, P. Magee, L Bottaci, M. Menon, K. Heer, P. J. Carleton, J. N. Fox, J. R. T. Monson and M. J. Kerin.
[31] MR mammography of a primary squamous cell carcinoma of the breast: a case report , The Breast, Volume 12, Issue 3, June 2003, Pages 212-214, Mireille Van Goethem, Katrien Schelfout, Werner Jacobs, Inge Verslegers, Isabelle Biltjes, Hendrik De Raeve and Arthur De Schepper.
[32] Pre-operative MR-mammography in breast cancer patients, European Journal
of Surgical Oncology, Volume 25, Issue 2, April 1999, Pages 142-145, Carsten
Conrad, Mogens Thyge Corfitsen, Niels Gyldholm and Finn Lesak Christiansen.
[33] Mammographic case base applied for supporting image diagnosis of breast lesion, Expert Systems with Applications, Volume 30, Issue 1, January 2006,
Pages 93-108, Shin-Yuan Hung and Chin-Yu Chen.
[34] Neural network approach to the segmentation and classification of dynamic magnetic resonance images of the breast: Comparison with empiric and quantitative kinetic parameters, Academic Radiology, Volume 11, Issue 12,
December 2004, Pages 1344-1354, Botond K. Szabó, Peter Aspelin and Maria
Kristoffersen Wiberg.
[35] Breast imaging technology: Application of magnetic resonance imaging to angiogenesis in breast cancer, Martin O Leach, CRC Clinical Magnetic Resonance Research Group, The Institute of Cancer Research and The Royal Marsden NHS Trust, Sutton, Surrey, UK.
[36] Computer-Aided Diagnosis of Mammographic Masses, Trevor Hastie, Debra Ikeda, Robert Tibshirani, Departments of Preventive Medicine \& Biostatistics, University of Toronto.
[37] Magnetic resonance imaging as a diagnostic tool for breast cancer in premenopausal women, The American Journal of Surgery, Volume 190, Issue
4, October 2005, Pages 572-575, Heather Wright, Jay Listinsky, Alice Rim,
Melanie Chellman-Jeffers, Rebecca Patrick, Lisa Rybicki, Julian Kim and Joseph Crowe [38] http://imaginis.com/mri-scan/work.asp [39] http://www.cancer.org [40] http://www.breastcancer.org [41] http://www.oncolink.org [42] http://progressreport.cancer.gov
VITA
Fatih Kaleli was born in Kütahya. He received his B.S. degree in Computer Engineering from the Bahcesehir University in 2004. Since then he has been a research assistant in the Department of Computer Engineering. His main areas of interest are medical image processing, bioinformatics and mechatronics.