SHARP INCREASE IN NON-AGRICULTURAL UNEMPLOYMENT
Seyfettin Gürsel*, Gokce Uysaland Ayşenur AcarAbstract
Seasonally adjusted labor market data shows that non-agricultural unemployment rate increased by 0.3 percentage points in the period of September 2014 compared to the period of August 2014, and reached 12.8 percent. Even though employment in non-agricultural sectors increased, the increases could not counterbalance strong increases in non-agricultural labor force. Non-agricultural unemployment increased from 11.3 percent to 12.8 percent in the last year. The largest part of the increase occurred in the second part of 2014.
A 1.6 million increase in non-agricultural labor force
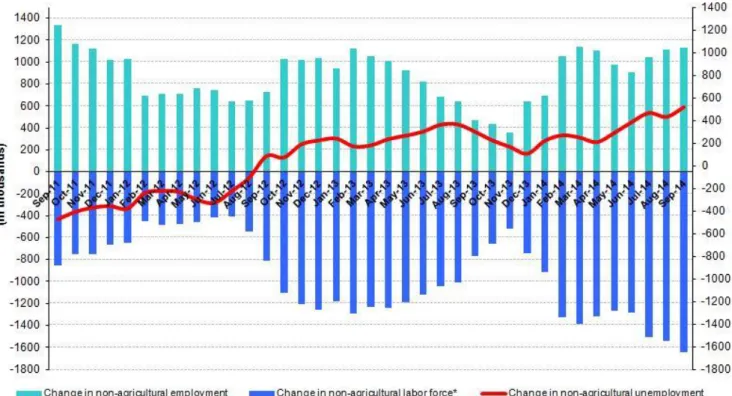
According to the data released by TurkSTAT, non-agricultural labor force increased by 1 million 648 thousand (7.5 percent) and non-agricultural employment increased by 1 million 132 thousand (5.8 percent) in the period of September 2014 (Figure 1). Consequently, the number of persons unemployed in non-agricultural sectors increased by 516 thousand. After observing annual increases of over 1.3 million in non-agricultural labor force since February 2014, there was an increase of over 1 million in the period of July 2014 as well. The annual increases in non-agricultural labor force are over 1.5 million during the last three periods (i.e. July, August,
September 2014). Non-agricultural labor force increased by 1.6 million in the period of September 2014, which was the largest annual increase.
Figure 1 Year-on-year changes in non-agricultural labor force, employment and unemployment
Source: TurkSTAT,Betam
*Prof. Dr. Seyfettin Gürsel, Betam, Director, [email protected]
Asst. Prof. Dr. Gokce Uysal, Betam, Vice Director, [email protected] Ayşenur Acar, PhD, Betam, Research Assistant, [email protected]
Labor Market Outlook:
December 2014
www.betam.bahcesehir.edu.tr
2
Rapid increase in non-agricultural unemployment
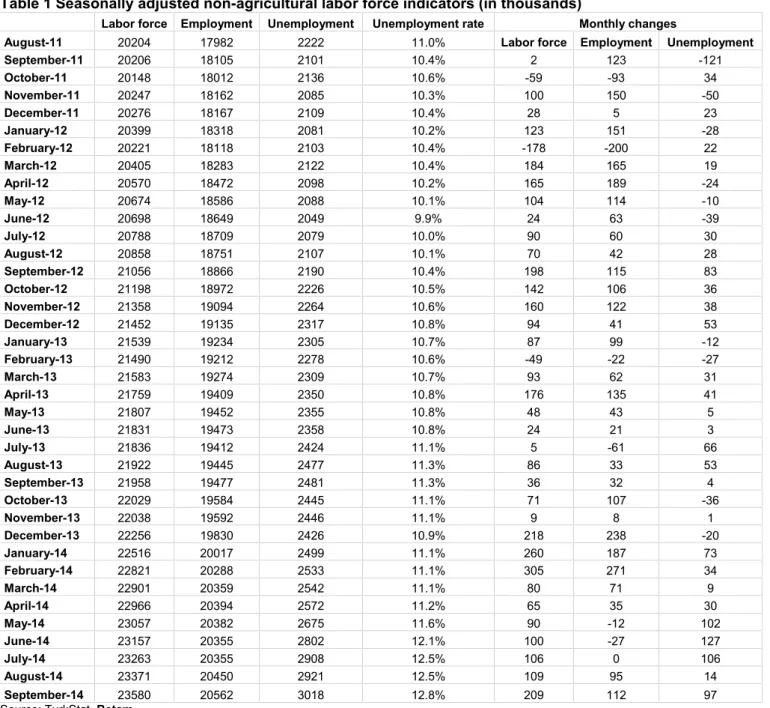
According to seasonally adjusted data, non-agricultural labor force increased by 209 thousand in the period of September 2014 compared to the period of August 2014, and reached 23 million 580 thousand (Figure 2, Table 1). Non-agricultural employment increased by 112 thousand and reached 20 million 562 thousand. Hence, the number of persons unemployed in non-agricultural sectors increased by 97 thousand and non-agricultural unemployment rate increased by 0.3 percentage point and reached 12.8 percent. Non-agricultural unemployment rate increased from 11.3 percent in the period of September 2013 to 12.8 percent in the period of September 2014, implying a 1.5 percentage points increase in one year. The increase has been accelerating since the period of April 2014.
Figure 2 Seasonally adjusted non-agricultural labor force, employment and unemployment
Source: TurkStat,Betam
Non-agricultural unemployment will slightly increase in the next period
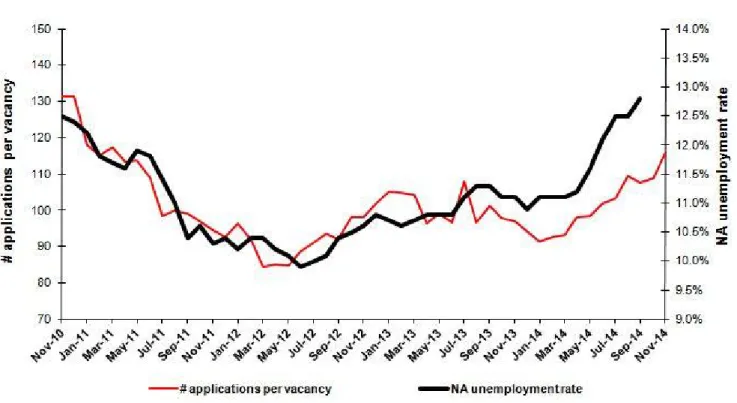
Our calculations based on the seasonally adjusted application per vacancy statistics calculated using Kariyer.net series are presented in Figure 3. Kariyer.net series have been accelerating since August 2014. Kariyer.net series indicate that non-agricultural unemployment continue to increase. The forecasting model of Betam indicates that increase in non-agricultural unemployment will slow down. Since the unemployment figures of October 2014 include the figures of September, October and November, we expect that non-agricultural unemployment will slightly increase in the next period.
Figure 3 Seasonally adjusted non-agricultural unemployment rate and application per vacancy
Source: Kariyer.net, TurkStat,Betam
Employment increases in non-agricultural sectors
Seasonally adjusted labor market series show that employment increased in all sectors (with an exception of agricultural employment) in the period of September 2014 (Table 2, Figure 4).1In this period, agricultural
employment decreased by 14 thousand. On the other hand, employment in manufacturing and service sectors increased by 49 thousand, while construction employment increased by 15 thousand. However, these increases could not counterbalance the increase in non-agricultural labor force.
1Employment in each sector is seasonally adjusted separately. Hence the sum of these series may differ from the seasonally adjusted series of
www.betam.bahcesehir.edu.tr
4
Figure 4 Employment by sectors (in thousands)2Source: TurkStat,Betam
Table 1 Seasonally adjusted non-agricultural labor force indicators (in thousands)
Labor force Employment Unemployment Unemployment rate Monthly changes
August-11 20204 17982 2222 11.0% Labor force Employment Unemployment
September-11 20206 18105 2101 10.4% 2 123 -121 October-11 20148 18012 2136 10.6% -59 -93 34 November-11 20247 18162 2085 10.3% 100 150 -50 December-11 20276 18167 2109 10.4% 28 5 23 January-12 20399 18318 2081 10.2% 123 151 -28 February-12 20221 18118 2103 10.4% -178 -200 22 March-12 20405 18283 2122 10.4% 184 165 19 April-12 20570 18472 2098 10.2% 165 189 -24 May-12 20674 18586 2088 10.1% 104 114 -10 June-12 20698 18649 2049 9.9% 24 63 -39 July-12 20788 18709 2079 10.0% 90 60 30 August-12 20858 18751 2107 10.1% 70 42 28 September-12 21056 18866 2190 10.4% 198 115 83 October-12 21198 18972 2226 10.5% 142 106 36 November-12 21358 19094 2264 10.6% 160 122 38 December-12 21452 19135 2317 10.8% 94 41 53 January-13 21539 19234 2305 10.7% 87 99 -12 February-13 21490 19212 2278 10.6% -49 -22 -27 March-13 21583 19274 2309 10.7% 93 62 31 April-13 21759 19409 2350 10.8% 176 135 41 May-13 21807 19452 2355 10.8% 48 43 5 June-13 21831 19473 2358 10.8% 24 21 3 July-13 21836 19412 2424 11.1% 5 -61 66 August-13 21922 19445 2477 11.3% 86 33 53 September-13 21958 19477 2481 11.3% 36 32 4 October-13 22029 19584 2445 11.1% 71 107 -36 November-13 22038 19592 2446 11.1% 9 8 1 December-13 22256 19830 2426 10.9% 218 238 -20 January-14 22516 20017 2499 11.1% 260 187 73 February-14 22821 20288 2533 11.1% 305 271 34 March-14 22901 20359 2542 11.1% 80 71 9 April-14 22966 20394 2572 11.2% 65 35 30 May-14 23057 20382 2675 11.6% 90 -12 102 June-14 23157 20355 2802 12.1% 100 -27 127 July-14 23263 20355 2908 12.5% 106 0 106 August-14 23371 20450 2921 12.5% 109 95 14 September-14 23580 20562 3018 12.8% 209 112 97
6
Table 2 Seasonally adjusted employment by sector (in thousands)Agriculture Manufacturing Construction Service Monthly changes
August-11 5452 4816 1758 11408 Agriculture Manufacturing Construction Service
September-11 5384 4866 1759 11480 -68 50 1 72 October-11 5415 4823 1679 11510 31 -43 -80 30 November-11 5406 4870 1670 11622 -9 47 -9 112 December-11 5329 4873 1635 11659 -77 3 -35 37 January-12 5333 4864 1709 11745 4 -9 74 86 February-12 5276 4808 1565 11746 -57 -56 -144 1 March-12 5222 4850 1580 11853 -54 42 15 107 April-12 5249 4930 1653 11890 27 80 73 37 May-12 5292 4908 1728 11951 43 -22 75 61 June-12 5249 4900 1748 12001 -43 -8 20 50 July-12 5259 4926 1741 12041 10 26 -7 40 August-12 5256 4892 1761 12097 -3 -34 20 56 September-12 5320 4911 1776 12179 64 19 15 82 October-12 5358 4917 1780 12274 38 6 4 95 November-12 5365 5003 1801 12289 7 86 21 15 December-12 5347 5051 1776 12309 -18 48 -25 20 January-13 5331 5073 1812 12349 -16 22 36 40 February-13 5298 5023 1800 12389 -33 -50 -12 40 March-13 5281 5083 1785 12406 -17 60 -15 17 April-13 5269 5176 1807 12425 -12 93 22 19 May-13 5207 5200 1754 12498 -62 24 -53 73 June-13 5178 5163 1788 12521 -29 -37 34 23 July-13 5193 5146 1737 12528 15 -17 -51 7 August-13 5216 5117 1753 12575 23 -29 16 47 September-13 5210 5096 1775 12607 -6 -21 22 32 October-13 5120 5090 1847 12647 -90 -6 72 40 November-13 5078 5064 1804 12725 -42 -26 -43 78 December-13 5061 5131 1894 12805 -17 67 90 80 January-14 5403 5232 1947 12838 342 101 53 33 February-14 5530 5359 2013 12915 127 127 66 77 March-14 5599 5365 1980 13013 69 6 -33 98 April-14 5563 5373 1906 13115 -36 8 -74 102 May-14 5562 5364 1863 13155 -1 -9 -43 40 June-14 5486 5332 1812 13210 -76 -32 -51 55 July-14 5411 5243 1818 13295 -75 -89 6 85 August-14 5368 5257 1852 13341 -43 14 34 46 September-14 5354 5306 1867 13390 -14 49 15 49