THE REPUBLIC OF TURKEY
BAHCESEHIR UNIVERSITY
PREDICTING
COMMERCIAL INTENT OF ONLINE CONSUMERS
USING MACHINE LEARNING TECHNIQUES
Master Thesis
METE ALPASLAN KATIRCIOGLU
THE REPUBLIC OF TURKEY
BAHCESEHIR UNIVERSITY
THE GRADUATE SCHOOLS OF NATURAL AND APPLIED
SCIENCES OF
COMPUTER ENGINEERING
PREDICTING
COMMERCIAL INTENT OF ONLINE
CONSUMERS USING
MACHINE LEARNING TECHNIQUES
Master ThesisMETE ALPASLAN KATIRCIOGLU
Thesis Supervisor: ASST. PROF. CEMAL OKAN SAKAR
ii
REPUBLIC OF TURKEY BAHCESEHIR UNIVERSITY
GRADUATE SCHOOL OF NATURAL AND APPLIED SCIENCES COMPUTER ENGINEERING
Name of thesis: PREDICTING COMMERCIAL INTENT OF ONLINE CONSUMERS USING MACHINE LEARNING TECHNIQUES
Name/Last Name of the Student: Mete Alpaslan KATIRCIOĞLU
Date of the Defense of Thesis: 05.01.2018
This thesis has been approved by the Graduate School of Natural and Applied Sciences.
Prof. Dr. Nafiz ARICA Graduate School Director I certify that this thesis meets all the requirements as a thesis for the degree of Master of Arts.
Asst. Prof. Dr. Tarkan AYDIN Program Coordinator This is to certify that we have read this thesis and we find it fully adequate in scope, quality and content, as a thesis for the degree of Master of Arts.
Examining Committee Members Signature
Thesis Supervisor ---
Asst. Prof. Dr. Cemal Okan ŞAKAR
Member ---
Assoc. Prof. Dr. M. Alper TUNGA
Member ---
Asst. Prof. Dr. Görkem SERBES
iii
ABSTRACT
PREDICTING COMMERCIAL INTENT OF ONLINE CONSUMERS USING MACHINE LERNING TECHNIQUES
Mete Alpaslan KATIRCIOGLU Computer Engineering
Thesis Supervisor: Asst. Prof. Cemal Okan Sakar January 2018, 35 pages
Consumers shopping activities on the internet turn out to be more important every year. Although the increase of e-commerce usage over the last few years has created potential in the market, most of the visitors still do not complete their online shopping process. This leads the online retailers the need for solutions to prevent the loss of their revenues. The aim of this study is to evaluate the actions taken by the visitors on e-commerce environment in real time and predicting the visitor’s shopping intent. The extracted features from page view data kept track during the visit along with some session and user information are fed to machine learning classification methods to build a model. Oversampling and feature selection preprocessing steps are used to enhance the performance and scalability of the classification methods. The results show that Multi-Layer Perceptron produces significantly higher accuracy and F1-score than Decision Tree and Support Vector Machines. Another finding is that although clickstream data obtained from the navigation path followed during the online visit convey important information about the purchasing intention of the visitor, combining them with session information-based features that possess unique information about the purchasing interest improves the success rate of the system.
Keywords: Online Consumer Behavior Analysis, Machine Learning, Google Analytics
iv
ÖZET
ÇEVRİMİÇİ TÜKETİCİLERİN MAKİNE ÖĞRENME TEKNİKLERİNİ KULLANARAK TİCARİ NİYET TAHMİNİ
Mete Alpaslan KATIRCIOGLU Bilgisayar Mühendisliği
Tez Danışmanı: Yrd. Doç. Dr. Cemal Okan Sakar Ocak 2018, 35 Sayfa
Tüketicilerin İnternetteki alışveriş faaliyetleri her yıl daha da önem kazanmaktadır. Son birkaç yıldır e-ticaret kullanımının artması piyasada potansiyel oluştursa da sanal perakendeciler hala alışveriş işlemlerini tamamlamayan site ziyaretçileriyle karşı karşıyadır. Bu durum, onların gelirlerinin kaybolmasını engellemeye yönelik çözümlere ihtiyaç duymalarına yol açmaktadır. Bu çalışmanın amacı, çevrimiçi perakendecilerde ziyaretçilerin aldığı aksiyonları belirli bir süre zarfında değerlendirilmesi ve ziyaretçinin alışveriş niyetinin tahmin edilmesidir. Ziyaret sırasında izlenen sayfa görüntüleme verileri özellikleri, oturum ve kullanıcı bilgileri ile birlikte çıkarılarak bir model oluşturmak için makine öğrenmede sınıflandırma yöntemlerinden beslenir. Sınıflandırıcıların performansını ve ölçeklenebilirliğini artırmak için aşırı örnekleme ve özellik seçimi önişleme adımları kullanılır. Sonuçlar, Çok Seviyeli Algılayıcılar ‘ın Karar Ağaçları ve Destek Vektör Makinelerine göre daha yüksek doğruluk ve F1-skoru ürettiğini göstermektedir. Başka bir bulgu, çevrimiçi ziyaret sırasında izlenen gezinme yolundan elde edilen tıklama bilgisi verisinin, ziyaretçinin satın alma niyeti ile ilgili önemli bilgileri taşıması rağmen, bu verinin satın alma ilgisi hakkında benzersiz bilgilere sahip olan oturum bilgisi temelli özellikler ile birleştirilmesi sistemin başarı oranını artırır.
Anahtar Kelimeler: Çevrimiçi Müşteri Davranışı Analizi, Makine Öğrenme, Google
v CONTENTS TABLES ... vi FIGURES ... vii ABBREVIATIONS ... viii 1. INTRODUCTION ... 1 1.1 GOAL OF THESIS ... 2 1.2 OUTLINE OF THESIS ... 3 2. LITERATURE REVIEW ... 4 3. MATERIALS ... 11 3.1 DATASET DESCRIPTION ... 11
3.2 DATA SET PREPARATION ... 20
4. METHODS ... 22
4.1 PREDICTION ... 22
4.1.1 Support Vector Machines (SVM) ... 22
4.1.2 Decision Trees (DT) ... 23
4.1.3 Multilayer Perceptron (MLP) ... 25
4.1.4 Oversampling ... 27
4.1.5 Feature Selection ... 27
4.2 CLASSIFICATION RESULTS ... 28
4.2.1 Results on Class Imbalanced Dataset ... 29
4.2.2 Results obtained with Oversampling ... 30
4.2.3 Results Obtained with Oversampling and Feature Selection ... 32
5. CONCLUSIONS ... 35
vi
TABLES
Table 3.1: Description of features in dataset………...11 Table 3.2: Visitor Session Information by Date………..13 Table 3.3: Visitor Page View Information………..13 Table 3.4: Numerical Features used in the User Behaviour Analysis Model…..16 Table 3.5: Page Types derived by URL………...17 Table 3.6: Categorical Features used in the User Behavior Analysis Model…..19 Table 4.1: Results obtained with Support Vector Machines………...29 Table 4.2: Results obtained with Decision Tree Classifier………..29 Table 4.3: Results obtained with Multilayer Perceptron Classifier……….29 Table 4.4: Results obtained with oversampling and Support Vector Machines
Classifier……….………...30 Table 4.5: Results obtained with oversampling and Decision Tree Classifier…31 Table 4.6: Results obtained with oversampling and Multilayer Perceptron
Classifier...31 Table 4.7: Summary of best results obtained with Classifiers……….…31 Table 4.8: Feature rankings obtained with filter feature selection methods.…...33 Table 4.9: Best results obtained using selected feature subsets by filters in the
vii
FIGURES
Figure 2.1: The constructive model of likelihood to abort an intended online
transaction………...7
Figure 3.1: Handling dataset inconsistency algorithm……….15
Figure 3.2: An example of data set………..……20
Figure 3.3: Header Section of Online Retailer Dataset………..……...…..21
viii
ABBREVIATIONS
ARHP : Association Rule Hypergraph Partitioning
DT : Decision Tree
HMM : Hidden Markov Model
MLP : Multilayer Perceptron
PACT : Profile Aggregations based on Clustering Transactions
SMOTE : Synthetic Minority Over Sampling Technique
SVM : Support Vector Machines
TNR : True Negative Rate
TPR : True Positive Rate
TRA : Theory of Reason Action
enormous volume of business transactions all over the world. Besides, it does not only introduce a new way of doing business, it also changes consumer lifestyle. Transition from in stores experience to online experience, e-commerce applications becomes a primary vehicle to search product attributes, compare prices, and then buy products from online retailers. Moreover, there are some platforms allows people to sell their products to one another directly. The new habits of buyers have had a great economic impact on online market, with $1,471 billion dollars spent roughly by 191 million buyers in 2014 in the United States alone. The increase of e-commerce usage over the last few years is created potential in the market as stated, statistics point out that although almost 95 percentage of internet users visit online retailers without purpose of actually making a transaction. Furthermore, even when consumers visit online retailers in purpose of making a purchase, many of them do not finish the transaction and abandon their purpose just prior to checkout. According to research, average rate of consumers who do not fulfill the process of shopping transaction is approximately 60-70 percentage in 2010 (Forrester Research, 2009). As research shows, it is important to measure this situation for online retailers since it express the difference between their profits or lost sales. Therefore, this leads to the need for solutions to understand and characterize consumer online commercial intent.
Many e-commerce and information technology companies invest in early detection and commercial intent prediction systems which imitates the behavior of a salesperson in virtual shopping environment [21, 22, 23]. Because in physical retailing, the salesperson can show different approaches to different shoppers by determining whether a person visiting the store intends to make a purchase, based on the experience and impressions he or she has gained over time. This experience has an important influence on the effective use of time, purchase conversion rates and sales figures [2].
In parallel with these efforts, some academic studies addressing the problem from different perspectives using machine learning methods have been proposed. While some of these studies deal with categorization of visits based on the user’s navigational patters [1, 2, 3, 4], others aim to predict the consumer behavior in real time and take
2
actions accordingly to improve the shopping cart abandonment and purchase conversion rates [5, 6, 7].
As a result, getting better understanding of consumer behavior would help both consumers and advertisers. For instance, knowing when consumers are ready to buy and how much they want to spend can make advertising campaigns more effective for advertisers in terms of advertising effectiveness and budget spending. On the other side, understanding these patterns can help the online shopping experience more effective for consumers as well. Thus, it can impact economy since consumer expenditures is a big part of it, even a small effectiveness gain will have significant impact on the overall economic activity.
Therefore, predicting commercial intent of online consumers is an important problem in e-commerce business that needs to be addressed.
1.1 GOAL OF THESIS
The goal of this thesis can be summed up as following two related parts;
One of them is to do a research and develop a methodology by building models for Online Consumer Commercial Intent Analysis. In this context, the mouse movements, the link and button click information that the user has on the screen and the tracking data of the pages visited will be obtained and the actions taken as the result of these data will be determined. Acceptable actions will be used as labels during pattern definition with supervised learning algorithms. Thus, when any user receives actions that match the predefined pattern, they will be tagged with the obtained pattern function and the action to be taken instantaneously will be determined. One of the difficulties in developing this model will be choosing the algorithm with the best accuracy and performance, which is appropriate to the pattern recognition algorithms, the data structures obtained from the users and the e-commerce system infrastructure during the implementation of the machine learning procedure. Another possible problem encountered in the analysis of the instantaneous consumer intent analysis is the problem of class imbalance. It is likely that the number of positive instances in which data abandonment actions are taken is less than the number of negative instances
3
representing all other actions. In this case, the results obtained will be evaluated with appropriate metrics instead of the accuracy rate that may lead to false evaluations.
1.2 OUTLINE OF THESIS
The remaining part of thesis is organized as follows:
Prediction Commercial Intent of Online Consumers is a very popular topic and several studies and methodologies are developed on it. In Chapter 2, literature review of related works in similar topics are summarized deeply. This section covers the questions about the influencing factors that prevent consumers from completing their shopping transactions, key inhibitors to identify buyer and non-buyer behavior and methodologies which used before to predict behavior of online consumers.
In Chapter 3, the dataset used in this study has been described. This collected dataset contains aggregated page view data kept track during the visit along with some session and user information are used. The details of the page view data, how it is processed to be structured and process of preparation data set for proper Weka format is are also described step by step in this chapter.
In Chapter 4, the experimental research information is given in detail. This section includes the information about the machine learning techniques that is used and results of the experiments. Our model about predicting commercial intent of online consumers is explained exhaustively in this chapter.
And finally, Chapter 5 includes an abstract of whole study and summarizes the reached point in predicting commercial intent of online consumer analysis.
4
2. LITERATURE REVIEW
There are many techniques have been proposed for prediction commercial intent of consumers. Each study brings a different perspective and shapes further studies. Fundamentally, these studies aim to identify determinants of commercial intent of consumers by either dealing with categorization of visit based on the user’s navigational patterns [1,2,3,4] or predicting the behavior of users in real time and take actions accordingly to improve the shopping card abandonment and purchase conversion rates. [5,16,7]
There are literature studies which aims to investigate key inhibitors to identify buyer or non-buyer behavior. In one of these studies, Monika Kukar-Kinney and Angeline G. Close [8] applied the Howard and Sheth (1969) Theory of Buyer Behavior [9] by extending it with online context. Eleven hypotheses positing relationships among customer behavior factors are proposed and depicted as following:
i. Consumer behaviour might be influenced by the entertainment value of shopping. The more that consumers place items in their online cart for intention to entertain themselves and to reduce their boredom, the more likely to not fulfil their online shopping process.
ii. Consumer behaviour might be influenced by the research and organisational purposes of shopping. The more that consumers use their online cart to organize items of interest to narrow down their choices before gathering additional information, the more likely to they are to abandon them. The more that consumers use the online cart as a shopping research and organizational tool, the more likely they are to abandon it.
iii. Consumer behaviour might be influenced by the online consideration of shopping. The more that consumer place items in their virtual cart as investigation and organisational tool during consideration stage since there might not be an immediate need at given time, the more likely they are not to fulfil their online shopping process. Besides this, the more that customer use their virtual cart with this behaviour, the more likely they are to be price sensitive to wait lower price.
5
iv. Consumer behaviour might be influenced by the evaluation of total cost of shopping. The more that consumer are concerned of total cost shopping since their expectation of online retailers are getting lower prices products, the more likely they are to abandon them and to use their virtual cart for investigational and organisational purposes. In addition to this, the more that customer use their virtual cart with this behaviour, the more likely they are wait for lower price at the same or different store. Eventually, the more that online shoppers are inclined to wait for lower price, the more likely they are not to fulfil their shopping process.
v. Consumer behaviour might be influenced by the evaluation of privacy and security of shopping. The more that consumer are concerned of privacy and security of checkout process since it needs financial and personal information to be fulfilled, the more they are likely not to finish the shopping process. Instead of this, buying from a land-based store are considered.
vi. Consumer behaviour might be influenced by the physical inspection and immediate purchase intent of the purchase of shopping. The more that consumer consider their virtual cart as an investigational and organisational tool, the more likely to aim to buy content from a land-based store after examining it.
vii. Consumer behaviour might be influenced by the evaluation of lower price or lower overall cost of shopping. The more that consumer consider avoiding any shipping and handling fees, the more likely they are to buy product at a land-based store.
In order to test hypotheses of consumer behaviours, an online survey was conducted which contains questions about various factors to be linked to online consumer intention, measures of the frequency of online cart abandonment, frequency of buying items in the cart from a land-based store and general questions about consumer online behaviour and demographic properties.
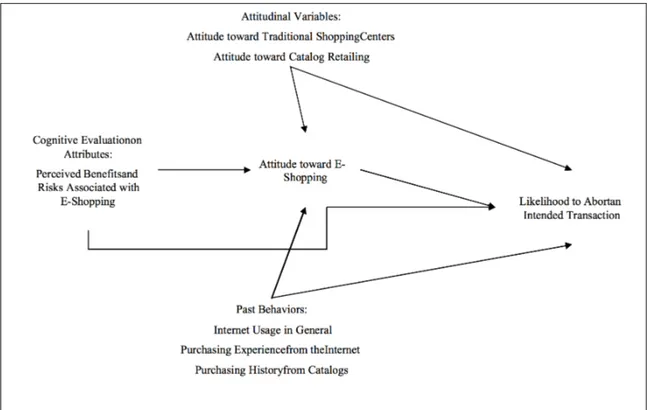
In one of other studies, Jinsook Cho [10] specify factors affecting the likelihood of customers to abort an online transaction using a multi-feature behavior model based on the theory of reason action (TRA). TRA is one of three classic modes of persuasion
6
which intends to explain the relationship between manners and behaviours within human action which is used to foretell how individuals will behave based on their pre-existing manners and behavioural purposes. In this study, these factors were categorised under three following sections and effects were investigated by conducting a survey.
i. Benefit and Risk Perceptions Factors are one of these categories. Online retailing provides more benefits than direct retailing with wide range of product variety, better economic value and product suggestion. Although their benefits, it is also perceived to have a risk due to the lack of opportunity of product examinations, psychological concerns of waiting delivery, products getting lost, buying wrong product and so on. Furthermore, security and privacy issues regarding giving financial and personal information in checkout process over the web is also significant risk of online shopping.
ii. One of the other category is Attitudinal Factors. Direct retailing provides more favourable attitudes than online retailing since it has different level of social and interpersonal interaction through smell, music, touch and etc. Therefore, consumers who value such aspects be less likely to use online retailing although they can visit online retailers for research and organisational purposes.
iii. In the last of these categories is Past Behavioural Factors. Internet usage behaviour such as long-term usage, higher frequency of visits, amount of time per internet visit related to online purchasing since consumer have more possibility to visit and research online retailers. Thus, it helps to enhance the knowledge about the things which involved in online purchasing which reduce uncertainties. Besides this, amount of money spent on online retailers are also important since it increase confidence of usage of online retailers. Therefore, it is expected that degree of past experiences has huge effects on completing online purchases.
7
Figure 2.1: The constructive model of likelihood to abort an intended online transaction.
Source: Cho J., 2004. Likelihood to abort an online transaction: influences from cognitive evaluations,
attitudes, and behavioural variables. Information & Management Volume 41 (827–838).
There are some other literature studies which aims to categorize the visits based on the user’s clickstream data and session information. In one of these studies, Wendy W. Moe [4] aimed to categorize the visits using data from a given online store in the belief that a system could be developed which takes customized actions according to the category of the visit. The typology of shopping strategies developed in the study were collected in four characteristics as follows:
i. Characteristic of Directed Buying visits indicates the goal-directed motivation of the consumer. As a result of viewing product-level pages more than category-level pages, consumer gets more targeted and detailed information rather than brooder level of information. Within a limited number of products and categories pages are displayed by consumers.
ii. Characteristic of Search and Deliberation visits also indicates the goal-directed motivation with a planned purchase focusing on search within a product category. However, because the consumers are still building their consideration
8
and evaluating items in set, researches may expand across a number of different items within the given category since consumer is still unsure of which item in the category to buy.
iii. Characteristic of Hedonic Browsing visits indicates exploratory search
behaviour unlike Search & Deliberation Strategies and Direct Buying Strategies which are significantly less focused. Therefore, the broader category level pages are viewed more than product level of page in the session. Besides this, these kind sessions should exhibit a lot more types of products and categories views since it is derived encountering and exploring stimulus during visits rather than goad directed strategies.
iv. Characteristic of Knowledge Building visits indicates other exploratory search behaviour to increase experience of products and marketplace. The consumer does not consider any specific purchase necessarily, but the information gathered may affect future purchasing decisions.
For the purpose of observing above strategies, a set of features were extracted from page to page clickstream data of the visits and fed to K-means clustering algorithm to categorize the visits according to their purchasing likelihood. The obtained clusters which are labelled as Knowledge Building, Hedonic Browsing, Directed Buying, Search/Deliberation and Shallow were determined to have different intentions to purchase when analysed in terms of the behaviours of the visitors in each cluster. Proposed typologies and the expected behaviours were consistent with the observed patterns observed. As a result of study, the observed shopping patterns are described for each cluster as follows:
i. The Knowledge Building cluster consumers’ sessions dedicated to mostly viewing information pages to gather knowledge rather than purchase.
ii. The Hedonic Browsing cluster consumers' sessions dedicated to mostly viewing on category or product level pages with slightly more views dedicated to category level pages than specific products.
9
iii. The Directed Buying cluster shoppers’ sessions dedicated to more page views to product level information and very little types in the product categories viewed. Furthermore, this cluster was marked in the high level of repeat viewing of a product page.
iv. The Search & Deliberation cluster consumers’ sessions dedicated to total number of pages viewed. Since the consumers were focused to find a particular type of product, their sessions searches are related to very less variety in product categories. But, the aim of consumers is to build their consideration by investigating a number of items in the product category in their interest, a certain product in the category is not identified.
v. The Shallow cluster consumers’ sessions dedicated to very little time before
leaving the site. They were not important visitors in any sense.
In another study, Bamshad Mobasher et al. [6] proposed two different website usage mining methods based on user transactions and page views to generate overlapping profiles which take gathered views of the behaviour of the subsets of website users based their concerns and information needs that can be effectively used by recommendation systems to take certain actions in real-time. The first method called PACT (Profile Aggregations based on Clustering Transactions) which is based on derivative of overlapping profiles from user transactions cluster and second method which uses ARHP (Association Rule Hypergraph Partitioning) derives overlapping aggregate profiles from page views by computing clusters of page view references based on how often they take place together against user transactions. The results showed that the profiles extracted from user clickstream data can be helpful in achieving effective personalization at early levels of user’s visits in a virtual shopping environment.
The literature studies that aim to predict the behaviour of users in real time to be able to take customized actions accordingly mostly use sequential data. Germanas Budnikas [6] noted the importance of monitoring real-time behaviours in virtual shopping environment and the actions to be taken accordingly. Germanas Budnikas [6] proposed to classify the visitor behaviour patterns to determine the website component that has
10
the biggest effect on a completion of business objective. As stated in the study, data using Google Analytics tracking code was formalised by applying Business Process Modeling Notation to enable a definition of data to be read off from a website during tracing user browsing activities. Thus, applying Naïve Bayes Classifier and Multi-Layer Perceptron Classifier on gathered statistical data derived to build a model of consumer on-site behavior whether a website guest is eager to finalize a transaction or not.
Yeung [13] also showed that the navigation paths of visitors in the e-commerce site can be used to predict the actions of the visitors. There are many studies that use Hidden Markov Model (HMM) for determining the frequencies of paths that are visited consecutively during the session [12, 14, 15]. The most frequently followed navigation paths are used to determine the webpages the user is likely to visit in the next steps and these pages are recommended to the user in order to extend the time that he/she will spend in the site. Ding et al. [16] used to model the clickstream data of the visitors using HMM and showed that predicting the intention of the user in real-time and taking customized actions in this context helps to increase the conversion rates and decrease the shopping cart abandonment rates.
In this research, we proposed a real-time user behaviour analysis system for online shopping environment. The features that were extracted from session information and clickstream data used to group the visits according to the visitor’s intention are used to formulate a supervised learning problem in the system with the aim of estimating the visitor’s tendency to finalize the transaction. Thus, we determine the users that visit the e-commerce site with direct purchasing intention and offer content only to those visitors if they are likely to leave the site without finalizing the transaction. We use an online retailer data and check the performance of different machine learning methods under different conditions. We also determine the most discriminative factors in predicting the purchasing intention using filter feature selection techniques.
11
3. MATERIALS
Dataset collection is one of the most essential part of this research, we use an online retailer clickstream data and user information extracted from session information of the visitors in a one year period to avoid tendency to a specific campaign, special day, user profile or period. This dataset consists of feature vectors belonging to 220672 sessions and resulting 2060485 page views initially.
3.1 DATASET DESCRIPTION
In order to classify consumer main on-site behaviour, a training dataset is collected from online retailer site. This dataset is constructed by Google Analytics function for collecting statistical data about user online activities. It consists following features which give information on the actions taken on the page while navigating the website and extracted features from visitor session information.
During website session, browsing information about visited pages is collected and features are extracted as follows. Tables 3.1 shows the description of these features in the dataset.
Table 3.1: Description of features in dataset Feature Name Feature Description
Custom Variable Visitor information
Page Relative link of pages visited by the visitor.
Page Views Page view value of the pages visited by the visitor
Unique Page Views Unique page view value of the pages visited by the visitor
Average Time on Page Average time of the pages visited by the visitor
Entrances Value of entrances of pages visited by the visitor
Bounce Rate
Average bounce rate value of the pages visited by the visitor
12
Exit Rate Average exit rate value of the pages visited by the visitor
Page Value Average page value of the pages visited by the visitor
Date Date of visit
Search Term Search keyword which used by the visitor
Exit Screen Last page of the of the visitor before session ends
City City of the visitor
Browser Type Browser type of the visitor
Operating System Operating system of the visitor
Traffic Type
Traffic type by which the visitor has arrived at the website (e.g. banner, SMS, direct)
Visitor Type
Visitor type as “New Visitor”, “Returning Visitor” and “Other”
Source
Source by which the visitor has arrived at the website (e.g. Email, Google, Facebook)
Sessions Session value of the pages visited by the visitor.
New Sessions Rate Average session rate value of pages visited by the visitor
New Users Numeric value of Visitor Type
Session Average on
Page Average session time of the pages visited by the visitor
Session Duration Session time of the pages visited by the visitor
Transactions Number of transactions made by the visitor
Revenue Total amount purchased by the visitor
Ecommerce
13
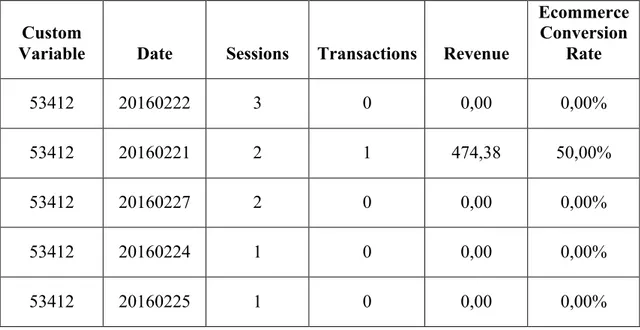
As can be seen in the sample records of 53412 numbered visitor in Table 3.2 consists of session information features that resulted in transaction finalization.
Table 3.2: Visitor Session Information by Date
Custom
Variable Date Sessions Transactions Revenue
Ecommerce Conversion Rate 53412 20160222 3 0 0,00 0,00% 53412 20160221 2 1 474,38 50,00% 53412 20160227 2 0 0,00 0,00% 53412 20160224 1 0 0,00 0,00% 53412 20160225 1 0 0,00 0,00%
As seen Table 3.3, sample records consist of viewed pages by visitor.
Table 3.3: Visitor Page View Information
Custom Variable Page
53412 / 53412 /cart 53412 /c/bot-16372 53412 /urun/columbia-bot-20856/siyah 53412 /urun/columbia-bot-20856 53412 /c/mont-16362 53412 /urun/columbia-bot-19382/siyah
14 53412 /c/ayakkabi-16367 53412 /urun/columbia-bot-19485/gri 53412 /urun/columbia-mont-20741/mavi 53412 /c/ayakkabi-16593 53412 /c/mont-16361 53412 /LoginRegister 53412 /urun/columbia-kadin-bot-20858 53412 /?login=1 53412 /c/bot-16592 53412 /c/boyunluk-16812 53412 /c/outlet-16646 53412 /c/sezon-indirimi-16973 53412 /checkout/billingaddress 53412 /checkout/pay
As seen in Table 3.2 and Table 3.3, inconsistent data entries in respect of the visited web pages may exist in collected data. An inconsistency case is when a customer visits a site repeatedly, we lose information about which pages customer browse in which session. Therefore, we also lose the information about transaction finalization which prevent us classifying intention of visitor to purchase.
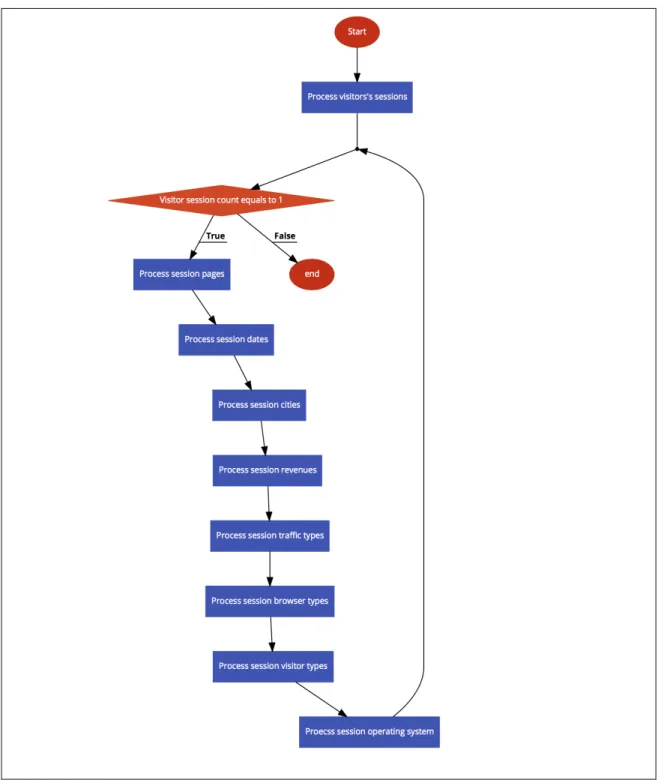
In order to handle data inconsistency cases, following algorithm applied to clean gathered statistical data.
15
Figure 3.1: Handling Dataset Inconsistency Algorithm
After processing the dataset and cleaning the inconsistencies, the numerical and categorical features used in the purchasing intention prediction model are shown in Tables 3.4 and 3.6, respectively. The dataset consists of feature vectors belonging to 12330 sessions. The dataset was formed so that each session would belong to a different user in a one-year period to avoid any tendency to a specific campaign, special day, user
16
profile, or period. Of the 12330 sessions in the dataset, 84.5 percentage (10422) were negative class samples that did not end with shopping, and the rest (1908) were positive class samples ending with shopping.
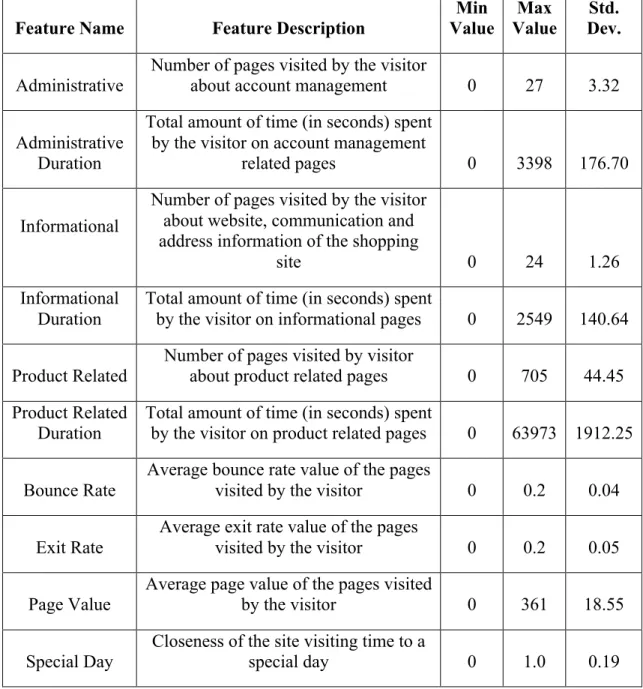
Table 3.4: Numerical features used in the user behaviour analysis model
Feature Name Feature Description
Min Value Max Value Std. Dev. Administrative
Number of pages visited by the visitor
about account management 0 27 3.32
Administrative Duration
Total amount of time (in seconds) spent by the visitor on account management
related pages 0 3398 176.70
Informational
Number of pages visited by the visitor about website, communication and address information of the shopping
site 0 24 1.26
Informational Duration
Total amount of time (in seconds) spent
by the visitor on informational pages 0 2549 140.64
Product Related Number of pages visited by visitor about product related pages 0 705 44.45 Product Related
Duration
Total amount of time (in seconds) spent
by the visitor on product related pages 0 63973 1912.25
Bounce Rate
Average bounce rate value of the pages
visited by the visitor 0 0.2 0.04
Exit Rate
Average exit rate value of the pages
visited by the visitor 0 0.2 0.05
Page Value
Average page value of the pages visited
by the visitor 0 361 18.55
Special Day Closeness of the site visiting time to a special day 0 1.0 0.19
Table 3.4 shows the numerical features along with their statistical parameters. Among these features, "Administrative", "Administrative Duration", "Informational", "Informational Duration", "Product Related" and "Product Related Duration" represent the number of different types of pages visited by the visitor and total time spent in each
17
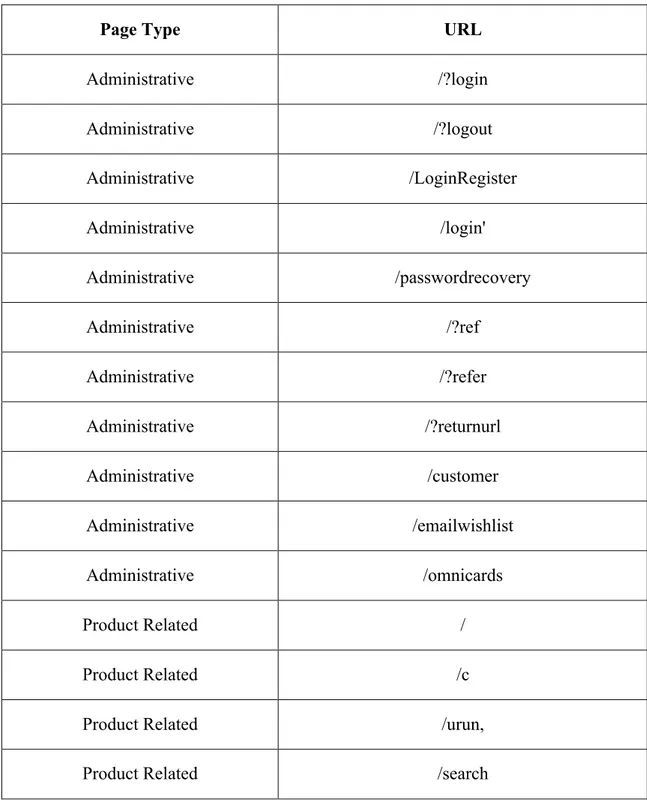
of these page types in seconds. The values of these features are derived from the URL information of the pages visited by the user and updated in real time when a user takes an action, e.g. moving from one page to another. Table 3.5 shows this URL information of the pages visited by the user by their category types.
Table 3.5: Page Types Derived By URL
Page Type URL
Administrative /?login Administrative /?logout Administrative /LoginRegister Administrative /login' Administrative /passwordrecovery Administrative /?ref Administrative /?refer Administrative /?returnurl Administrative /customer Administrative /emailwishlist Administrative /omnicards Product Related / Product Related /c
Product Related /urun,
18
Product Related /cart
Informational /Topic Informational /t-popup Informational /t Informational /contactus Informational /Catalog Informational /stores
The "Bounce Rate", "Exit Rate" and "Page Value" features shown in Table 4 represent the metrics measured by "Google Analytics" [17] for each page in the e-commerce site. These values can be stored in the system for all web pages of the e-commerce site in the developed system and updated automatically at regular intervals. The value of "Bounce Rate" feature for a web page refers to the percentage of visitors who enter the site from that page and then leave ("bounce") without triggering any other requests to the analytics server during that session. The value of “Exit Rate” feature for a specific web page is calculated as for all page views to the page, the percentage that were the last in the session. The “Page Value” feature represents the average value for a web page that a user visited before completing an E-commerce transaction. The “Special Day” feature indicates the closeness of the site visiting time to the special days (e.g. Mother’s Day, Valentine's Day) in which the sessions are more likely to be finalized with transaction. The value of this attribute is determined by considering the dynamics of e-commerce such as the duration between the order date and delivery date. For example, for Valentina’s day, this value takes a nonzero value between February 2 and February 12, zero before and after this date unless it is close to another special day, and its maximum value of 1 on February 8.
19
Table 3.6: Categorical Features used in the User Behaviour Analysis Model
Feature Name Feature Description
Number of Categorical Values
Operating Systems
Operating system of the
visitor 8
Browser Browser of the visitor 13
Region
Geographic region from which the session has
been started by the visitor 9
Traffic Type
Traffic source by which the visitor has arrived at the website (e.g. banner,
SMS, direct) 20
Visitor Type
Visitor type as “New Visitor”, “Returning
Visitor” and “Other” 3
Weekend
Boolean value indicating whether the date of the
visit is weekend 2
Month Month value of the visit date 12
Revenue
Class label indicating whether the visit has been
finalized with a
transaction 2
Table 3.6 shows the categorical features along with their categorical values. The "Operating Systems", " Browser", " Traffic Type" and “Visitor Type” features shown in Table 3.6 represent the metrics measured by "Google Analytics" [17] for each page in the e-commerce site. “Weekend” and “Month” features are derived by looking date of visit.
They give information about whether the date of visit is at the end of the week or not and the moth of the visit respectively. “Revenue” feature indicates that whether the visit results in transaction finalization.
20
Figure 3.2: An example of data set
3.2 DATA SET PREPARATION
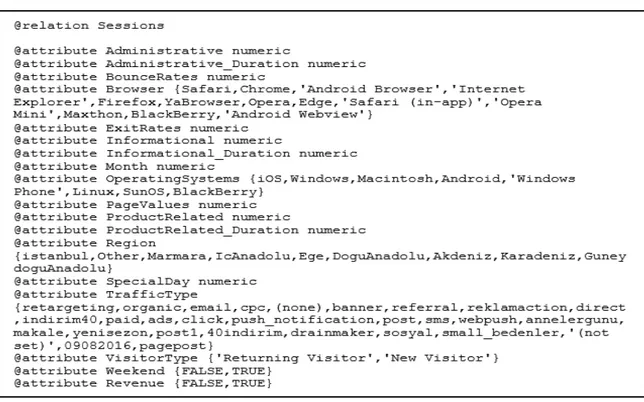
In this research, Waikato Environment for Knowledge Analysis (Weka) Software which is an open source machine learning application which is used to implement the classification algorithms. The application is implemented at the University of Waikato, New Zealand. It is a set of machine learning algorithms for data mining tasks which can be applied to a dataset or called directly from Java code. It also has tools for data pre-processing, classification, regression, clustering, association rules and visualization. In order to analyse data with Weka, the dataset must be in a appropriate file format named ‘ARFF’. All data collected with the online retailer Google Analytics tracking code data and user session information are converted to this format to run with Weka.
As seen Figure3, the first part of file is Header information followed the Data information section.
a. ARFF Header Section: Attribute names and attribute types are defined in this part. The header of online retailer dataset used in this research looks like as following.
21
Figure 3.3: Header Section of Online Retailer Dataset
b. ARFF Data Section: In this section, the explored data should be in a sequence which is described in header section. The data section of online retailer dataset used in this research looks like as following.
22
4. METHODS
In this part, the issues which this research focused on are explained in detail. The visitor behaviour analysis model is designed as a binary classification problem measuring the user’s intention to finalize the transaction. In order to predict the purchasing intention of the visitor using aggregated page view data kept track during the visit along with some session and user information. The extracted features are fed to decision tree (DT), support vector machines (SVM) and multilayer perceptron (MLP) classifiers as input. Therewithal oversampling and feature selection pre-processing steps are used to improve the performance and scalability of the classifiers.
4.1 PREDICTION
In the scope of this research, the lazy learning algorithms such as k-Nearest Neighbours are excluded in the modelling of the visitor behaviour analysis, considering the real time use of the system. Since the system needs to be updated with new examples, Multilayer Perceptron (MLP) and Decision Tree (DT) algorithms, which have online learning implementations, are selected for comparison. Besides, Support Vector Machines (SVM) classifier, whose classification ability has been shown in many literature studies [18] is also included in the analysis. If SVM achieves significantly higher accuracies than the other classifiers, an online passive-aggressive implementation can be used to dynamically update the SVM model with new examples. The performance of the algorithms is compared using accuracy, F1-score and true positive/negative rates. The experiments were repeated 100 times with randomly chosen training and test instances and t-test was applied to test whether the accuracies of the algorithms are significantly different from each other.
4.1.1 Support Vector Machines (SVM)
Support Vector Machines (SVM) classifier, whose classification ability has been shown in many literature studies [18], is also included in our analysis. Although SVM does not have a straightforward implementation for online learning, an online passive-aggressive implementation can be used to dynamically update the SVM model with new examples if it achieves significantly higher accuracies than the other classifiers used in this study. SVM is a discriminant based algorithm which aims to find the optimal separation boundary called hyperplane to discriminate the classes from each other [33]. The closest
23
samples to these hyperplanes are called support vectors, and the discriminant is represented as the weighted sum of this subset of samples which limits the complexity of the problem. The optimization problem to find an optimal separating hyperplane is defined as:
min$% & %+ ( ) * +
*,$ subject to 67 &897+ &: ≥ 1 − )* (7)
where w is a weight vector defining the discriminant, C the regularization parameter, ξ = ( ξ1, ξ2, …., ξk) vector of slack variables, and rt the actual value of sample t. The slack
variables are defined to tolerate the error on training set in order to avoid overfitting and so improve the generalization ability of the model. The regularization (cost) parameter, C, is a hyper-parameter of the algorithm which is used to control the complexity of the model that is fitted to the data. Higher values of C decrease the tolerance of the model on training set instances and hence may cause overfitting on the training set.
Although SVM is a linear classifier, it is capable of modeling non-linear interactions by mapping the original input space into a higher dimensional feature space using a kernel function. Thus, the linear model in the new space corresponds to a nonlinear model in the original space [50]. In this study, linear and Radial Basis Function (RBF) kernels are used. The RBF is defined as
! "#, " = exp - "#-" *+, (8)
where !" is the center and s defines the radius [50] . As noted in Section 3, we repeat train/validation split procedure for 100 times and report the average performance of each classifier on the validation sets. To avoid overfitting and report unbiased results, the values of hyper parameters, C and s, are optimized using grid search on a randomly selected single train/validation partition and the specified values are used for the rest of the partitions. We used LIBSVM [34] implementation of SVM for experimental analysis.
4.1.2 Decision Trees (DT)
The other classifiers used to predict the commercial intent of the visitors are the variants of decision tree algorithms. Decision tree is an efficient non-parametric method that can be used for both classification and regression [28]. A decision tree has two main
24
components: internal decision nodes and terminal leaves. Each internal node in the tree implements a test function using one or more features and each branch descending from that node is labeled with the corresponding discrete outcome. During testing, when a new instance is given, the test pointed out by the root node is applied to the instance and according to the output of the decision node the next internal node that will be visited is determined. This process is then repeated for the subtree rooted at the new node until a leaf node is encountered which is the output of the constructed tree for the given test instance. In this paper, we use C4.5 algorithm to generate an individual decision tree for classification [29]. The C4.5 algorithm extended the ID3 tree construction algorithm by allowing numerical attributes, dealing with missing values and performing tree pruning after construction. On the other hand, random forest is based on constructing a forest, e.g. a set of diverse and accurate classification trees, using bagging resampling technique and combining the predictions of the individual trees using a voting strategy [30]. The steps of the random forest construction algorithm are shown below:
Step 1: Given N instances in the original training set, create a subsample with bagging, i.e. choose N instances at random with replacement from the original data which constitutes the training set.
Step 2: Suppose that each instance is represented with M input variables in the original input space. A number m is specified, which is much less than M, such that at each node, m variables are selected at random out of the M and the best split on these m is used to split the node.
Step 3: According to the pre-determined stopping criteria, each tree is grown to the largest extent possible without pruning.
Step 4: Repeat this process until desired number of trees is obtained for the forest. The random forest algorithm proved itself to be effective for many classification problems such as gene classification [31], remote sensing classification [45], land-cover classification [32], or image classification [33]. In addition to its high accuracy, it has been shown that random forest has fewer number of hyper-parameters to be fine-tuned by the user when compared to state-of-art methods such as SVM. For these reasons, random forest is determined to be used as another classification algorithm in our
25
purchasing intention prediction module. The hyper-parameters of the algorithm are the size of each bag, number of input variables used to determine the best split in each step which is referred to as m in the above-given algorithm, and number of trees in the forest. In our experiments, the size of each bag is set to N, m to élog2Mù, and the number of
trees in the forest to 100.
4.1.3 Multilayer Perceptron (MLP)
MLP is a feed-forward artificial neural network model that consists of multiple layers of nodes in a directed graph and each layer is completely connected to the other. The elements of the hidden and output layers are called neurons. Each neuron is a processing unit. Our MLP model consists of an input, an output, and a single hidden layer considering that one hidden layer is a universal approximation that is sufficient to model any piecewise continuous function [26]. MLP is capable of modeling complex non-linear problems with the use of a non-non-linear activation function in its hidden layer [27]. In regression, the sum of errors over the whole set of training samples is
! ", $ % = . (()-+))
-)/0 (1)
where W and v denote the set of first and second layer weights, respectively, T the number of training set samples, rt the actual value of sample t, and yt the output of the network, i.e. the predicted value, for sample t. The output of the network is calculated as
!"= $
%&%"+ $( )
%*+ (2)
where vh denotes the weight between hidden node h and the output, and zht the value of
hidden node h for sample t. In a two-class classification problem, the output, yt is passed
through a sigmoid function.
The parameters of the neural network, which are the weights representing the connections between the layers, are learned iteratively during the training process. The weights, W and v, are updated according to the rule of a learning algorithm. The traditional learning algorithm used to train the network is backpropagation [25] which updates the weights of a neural network to find a local minimum of the error function given in Eq. 1. The second layer of MLP is a simple perceptron with hidden units as inputs [50]. Therefore, the least squares rule is used to update the second-layer weights:
26
∆"#$ = & '$-)$ *
#$ (3)
where ! is the learning rate used to determine the magnitude of change to be made in the weight. On the other hand, for the second layer weights the least squares rule cannot be applied directly as the desired outputs for the hidden neurons are not available. Therefore, the error is back propagated from the output to the inputs using the following chain-rule: !" !#$%= !" !'( !'( !)$ !)$ !#$% (4)
and the update rule of the second-layer weight for sample t is found as ∆"#$% = ' (%-*% +#,#%(1 − ,#%)1$% (5)
where whj denotes the second-layer weight between hidden input j and hidden node h,
and xjt jth feature of input t. The weights are updated in the opposite direction of the
partial derivatives until a local minimum is reached. In this study, we use resilient backpropagation with weight backtracking algorithm to calculate the neural network [25]. Resilient backpropagation is known as one of the fastest algorithms used to train a neural network [27]. While the traditional backpropagation algorithm has a specific learning rate for all weights, in resilient backpropagation a separate learning rate that can be modified during the training process is used for each weight. This approach addresses the problem of defining an over-all learning rate which should be appropriate for the whole training process and the entire network. Besides, only the sign of the partial derivate is used to modify the weights which ensures that the learning rate has an equal influence over the entire network. Thus, the update rule of the traditional backpropagation given in Eq. 5 is turned into
∆"#$% = '#$()*+ ,%-.% /#0#% 1 − 0#% 3$% (6)
where !"# denotes the learning rate between hth hidden node and jth input. The learning rate can dynamically be changed during learning process for faster convergence. This mechanism is called adaptive learning rate. The idea is based on increasing the value of
!"# if the corresponding partial derivative keeps its sign, and decreasing it if the partial
27
the large value of learning rate is aimed to be reached in the next iteration [27]. The weight backtracking mechanism used in our experiments undoes the last iteration and adds a smaller value to the weight in the next step to avoid jumping over the minimum again in the latter iterations. In our experiments, the number of neurons in the hidden layer is set to the half of the number of inputs. The number of iterations is dynamically determined using threshold value of 0.2 for the partial derivatives of the error function as stopping criteria.
4.1.4 Oversampling
Most of the machine learning classification algorithms assume and work better when the number of instances of each class are equal roughly. However, the assumption is not same as in many real-world problems such a fraud detection, network intrusion detection, oil-spill detection and etc. It is often the situation that the ratios of between classes in these datasets are extremely different which causes imbalanced dataset problem. The problem of dataset in these example is usually related to a case when the minority class has important information which tend to be misclassified when compared to the majority class and it will cause errors in making decision on prediction accuracy of minority class.
There are two methods should be performed to solve this problem which focus at either data level as using over sampling and under sampling techniques or focus at algorithm level as using cost-sensitive learning techniques. [18, 34] There are different cases to choose one of these methods. For example, applying algorithm level solution might not be possible since there are not many cost-sensitive implementations of all learning algorithms. In a different case, datasets might be already large and size of the training set needs to reduced in order to learning possible therefore applying under sampling might be feasible. Despite that, using under sampling in some datasets might not be feasible since it discards potentially useful data. Although oversampling has disadvantages as making overfitting, it is most frequently used techniques to solve imbalance dataset problem. One of the well-known over sampling method is Synthetic Minority Over Sampling Technique (SMOTE) [19].
In this study, oversampling method are applied to get better results since the ratio of 12330 sessions in the dataset are 84.5 percentage (10422) are negative class samples
28
which do not end with shopping and the rest (1908) are positive class samples ending with shopping.
4.1.5 Feature Selection
Feature selection is the process of selecting a subset of relevant attributes to be used in
making the model in machine learning. Effective feature selection eliminates
redundant variables and keeps only the best subset of predictors in the model which also gives shorter training times. Besides this, it avoids the curse of
dimensionality and enhance generalization by reducing overfitting. [20]
In this research, feature selection techniques are applied to improve the classification performance and/or scalability of the system. Thus, we aim to investigate if better or similar classification performance can be achieved with less number of features. An alternative of feature selection is the use a feature extraction technique such as Principal Component Analysis for dimensionality reduction. However, in this case, the features in the reduced space will be the linear combinations of 17 attributes, which brings the need of tracking all features during the visit and updating the feature vector after a new action is taken by the visitor. Therefore, it has been deemed appropriate to apply feature selection instead of feature extraction within the scope of this research. For feature ranking, instead of wrapper algorithms that require a learning algorithm to be used and consequently can result in reduced feature sets specific to that classifier [19], filter-based algorithms are tested in which no classification algorithm is used. Correlation Attribute Evaluation, Information Gain Attribute Evaluation and Minimum Redundancy Maximum Relevance Filters were used in our experiments. In mRMR algorithm [20, 21], the aim is to maximize the relevance between the selected set of features and class variable while avoiding the redundancy among the selected features. Thus, maximum classification accuracy is aimed to be obtained with minimal subset of features.
4.2 CLASSIFICATION RESULTS
One of the purpose of this research is to get the analyses results of the measuring the user’s intention to finalize the transaction and build a model for visitor behaviour analysis. The dataset is fed to Decision tree, Support vector machines and Multilayer Perceptron classifiers using tenfold cross validations. The Accuracy, True Positive Rate
29
4.2.1 Results on Class Imbalanced Dataset
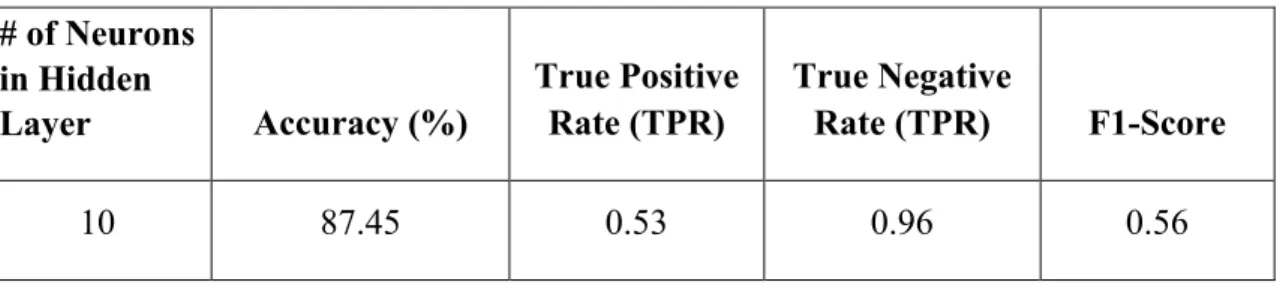
Tables 7, 8 and 9 show the results obtained with SVM, Decision Tree and MLP algorithms respectively. The results show that C4.5 implementation of the decision tree algorithm gives the highest accuracy rate on test set. However, a class imbalance problem arises [24] since the number of negative class instances in the data set is much higher than that of the positive class instances, and the imbalanced success rates on positive (TPR) and negative (TNR) samples show that the classifiers tend to label the test samples as the majority class. This class imbalance problem is a natural situation for the analysed problem since most of the e-commerce visits do not end with shopping.
Table 4.1: Results obtained with Support Vector Machines classifier
Table 4.2: Results obtained with Decision Tree classifier
Table 4.3: Results obtained with Multilayer Perceptron Classifier
Kernel Accuracy (%) True Positive Rate (TPR) True Negative Rate (TPR) F1-Score
Linear 88.25 0.42 0.97 0.52 RBF 86.14 0.46 0.92 0.53 Classifier Accuracy (%) True Positive Rate (TPR) True Negative Rate (TPR) F1-Score C4.5 88.92 0.57 0.96 0.57 Random Forest 89.51 0.57 0.96 0.58 # of Neurons in Hidden Layer Accuracy (%) True Positive Rate (TPR) True Negative Rate (TPR) F1-Score 10 87.45 0.53 0.96 0.56
30
4.2.2 Results obtained with Oversampling
The results presented in this section show that the classifiers tend to minimize their errors on majority class samples, which leads to an imbalance between the accuracy rates of the positive and negative classes. However, in a real-time user behaviour analysis model, correctly identifying directed buying visits, which are represented with positive class in our dataset, is as important as identifying negative class samples. Therefore, a balanced classifier is needed to increase the conversion rates in an e- commerce website. To deal with class imbalance problem, we use oversampling method, in which a uniform distribution over the classes is aimed to be achieved by adding more of the minority (positive class in our dataset) class instances. Since this dataset is created by selecting multiple instances of the minority class more than once, first oversampling the dataset and then dividing it into training and test sets may lead to biased results due to the possibility that the same minority class instance may be used both for training and test. For this reason, in our study, 30 percentage of the data set consisting of 12330 samples is first left out for testing and the oversampling method is applied to the remaining 70 percentage of the samples.
The results obtained on the balanced dataset are shown in Tables 10, 11 and 12. Since the number of samples belonging to positive and negative classes is equalized with oversampling, both accuracy and F1-score metrics can be used to evaluate the results.
Table 4.4: Results obtained with oversampling and Support Vector Machines Classifier 20 87.92 0.56 0.96 0.58 30 87.02 0.54 0.54 0.56 Kernel Accuracy (%) True Positive Rate (TPR) True Negative Rate (TPR) F1-Score Linear 84.26 0.75 0.93 0.82 RBF 84.88 0.75 0.94 0.82
31
Table 4.5: Results obtained with oversampling and Decision Tree Classifier
Table 4.6: Results obtained with oversampling and Multilayer Perceptron Classifier
Table 4.7: Summary of best results obtained with Classifiers
C4.5 MLP RBF SVM Accuracy (%) 82.34 87.34 84.88 TPR 0.79 0.84 0.75 TPR 0.85 0.92 0.94 F1-Score 0.82 0.86 0.82 Classifier Accuracy (%) True Positive Rate (TPR) True Negative Rate (TPR) F1-Score C4.5 82.34 0.79 0.85 0.82 Random Forest 82.29 0.74 0.90 0.81 # of Neurons in Hidden Layer Accuracy (%) True Positive Rate (TPR) True Negative Rate (TPR) F1-Score 10 87.94 0.84 0.92 0.86 20 83.84 0.84 0.83 0.83 30 82.15 0.82 0.83 0.82
32
4.2.3 Results Obtained with Oversampling and Feature Selection
The MLP algorithm, which achieved the highest accuracy and F1-score, has been chosen to identify the directed buying visits. In this section, we apply feature selection to further improve the classification performance of MLP classifier. Besides, considering the real-time usage of the proposed system, achieving better or similar classification performance with less number of features will improve the scalability of the system since less number of features will be kept track during the session.
Table 4.8 shows the feature rankings obtained with the filters used in this study. The results showed that the "Page Value" feature of Google Analytics tracking tool is selected in the first place by all filters a carries discriminative information about the intent of the visitor. Considering that the “Page Value” [12] feature represents the page that a user visited before completing an e-commerce transaction, it can be seen as a natural measure of visitor’s transaction finalization intention. In our system, this feature is represented as the average of the "Page Value" values of pages visited by the visitor during the session and is updated when the visitor moves to another page. As seen in Table 4.8, the other two Google Analytics features, “Exit Rate” and “Bounce Rate”, are also highly correlated with the class variable and take place near the top in correlation and information gain filter rankings. However, since "Bounce Rate" is also highly correlated with "Exit Rate" and so contains redundant information, mRMR, which suggests incrementally selecting the maximally relevant variables while avoiding the redundant ones, chooses it in the 15th order. Similarly, although the "Product Related" and "Product Related Duration" attributes are closely related to the class variable, they have been ranked in the last orders by mRMR because of their high correlation with “Page Value” feature which has already been chosen by the algorithm. It is seen that correlation and information gain methods give similar rankings since both algorithms ignore the relations among the selected variables, whereas the mRMR method gives a quite different ranking compared to these methods.
33
Table 4.8:Feature rankings obtained with filter feature selection methods
Ranking Correlation Info Gain mRMR
1 Page Values Page Values Page Values
2 Exit Rates Exit Rates Month
3 Product Related
Product Related
Duration Exit Rates
4 Product Related Duration Bounce Rates Weekend
5 Bounce Rates Product Related
Informational Duration
6 Administrative Traffic Type Region
7 Visitor Type Administrative
Operating Systems 8 Informational Month Administrative Duration 9 Administrative Duration Administrative
Duration Visitor Type
10 Special Day Informational
Product Related Duration
11 Month
Informational
Duration Special Day
12 Traffic Type Visitor Type Informational
13 Informational Duration Special Day Traffic Type
14 Operating Systems Operating Systems Administrative
15 Weekend Browser Bounce Rates
34
The top 10 features selected by the filters are incrementally fed to the MLP algorithm using the oversampled dataset. The highest accuracy obtained by each method and the number of input variables in the corresponding MLP model are shown in Table 4.9. The highest accuracy (87.94 percentage) and F1-score (0.87) are obtained using the feature subset containing the top 6 features of the mRMR ranking. These values are statistically different from the highest accuracy and F1-score achieved by the other two methods (p-value <0.05). It is also seen that the correlation and information gain algorithms use more features than mRMR algorithm in their best models. Since mRMR filter performs significantly higher accuracy with less number of features than correlation and information gain, MLP with top 6 features selected by mRMR is determined as the final model considering its better performance as well as scalability of the real-time storage and update of the feature vector periodically during the session.
Table 4.9: Best results obtained using selected feature subsets by MLP
Filter Features Accuracy (%) TPR TNR F1-Score Correlation 9 84.32 0.84 0.85 0.84 Information Gain 10 84.11 0.84 0.85 0.84 mRMR 6 87.94 0.84 0.92 0.87 17 Browser Region Product Related
35
5. CONCLUSIONS
In this thesis, we aim to construct a real-time user behaviour analysis system for online shopping environment. We use an online retailer data to perform the experiments. In order to predict the purchasing intention of the visitor, we use aggregated page view data kept track during the visit along with some session and user information as input to machine learning algorithms. Oversampling and feature selection pre-processing techniques are applied to improve the success rates and scalability of the algorithms. The best results are achieved with a Multilayer Perceptron algorithm calculated using resilient backpropagation with weight backtracking.
Our findings support the argument that the features extracted from clickstream data during the visit convey important information for online purchasing intention prediction. The features that represent aggregated statistics of the clickstream data obtained during the visit are ranked near the top by the filter feature ranking algorithms. However, these metrics are also highly correlated with each other. On the other hand, although the session information-based features are less correlated with purchasing intention of the visitor, they contain unique information different from clickstream based features. Therefore, we apply a feature ranking method called minimum Redundancy-Maximum Relevance which takes such redundancies between the features into account. The findings show that choosing a minimal subset of combination of clickstream data aggregated statistics and session information such as the date and geographic region results in a more accurate and scalable system. Considering the real-time usage of the proposed system, achieving better or similar classification performance with minimal subset of features is an important factor for the e-commerce companies since less number of features will be kept track during the session.