T.C.
BAHÇEŞEHİR ÜNİVERSİTESİ
DETERMINING THE RELATIVE EFFICIENCY OF
THE STOCK MARKETS BY CLASSICAL AND FUZZY
DATA ENVELOPMENT ANALYSIS
M.S. Thesis
Hakan BALKAN
T.C.
BAHÇEŞEHİR ÜNİVERSİTESİ
The Graduate School of Natural and Applied Sciences Industrial Engineering
DETERMINING THE RELATIVE EFFICIENCY OF
THE STOCK MARKETS BY CLASSICAL AND
FUZZY DATA ENVELOPMENT ANALYSIS
M.S. Thesis
Hakan BALKAN
Supervisor: Assoc. Prof. Dr. F. Tunç BOZBURA
Co-Supervisor: Asst. Prof. Dr. Ahmet BEŞKESE
T.C
BAHÇEŞEHİR UNIVERSITY
The Graduate School of Natural and Applied Sciences Industrial Engineering
Title of the Master‟s Thesis : Determining The Relative Efficiency of The Stock Markets by Classical and Fuzzy Data Envelopment Analysis
Name/Last Name of the Student : Hakan Balkan Date of Thesis Defense : June, 20, 2011
The thesis has been approved by the Graduate School of Natural and Applied Sciences.
Assoc. Prof. F. Tunç BOZBURA Acting Director
This is to certify that we have read this thesis and that we find it fully adequate in scope, quality and content, as a thesis for the degree of Master of Science.
Examining Committee Members:
Assoc. Prof. Dr. F. Tunç BOZBURA (Supervisor) :
Prof. Dr. Selim ZAĠM :
Assoc. Prof. Dr. Erkan BAYRAKTAR :
ii
ABSTRACT
DETERMINING THE RELATIVE EFFICIENCY OF THE STOCK MARKETS BY CLASSICAL AND FUZZY DATA ENVELOPMENT ANALYSIS
Balkan, Hakan
Industrial Engineering
Supervisor: Assoc. Prof. F. Tunç BOZBURA
June 2011, 164 pages
In this study the efficiency of the stock markets of 45 countries is examined with a country-based approach by using classical and fuzzy Data Envelopment Analysis (DEA) methods. In the study, beside evaluation of the results of classical and fuzzy Data Envelopment Analysis, there is a detailed literature survey about the relationship between the stock markets and economic growth, the determinants of the stock market development and methodology.
The input variables in DEA models are Gross Domestic Product (GDP), GDP per capita, institutional environment, business environment, financial stability, banking financial services and non-banking financial services. The outputs variables are market capitalization value in billion USD, value traded in billion USD and turnover ratio. Classical DEA models were solved for years 2007, 2008 and 2009. In classical DEA application in addition to overall efficiency (CCR), pure technical efficiency (BCC) and scale efficiency scores; target values and reference tables for these years were presented. The change in efficiency over years was measured by using Malmquist Total Productivity Index.
In fuzzy DEA application, the efficiency scores for three α-cut levels (0.25, 0.50, and 0.75) obtained by using Wang et al. (2005) approach were given and then countries were ranked by using Minimax Regret Approach. Finally comparison of efficiency scores obtained by classical and fuzzy DEA were presented.
iii
ÖZET
HĠSSE SENEDĠ PĠYASALARININ ETKĠNLĠĞĠNĠN KLASĠK VE BULANIK VERĠ ZARFLAMA ANALĠZĠ ĠLE BELĠRLENMESĠ
Balkan, Hakan
Endüstri Mühendisliği
Tez DanıĢmanı: Doç. Dr. F. Tunç BOZBURA
Haziran 2011, 164 sayfa
Bu çalıĢmada 45 ülkenin hisse senedi piyasalarının etkinliği ülke bazlı bir yaklaĢımla ve klasik ve bulanık Veri Zarflama Analizi (VZA) yöntemleri kullanılarak incelenmeye çalıĢılmıĢtır. ÇalıĢmada, klasik ve bulanık Veri Zarflama Analizi sonuçlarının değerlendirilmesi yanında hisse senedi piyasaları ve ekonomik büyüme, hisse senedi piyasalarının geliĢmiĢliğini etkileyen faktörler ve metodoloji hakkında detaylı bir literatür araĢtırması bulunmaktadır.
VZA modellerinde girdi değiĢkenleri Gayri Safi Yurtiçi Hasıla, kiĢi baĢı Gayri Safi Yurtiçi Hasıla, kurumsal çevre, iĢ çevresi, finansal istikrar, bankacılık hizmetleri ve bankacılık dıĢı finansal hizmetlerdir. Çıktı değiĢkenleri ise milyar USD cinsinden piyasa kapitalizasyonu, milyar USD cinsinden iĢlem hacmi ve devir oranıdır.
Klasik VZA modelleri 2007, 2008 ve 2009 yılları için çözülmüĢtür. Klasik VZA uygulamasında toplam etkinlik (CCR), saf teknik etkinlik (BCC) ve ölçek etkinliği değerlerine ek olarak ilgili yıllar için hedef değerler ve referans tabloları sunulmuĢtur. Etkinliğin yıllar içindeki değiĢimi Malmquist Toplam Prodüktivite Endeksi ile ölçülmüĢtür.
Bulanık VZA uygulamasında Wang ve diğ. (2005) yaklaĢımı kullanılarak üç α-kesim düzeyi (0.25, 0.50, and 0.75) için elde edilen etkinlik değerleri verilmiĢtir ve sonrasında ülkeler Minimax PiĢmanlık YaklaĢımı kullanılarak sıralanmıĢtır. Son olarak klasik ve bulanık VZA yöntemleri ile elde edilen etkinlik değerlerinin karĢılaĢtırması sunulmuĢtur.
iv
TABLE OF CONTENTS
LIST OF TABLES ... VI LIST OF FIGURES ... VIII ABBREVIATIONS ... IX
1. INTRODUCTION ... 1
2. LITERATURE SURVEY ... 5
2.1 THE STOCK MARKETS AND ECONOMIC GROWTH ... 5
2.1.1 Financial Development and Economic Growth in General ... 5
2.1.2 The Stock Market Development and Economic Growth ... 7
2.1.3 The Stock Market Development and Economic Growth in Turkey ... 14
2.2 THE DETERMINANTS OF THE STOCK MARKET DEVELOPMENT 15 2.2.1 The Determinants of The Stock Market Development ... 15
2.2.2 Empirical Studies ... 17
2.3 EFFICIENCY AND DATA ENVELOPMENT ANALYSIS ... 25
2.3.1 Efficiency and Related Concepts ... 25
2.3.2 Types of Efficiency ... 26
2.3.2.1 Technical Efficiency ... 26
2.3.2.2 Scale Efficiency ... 26
2.3.2.3 Overall Efficiency ... 26
2.3.3 Measurement of Efficiency ... 27
2.3.4 The Definition and Development of DEA ... 27
2.3.5 Stages in DEA Implementation ... 29
2.3.5.1 Determination of DMUs ... 29
2.3.5.2 Determination of inputs and outputs ... 29
2.3.5.3 Determination of the model and solving the model ... 30
2.3.5.4 Evaluation of results ... 30
2.3.6 Strengths of Data Envelopment Analysis ... 31
2.3.7 Weaknesses of Data Envelopment Analysis ... 31
2.3.8 Basic DEA Models ... 32
2.3.8.1 Input oriented CCR model ... 32
2.3.8.2 Output oriented CCR model ... 35
2.3.8.3 Input oriented BCC model ... 36
2.3.8.4 Output oriented BCC model ... 37
2.3.9 Malmquist Total Factor Productivity Index ... 38
2.3.10 Fuzzy Data Envelopment Analysis ... 40
2.3.10.1 Fuzzy DEA Approaches ... 41
2.3.10.2 Wang, Greatbanks and Yang (2005) Approach ... 44
2.3.10.3 Ranking Interval Efficiencies: The Minimax Regret Approach 46 3. APPLICATION AND RESULTS ... 48
3.1 THE AIM AND THE METHODOLOGY ... 48
v
3.3 DETERMINATION OF INPUTS AND OUTPUTS ... 50
3.3.1 Determination of Inputs ... 50
3.3.2 Determination of Outputs ... 52
3.4 MODELS ... 52
3.5 APPLICATION AND RESULTS OF CLASSICAL DEA ... 52
3.5.1 Results and Evaluation of 2007 ... 52
3.5.2 Results and Evaluation of 2008 ... 62
3.5.3 Results and Evaluation of 2009 ... 70
3.6 EVALUATION OF EFFICIENCY IN TIME BY TFP INDEX ... 78
3.7 APPLICATION AND RESULTS OF FUZZY DEA ... 86
3.8 RANKING DMUs AND COMPARING WITH DEA ... 91
4. CONCLUSION AND FURTHER RESEARCH ... 97
REFERENCES ... 105
APPENDICES ... 111
vi
LIST OF TABLES
Table 2.1: Classification FDEA approaches and related studies ... 43
Table 3.1: Countries included in the study ... 50
Table 3.2: The pillars and sub pillars used in Financial Development Report ... 51
Table 3.3: Input and output values for 2007 ... 54
Table 3.4: Some descriptive statistics of input and output values ... 55
Table 3.5: Correlations of variables for 2007 ... 56
Table 3.6: DEA efficiency scores for 2007 ... 57
Table 3.7: Some statistics derived from Table 3.6... 59
Table 3.8: Target values for outputs in 2007 ... 60
Table 3.9: Reference table for 2007 ... 61
Table 3.10: Input and output values for 2008 ... 63
Table 3.11: Some descriptive statistics of variables for 2008 ... 64
Table 3.12: Correlations of variables for 2008 ... 65
Table 3.13: Efficiency scores for 2008 ... 66
Table 3.14: Some statistics derived from Table 3.13 ... 67
Table 3.15: Target values for outputs in 2008 ... 68
Table 3.16: Reference table for 2008 ... 69
Table 3.17: Some descriptive statistics of variables ... 71
Table 3.18: Input and output values for 2009 ... 71
Table 3.19: Correlations of variables for 2009 ... 73
Table 3.20: Efficiency scores in 2009 ... 74
Table 3.21: Some statistics derived from Table 3.20 ... 75
Table 3.22: Target values for outputs in 2009 ... 76
Table 3.23: Reference table for 2009 ... 77
Table 3.24: 2007, 2008 and 2009 overall efficiency scores ... 79
Table 3.25: Number of efficient and inefficient countries for three years ... 80
Table 3.26: Change in Efficiency (CE), change in technical efficiency (CTE) and TFP Index ... 83
Table 3.27: Lower and upper bound efficiencies for three α levels ... 89
vii
Table 3.29: MRA calculation to determine the second country... 93 Table 3.30: Comparison of efficiency scores of two special countries ... 94 Table 3.31: Ranking in classical DEA and fuzzy DEA ... 95
viii
LIST OF FIGURES
Figure 2.1: Fuzzy DEA studies between 1992-2010 (Hatami-Marbini et al., 2011) 42
Figure 3.1: The biggest 15 markets for 2007 ... 55
Figure 3.2: The biggest 15 markets in 2008 ... 64
Figure 3.3: The biggest 15 markets in 2009 ... 71
Figure 3.4: Overall efficiency scores of three years according to stage of development ... 81
Figure 3.5: TFP Index for 2007 - 2009 ... 84
Figure 3.6: Overall efficiency and TFP Index for Turkey ... 84
Figure 3.7: Overall efficiency and TFP Index for Spain ... 85
Figure 3.8: Intervals for three α levels ... 88
Figure 3.9: Graphical presentation of FDEA results ... 90
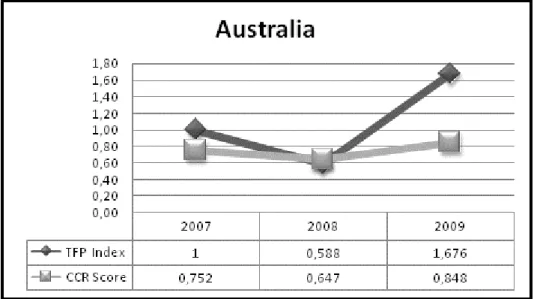
Figure 3.10: Efficiency scores for Austria... 96
ix
ABBREVIATIONS
Banker Chames Cooper : BCC
Chames Cooper Rhodes : CCR
Change in Efficiency : CE
Change in Technical Efficiency : CTE
Constant Returns to Scale : CRS
Data Envelopment Analysis : DEA
Decision Making Unit : DMU
Decreasing Returns to Scale : DRS
Fuzzy Data Envelopment Analysis : FDEA
Gross Domestic Product : GDP
Increasing Returns to Scale : IRS
Istanbul Stock Exchange : ISE
Linear Programming : LP
Minimax Regret Approach : MRA
Organisation for Economic Co-operation and Development : OECD
Total Factor Productivity : TFP
1. INTRODUCTION
Financial market is a broad term describing any marketplace where buyers and sellers participate in the trade of assets such as equities, bonds, currencies and derivatives. Financial markets are typically defined by having transparent pricing, basic regulations on trading, costs and fees and market forces determining the prices of securities that trade. Financial markets are divided into two: money markets and capital markets. Money markets fund short-term supply and demand whereas capital markets fund medium or long-term supply and demand. While the most important actors in the money markets are banks, this is stock exchanges in capital markets. The most important and common tools traded on stock markets are shares are and bonds.
When it is considered that value traded in 2009 in the world was about 80 trillion USD while total GDP of the world in 2009 was about 56 trillion USD, the importance of the stock markets can be understood easily. Every country in the world aims to get bigger shares in these markets.
Some reasons why a stock market is an important financial institution and produces huge amount of trading volume can be stated as follows (Rousseau and Wachtel, 2000, p.1936-1937):
- A stock market provides investors and entrepreneurs with a potential exit mechanism especially for venture capital investments.
- Foreign direct investment and portfolio investments enter into especially emerging market and transition economies through stock markets.
- The provision of liquidity through organized exchanges encourages both international and domestic investors to transfer their surpluses from short-term assets to the long-term capital market, where the funds can provide access to permanent capital for firms to finance large, indivisible projects that enjoy substantive scale economies - Since stock market provides important information, shareholders can benefit from this, managers become more careful about their decisions and benchmarking will be easier between companies.
2
There are a lot of studies which support the view that stock market positively contribute to economic growth and other benefits of stock markets. However, there are some negative approaches or reservations about stock markets. For instance Singh (1997) claims that the actual operation of the pricing and takeover mechanism even in well functioning stock markets lead to short termism and lower rates of long term investment particularly in firm specific human capital and because of this short termism managers are rewarded for their success in financial engineering instead of for creating new wealth through organic growth. Additionally, Singh (1971) argues that the takeover mechanism focuses on the basis of size rather than performance so a large inefficient firm gets a higher chance of survival than a small relatively efficient firm. Bhide (1994) argues that selling shares easily in very liquid markets weaken commitment and incentive to exert corporate control of investors (Yartey, 2008, p.5).
As seen, positive aspects of stock markets emphasized in the literature. The subject of this study is to examine the efficiency of stock markets with a country-based approach by using classical and fuzzy Data Envelopment Analysis methods.
For this study, efficiency can be defined as the degree of realization of the stock market objectives defined for a country as a result of the activities realized for reaching these goals. The methods for measuring efficiency can be classified under three headings: the ratio analysis, parametric methods and non-parametric methods. In this study Data Envelopment Analysis (DEA) which is one of the non-parametric methods is used as a method for evaluating stock market efficiencies of countries.
Data Envelopment Analysis is a relatively new, linear programming based, data oriented approach which is directed to frontiers rather than central tendencies for evaluating the performance or efficiencies of a set of peer entities called Decision Making Units (DMUs) which convert multiple inputs into multiple outputs (Cooper, 2004, p.1-3).
DEA is decided as a proper method to examine stock market efficiencies of countries because it does not need to have specific functional forms of relations between inputs and outputs, a large number of inputs and outputs can be considered at the same time in DEA and the weights of inputs and outputs are determined by the model.
3
DEA is used in different areas to evaluate efficiency such as banking, health and education. However, during the literature survey, any internationally cited article is found which examines the efficiency of stock markets by using DEA method.
Two important stages in DEA models are to determine DMUs and inputs and outputs. In this study, 45 countries of which 25 are developed countries and 20 are developing countries taken as DMUs. The 45 countries represent 90 percent of whole world in terms of market capitalization value and 95 percent of the whole world in terms of trading volume. For inputs variables Gross Domestic Product (GDP), GDP per capita and the first five pillars of Financial Development Report of World Bank is used. The first five pillars are namely; institutional environment, business environment, financial stability, banking financial services and non-banking financial services. As outputs variables three market-related variables are used. These variables are, market capitalization value in billion USD which is the sum of product of stock price by stock number; value traded in billion USD which is the value of buying or selling through year and turnover ratio as percent, which division of the value traded to average (current year and the year before current year) market capitalization.
Classical DEA is employed in the study for three years: 2007, 2008 and 2009. The change in efficiency over years is measured by using Malmquist Total Productivity Index which measures total factor productivity change over time using distance functions.
Most of the data regarding inputs and outputs can be evaluated imprecise or vague especially the data take place in Financial Development Report. In Financial Development Report all pillars and sub pillars are weighted with a conservative approach and have equal weights. In order to include imprecise data into the model Fuzzy Data Envelopment Analysis (FDEA) is employed in the study as a type of classical DEA and the results of two methods are compared. The efficiency scores in FDEA are found and ranked by Wang, Greatbanks and Yang (2005) approach.
4
In the second section there is a detailed literature survey about the relationship between the stock markets and economic growth and the determinants of the stock market development giving both theoretical and empirical dimensions. Also in the same section a detailed information about efficiency, Data Envelopment Analysis, Data Envelopment Analysis models, Malmquist Total Productivity Index and Fuzzy Data Envelopment Analysis.
The third section is the application section and includes stages of application, efficiency scores obtained by using classical DEA for years 2007, 2008 and 2009, target values and reference tables for these years, results of Malmquist Total Productivity Index, efficiency scores obtained by using fuzzy DEA, ranks of countries in terms of loss of efficiency by using Minimax Regret Approach and finally comparison of efficiency scores obtained by classical and fuzzy DEA.
In the last section the results reached in the study is summarized and some recommendations are presented for the further research and decision makers.
5
2. LITERATURE SURVEY
2.1 THE STOCK MARKETS AND ECONOMIC GROWTH
2.1.1 Financial Development and Economic Growth in General
There are a lot of academic researches on financial development and economic growth in the literature. Some of those researches include both banking sector and stock markets in their analyses. Some of them on the other hand, include either banking sector or stock markets in their works. In recent years, it is observed that the number of academic studies on relationship between development of stock markets and economic growth has increased.
There are five explanations for the causal relationship between financial development and reel sector backed economic growth (Blum 2002, p.6). These explanations will be mentioned below.
(a) No causal relationship: Any of the scholars on development economics, including Nobel Prize winners, do not see finance as a focus of research on development economics (Meir and Seers 1984). In addition, according to the neo-classics, who focus on external technological developments and growth in population, savings is not a determining element of long term economic growth. They also claim that financial intermediaries have not an effect on the increase in long term economic growth (Levine 1997, p. 688).
(b) Demand-following relationship: According to the Robinson (1952), financial development follows the development in the reel sector. As a result, demand for the financial services is formed. Lucas (1998) on the other hand, claims that the role of the development of financial sector on the economic growth is exaggerated unnecessarily (Deb and Mukherjee 2008, p. 143).
(c) Supply-leading relationship: Development of financial services provides development of reel sector. Gurley and Shaw (1955), Goldsmtih (1969), Mckinnon (1973), Levine and Zarvos (1998) have made researches that supports this argument.
6
(d) Financial development affects economic development negatively: In the post-Keynesian approach financial liberalization causes risky investment implementations, weak financial structures, and low reel sector growth rates. It also introduces opportunities for inefficient direct rent seeking facilities and it completely distorts growth (Grabel 1995, pp.127–130). New Keynesian theory (Stiglitz and Weiss, 1981), on the other hand, claims that market equilibrium can be neither a law nor a necessary assumption for competitive analysis in the financial markets (Auerbach and Siddiki 2004, p. 243).
(e) Reciprocal causality between financial development and economic growth: Financial markets develop as a result of economic growth. As a result, it contributes to the real economic growth with its feedback effect. Therefore, there can be mentioned a two sided relationship between development and economic growth rather than a one sided causal relationship. Patrick (1966) claims that real sector is an important element of development of financial sector in the economies of underdeveloped countries, whereas in developed countries finance fits more and more to do Demand-following approach (Blum 2002, p. 7). Lewis (1955), Greenwood and Jovanovic (1990), Berthelemy and Varoudakis (1996), Greenwood and Smith (1997) have made studies that supports this argument.
Scholars that support supply-leading approach emphasize that functions that were provided during the economic growth process and financial liberalization have positive effects on economic growth. On the other hand, scholars that support demand-following approach claims that financial system can be developed as a result of economic growth. Studies that support supply-leading approach constitute the majority in the Literature. Pioneer studies that deal with financial development and economic growth with supply-leading approach are Schumpeter (1912), Gurley and Shaw (1955), and Goldsmith (1969).
Joseph Schumpeter (1912) claims that services like mobilization of savings, evaluation of projects, management of risk, monitoring of managers, and facilitation of operations, which are provided by financial intermediaries, forms foundation for technological innovation and economic growth (King and Levine 1993, p. 717).
7
One of the most comprehensive studies that analyses the channels by which financial development effects economic growth was made by Pagano (1993). Pagano examines both the direction of causal relationship between financial development and economic growth and the way that financial development affect economic growth (whether increasing investment efficiency or investment rate). Pagano (1993) claims financial intermediaries can affect economic growth by effecting social marginal efficiency of capital, transfer rate of savings to investments, and private saving rate (Pagano 1993, pp. 614–615).
According to the Pagano (1993), during the process of transformation of savings to investments, the effect of financial development on economic growth will increase even more in case of a reduction on transaction costs, commissions and fees that banks and the stock markets demand (p.615). Financial intermediaries, increase economic growth through increasing productivity of capital by way of promoting investment of more risky but more productive investment projects by their ability on information gathering and risk sharing (p.615). Development of capital markets may affect the saving rate which can affect economic growth. Risk sharing, household loans and interest rate affect rate of saving. As a result of risk sharing that is provided by financial intermediaries, decrease in saving rates has a negative impact upon economic growth (p. 617). Liquidity constraints increase saving rates in case consumption is made by current sources. The increase in the total saving rates transforms to a more rapid growth. In contrast, increase in credits on consumption or mortgages causes a decrease both in savings and the growth (pp. 617-618). Financial pressure and imperfect competition markets cause the interest rates that paid to people whose marginal propensity to consume is high to be lower than the normal interest rates that is expected. In this case, there will be a depreciation of marginal product of capital (pp. 618–619).
2.1.2 The Stock Market Development and Economic Growth
It is widely accepted that financial development is closely related with economic growth. Especially for developing countries, there are a lot of studies on the relation between stock market development and economic growth.
8
Throughout the last twenty years, majority of the academic studies claim a positive relation between stock market development and economic growth. [Levine (1991,1997), Atje and Jovanovic (1993), Devereux and Smith (1994), Obstfeld (1994), Demirgüç-Kunt and Levine (1995), Bencivenga et al. (1996), Levine and Zervos (1993, 1995, 1998), Singh (1997), Rousseau and Wachtel (2000), Khan and Senhadji (2000), Arestis et al (2001), Van Nieuwerburgh (1998, 2005), Beck and Levine (2003), Rousseau and Sylla (2003), Beck and Levine (2004)]. In the following paragraphs of this section it will be tried to explain significant academic studies on the relation between stock market development and economic growth.
Atje and Jovanovic (1993) used the ratio of value traded to GDP for stock market in their cross-section analysis in which they used ordinary least squares. They also used real growth per capita as the indicator for economic growth. In their study, they examined 40 countries over the period 1980-1988. Their results indicate that there is a strong relationship between economic growth and the stock market development (Atje and Jovanovic 1993, pp. 632–640).
Levine and Zervos (1998) examined 47 countries for the period between 1976 and 1993. They used the ratio of market capitalization to GDP as the indicator of the stock market development. They also used turnover ratio (trading volume to average market value) as the liquidity indicator. They examined increase in economic growth (real GDP per capita), capital accumulation, efficiency (economic growth-0.3xcapital accumulation), and saving rates (private savings in terms of GDP in percentage) by the indicators related to stock market. In addition, they used variables related to integration of international financial markets and volatility in stock markets. As a result, they found a significant relation between liquidity indicators in stock markets and economic growth, capital accumulation, and increase in efficiency. However, they could not find a direct relationship between variables mentioned above and market value and volatility. Another finding of their study is banking sector and stock markets are not substitutes but complementary (Levine and Zervos 1998, pp. 537–558).
Due to the problems on econometrics methods in the study of Levine and Zervos (1998), Beck and Levine (2004) made another attempt to examine the same subject by
9
using panel data sets and generalized moments method developed for dynamic panels with similar indicators over the period 1976-1998 for 40 countries.
Beck and Levine (2004) did not use value traded because according to them value traded does not accurately measure market liquidity and if markets are on the rise value traded forecasts economic growth higher as a result of rising stock prices. They also eliminate market capitalization because of the fact that the relationship between market capitalization and economic growth is not significant. Instead they used turnover ratio as an indicator of stock market development. As the indicator of economic growth, they used real GDP per capita. In conclusion they found that the hypothesis that there is no relationship between financial development and economic growth is null. Both banking sector and stock markets have a positive impact upon economic growth. In addition, they put forward stock markets provides different services than banks and stock markets support economic growth independent from banking sector (Beck and Levine 2004, pp. 427–440).
Arestis et al. (2001) used quarterly data of 5 countries in their advanced time series techniques. They used the ratio of market capitalization to GDP as a stock market development indicator. They also used real GDP as an economic growth indicator. According to the analysis results, stock market development has a positive impact upon economic growth but the significance of banking sector is less than the stock markets (Arestis et al 2001, pp. 24–37).
Kulatrane (2001) examined the effect of financial deepening on the long run economic growth for a period of 38 years (1954-1992) in South Africa. He used value traded as an indicator of stock market development level and real GDP per capita as an indicator of economic growth. He also included interest rate, investment rate, and human capital as other indicators in his study. He developed two models by using VECM Structure. In MODEL I, he searched that whether financial system effects real GDP per capita directly or indirectly through investment rate or not. In MODEL II on the other hand, he made the same analysis by considering possible feedback effects. Model results indicate that financial deepening strengthens economic growth in South Africa but this occurs indirectly by saving rates. In addition, in MODEL II he also concluded that stock
10
markets have a more significant effect on real GDP per capita (Kulatrane 2001, pp. 3– 25).
Rousseau and Wachtel (2000) used both cross-section and generalized moments dynamic panel data methods for 47 countries over the period of 15 years between 1980 and 1995. In cross-section model, they used the ratio of market capialization to GDP and value traded as the indicators of stock market development. In panel data model on the other hand they used market capitalizatiıon and value traded. As for the economic growth indicator they used real GDP. According to the croos-section model results, stock market development has a positive impact on economic growth in accordance with supply-leading approach. Results of panel data method indicate that both market capitalization and value traded effects economic growth positively nevertheless effect of value traded is greater and more permanent. In conclusion, market liquidity has very significant effect on economic growth (Rousseau and Wachtel 2000, pp.1938–1956). Rajan and Zingales (1998) examined 41 countries for the period 1980-1990 whether industrial sectors that are relatively more in need of external finance develop disproportionately faster in countries with more-developed financial markets. They used the ratio of annual average real growth rate to the value added in industry and, net investments as indicators of growth rate of industries. They also used the ratio of stock market capitalization to the GDP and current accounting standards as financial development indicators. The results of their studies show that financial development, in firms that are intensely in need of external finance, reduce cost of external finance and have a positive impact upon economic growth and also it plays a significant role in emergence of new firms (Rajan and Zingales 1998, pp. 559–586).
Beck et al. (2008) studied growth rates of different industries by considering financial development levels of countries. They examined 36 industries from production sectors of 44 countries. For development they used private sector credit data as an indicator. The results indicate that the industries which are formed heavily by small firms, develops disproportionately in the countries that have developed financial systems. Small firms in financially developed countries have greater share in the total value added produced in the whole economy in comparison to the small firms of a financially less developed country. Therefore financial development causes a disproportionate
11
development of small firms and also it increases value added that firms produced. According to the authors, this study is a complimentary to those of Guiso, Sapienza and Zingales (2004); Cetorelli and Strahan (2006); Kumar, Rajan and Zingales (2001). Additionally, Beck et al (2008) used stock market turnover ratio and value traded as an indicator of financial development in their alternative model. In this model, it is shown that small firms progress more rapidly in the countries with developed financial systems.
Yeniel (2009) examined the effects of banking sector and stock market development on economic growth in the 29 countries that are whether EU member or candidates, over the period 1993-2007. In their study they used static and dynamic panel data analyses, panel co-integration analysis, and causality analyses. According to the static regression results, in developing countries, development of banking sector is more significant on economic growth than the developed countries whereas in developed countries development of stock markets is more influential on economic growth. According to the results of the dynamic regression model development of stock markets is more significant in both developing and developed countries. In addition, it was pointed out that these relations are also valid in the long run (Yeniel, 2009).
In the literature, there are also researches on single countries rather than a group of countries on the relationship between stock markets and economic growth.
Nowbutsin and Odit (2009) examined the effects of stock market development on economic growth in both short and long run for Mauritius over the period of 1989-2006. They used the ratio of market capitalization to GDP and value traded to GDP as stock market development indicator. They also used secondary enrollment ratio and the ratio of foreign direct investments to GDP as indicators of economic growth. They concluded that development of stock markets have a positive effect on the economic growth both in the long run and short run (Nowbutsin and Odit 2009, pp. 77-88).
Van Nieuwerburg et al (2006) examined the effects of financial development on economic growth in Belgium for 4 different periods (1830-2002) based on their distinctive characteristics. They used co-integration and Granger causality tests. They mainly used data based on banking sector along with data on market capitalization as an
12
indicator for stock markets. They claimed that financial development and financing that are based on stock markets are significant determinants on economic growth.
The reasons for contribution of stock markets on economic growth, along with the increase of liquidity in trade in the post 1873 era, are removal of regulative barriers to companies with limited liability and removal of barriers to trading of shares of companies that are listed in the stock exchanges. Additionally, stock market development is a better forecaster of economic growth than bank-based development (Van Nieuwerburg et al 2006, pp. 13-38).
Hossain and Kamal (2010), examined the existence of a causal relationship and cointegration between stock markets and economic growth in Bangladesh for a period of 1976-2008. In the study, they used the ratio of market capitalization to GDP as an indicator of stock market development. They also used real GDP per capita and real GDP growth rate as indicators of economic growth. As a result, they claimed that stock market development and economic growth have the similar stochastic trend thus they have mutual dependence. Direction of the causality is from stock market development to the economic growth. As for the Bangladesh economy, they found out that stock market development affects economic growth significantly (Hossain and Kamal 2010, pp. 87-95).
Ake and Ognaligu (2010) examined the relationship between stock markets and economic growth in Cameroon over the period 2006-2010. They used Granger based Sims causality test in their study. Researchers used real GDP per capita as indicator of the economic growth. They also used the ratio of market capitalization to GDP, the ratio of value traded to GDP, and turnover ratio as indicators of stock market development. According to the results, contrary to the all other results in the literature, stock markets in Cameroon do not affect the economic growth (Ake and Ognaligu 2010, pp. 82-88). Deb and Mukherjee (2008) examined the relationship between stock market development and economic growth by using unit root and long run Granger non-causality tests in India over the period 1996-2007. They used growth in the real GDP per capita as indicator of economic growth. They also used the ratio of market capitalization to the real GDP and the ratio of total value traded to real GDP as the
13
indicators of development level of stock markets in the country. They concluded, in accordance with supply-leading approach, that there is a causal relationship from stock market to economic growth in case real value traded and volatility are taken into account. In addition, they found out that there is a reciprocal relationship between economic growth and real market capitalization (Deb and Mukherjee 2008, pp. 142-149).
Dritsaki and Dritsaki-Bargiota (2005), examined the causal relationships between stock markets, banking sector, and economic growth in Greece for the period of 1988-2002. They used market capitalization as the indicator of stock market development. They also used money supply as the banking indicator and the industrial production as the indicator of economic growth. According to the results, there is a reciprocal relationship between banking sector and economic growth. The way of the relation is from economic growth to stock markets as indicated in the demand-following approach. Furthermore, they could not find a causal relationship between banking sector and stock markets (Dritsaki and Dritsaki-Bargiota 2005, pp. 113-127).
Athanasios and Antonios (2010) used Vector Error Correction model and co-integration tests in their research to find out causal relationship between stock markets, credit markets, and economic growth both in the long run and in the short run. They used growth rate of real GDP as the indicator of economic growth; stock market general index as the stock market indicator; and the percentage of credits given to domestic private sector by banking sector to GDP as the credit markets indicator. In conclusion, they found out a one-side causal relation from economic growth towards stock markets in harmony with demand-following approach (Athanasios and Antonios 2010, p. 33-42).
Müslümov and Aras (2002), examined the relationship between economic growth and stock markets for 22 OECD countries including Turkey over the period 1982-2000. They used panel data method and Granger causality tests. Müslümov and Aras used real GDP per capita as the indicator of economic growth; and they also used the ratio of market capitalization to GDP and the ratio of value traded to GDP as the indicators of stock market development. In some countries such as Turkey, Austria, Denmark, Germany, Italy, Luxembourg, Mexico, and Norway, they could not find any causal
14
relationship between stock markets and economic growth. In other countries such as Canada, Finland, Spain, and Sweden, they found out a one-sided causal relationship (as in the supply-leading approach) materialized by market capitalization. According to the research results, direction of causal relationship between stock market development and economic growth does not change both in the short run and in the long run (Müslümov and Aras 2002, pp. 90-100).
2.1.3 The Stock Market Development and Economic Growth in Turkey Ağır (2003), examines the effects of variables which are related to the banking and stock markets on economic growth using econometrics methods such as the unit root test, cointegration analysis and the three-month data for the period 1987-2002. He concludes that for examined period, ISE has a positive contribution to economic growth and the relationship between banking and the ISE is weak.
Yücel (2009), examines the effect of capital market development on economic growth in Turkey using the monthly data for the period of 1997-2007 and principal component analysis, unit root tests and cointegration tests methods. In the study as indicators of sophistication of capital market; international integration (stock index investments to ISE index), trading volume of Istanbul Stock Exchange to GDP, the total traded value of ISE to ISE index and ISE index, as an indicator of economic growth the real GDP per capita are taken. As a result, it is concluded that there is a long-term positive relationship between the development of capital markets and economic growth.
Gokdeniz, Erdogan and Kalyüncü (2003), using quarterly data for the period 1989-2002 and the Least Squares method find that the stock market in Turkey does not support economic growth, private bonds do not have explanatory power on growth, the increase in the rate of the total commercial bank assets does not support economic growth. Additionally they find money explains growth and inflation has a negative effect on growth.
Karagöz and Armutlu (2007), examined the relationship between stock market development and economic in Turkey using quarterly data for GDP and SE-100 for the period 1988-2006. In their research which is using Granger causality test, they finds
15
economic growth is the reason of the development in stock market, whereas the stock market development does not have an impact on economic growth.
Kar and Pentecost (2000), examined the relationship between Turkey's banking sector development and economic growth and the direction of causality for the period 1963-1995 using cointegration and Granger causality tests. In the study, money to income ratio, bank deposit liabilities to income ratio, private sector credits to income ratio, ratio of the domestic private sector credits in loans and domestic loans to income has been taken as development indicators of the banking sector and GDP has been taken as theindicator of economic growth. As a result a causal relationship has been identified between financial development and economic growth in the long term. However, there is not a absolute decision about the direction of causality, considering the results obtained in the studied period, it is concluded that in line with demand-following approach there is a causal relationship from economic growth to financial development in Turkey.
2.2 THE DETERMINANTS OF THE STOCK MARKET DEVELOPMENT
2.2.1 The Determinants of The Stock Market Development
When the studies that are investigating the determinants affecting the development of the stock markets are examined, the author of this thesis can state that they can be classified in two main subtitles: (1) Macroeconomic Factors (2) Institutional / Structural Factors.
Macroeconomic factors are income level, growth rate, investment rate, savings rate, inflation, foreign investment, macroeconomic stability, currency stability and similar factors.
Structural / Institutional factors can be divided into three in their own.
(a) Legal Structure and Institutions: These factors related to the legal structure and the applications such that property rights, shareholder protection, legal origin (French, English, German and so on), strengths of legal rights, accounting standards, disclosure
16
policies, sanctions and regulations, transparency, the efficiency of the courts, contract enforcement and similar factors.
(b) Financial and Economical Structure: These factors are liberalization, trade openness, the dominant character of the financial system (banking based or market based), banking and insurance sectors, cost of doing business, human capital, remittances and similar factors.
(c) Administrative Structure and Risk: These factors are corruption, bureaucratic quality, the effective applicability of regulations, accountability, the level of intervention in the economy, willingness to delegate, political rights and political risks. The results obtained from empirical studies (some of them will be explained in detail in next section) on the factors affecting development of the stock markets can be summarized according to factors as follows:
Macroeconomic Factors: In general, although there are the different opinions about the direction of causality, there is a strong and positive relationship between macroeconomic factors such as income level, growth rate, investment rate, savings rate, foreign investment, macroeconomic stability and the stock market development (Yartey 2008; Naceur et al. 2007; Garcia and Liu 1999; Wassal and Kamal 2005).
Legal Structure and Institutions: Generally, the countries has developed stock markets when they have advances in the level of protection of property rights, the level of shareholder protection, accounting standards, disclosure policies and sanctions, the effectiveness of the courts, and similar factors is more advanced countries with more developed stock market. The listed factors above are associated with both the level of development of the countries and legal origin of the countries. Common (English) law countries are more suitable for development of the specified factors and thus the stock markets rather than Civil (Roman) law countries (Buchanan and English 2007; La Porta et al. 1998; Demirgüç-Kunt and Levine 1999).
Financial and Economical Structure: There is a positive relationship stock markets and banking and non-banking financial sectors although according to the different stages of development the nature and direction may vary, also they are complementary
17
and not competing with each other (Yartey 2008; Naceur et al. 2007; Demirgüç-Kunt and Levine 1995; Garcia and Liu 1999). When the countries are categorized as market-based and bank-market-based, it is seen that the stock markets are more developed in more developed and common-law origin countries and the banking sector is more developed in civil-law origin countries. (Ergüngör 2004; Demirgüç-Kunt and Levine 1999). In addition, financial openness and liberalization in general positively affect the development of stocks markets (Levine and Zervos 1998; Wassal and Kamal 2005; Chinn and Ito 2006).
Administrative Structure and Risk: Although there are different findings about the degree of influence, the factors related to the administrative structure and risk such as the level of corruption, bureaucratic quality, the effective applicability of regulations, accountability, the level of intervention in the economy, political rights and political risks usually have a strong influence on the stock market development (Lombardo and Pagano 2000; Yartey 2008; Billmeier and Massa 2008).
2.2.2 Empirical Studies
In this part, empirical studies related to the determinants of the stock market development will be explained in detail.
Yartey (2008) examined the macroeconomic and institutional determinants of stock market development in emerging economies using a panel dataset of 42 countries for the period 1990 to 2004. The dependent variable in study the level of Stock Market Development measured by the value of listed shares divided by GDP, the explanatory variables and their measures used in the study are as follows:
- Income Level: Log GDP per capita in US dollars
- Banking Sector Development: The value of domestic credit provided by the banking system to the private sector relative to GDP
- Savings and Investment: Gross domestic savings as percentage of GDP and gross domestic investments as a percentage of GDP
- Stock Market Liquidity: The value traded as a percentage of GDP. - Macroeconomic Stability: Real interest rate and current inflation
18
- Private Capital Flows: Foreign direct investment as a percentage of GDP and net private capital flows as a percentage of GDP.
- Institutional Quality: A composite index of four components from the International Country Risk Guide used as a measure of institutional quality: law and order, bureaucratic quality, democratic accountability and corruption.
He found some important results:
- Income level, domestic investment, banking sector development, private capital flows, and stock market liquidity are important determinants of stock market development in emerging markets.
- At early stages of stock market development, the banking sector is a compliment to the stock market in financing investment but as they both develop, banks and the stock market begin to compete with each other.
- Institutional quality is important determinant of stock market development in emerging markets.
- The main factors explaining the development of the stock market in emerging market countries can also valid in South Africa.
Frost, Gordon and Hayes (2006) examined the relationship between stock exchange disclosure systems (rather than actual company disclosures) and market development at 50 of the member stock exchanges of the World Federation of Exchanges during 1997-1998. They computed market development as the mean of five variables standardized before aggregation. (1) stock market capitalization held by minorities deflated by gross domestic product, (2) number of listed domestic companies deflated by country population (3) number of newly listed domestic companies deflated by country population (4) annual number of transactions in equity shares deflated by year-end market capitalization and (5) annual adjusted domestic trading volume deflated by year-end market capitalization. They found that in addition to legal protections and institutions the strength of the disclosure system that is disclosure rules, monitoring, and enforcement is positively associated with market development, after controlling for legal system, legal protection of investors, market size. Thus it can be concluded that the disclosure system is critical for development of the stock markets.
19
Naceur et al. (2007) examined the main macroeconomic determinants of stock market development and the impact of financial intermediary development on stock market capitalization using a sample of twelve MENA region countries over a varying period. The countries in the study are Bahrain, Egypt, Iran, Jordan, Kuwait, Lebanon, Morocco, Oman, Qatar, Saudi Arabia and Tunisia. They found that saving rate, financial intermediary (measured by credit to private sector), stock market liquidity (measured by the ratio of value traded to GDP) and the stabilization variable (measured by inflation change) are the important determinants of stock market development. Other findings of the study are income and investment are not significantly important for stock market development and banking sectors and stock markets are complements rather than substitutes in the growth process.
Billmeier and Massa (2009) examined the relation between the stock market capitalization and the determinants of stock market capitalization in a panel of 17 emerging markets in the Middle East and Central Asia, including both hydrocarbon-rich countries and economies without sizeable natural resource wealth. They included additional variables to their study: an institutional variable measured by the help of the “Economic Freedom Index” of Heritage Foundation and remittances. They found that both institutions and remittances have a positive and significant impact on market capitalization especially in countries without significant hydrocarbon sectors; whereas in resource-rich countries stock market capitalization is mainly driven by the oil price. Levine and Zervos (1998) examined whether the indicators of stock market development change following the liberalization of specific capital controls in 16 countries including Turkey. They took the ratio of market capitalization to Gross Domestic Product (GDP), the ratio of total value traded to GDP, the ratio of total value traded to market capitalization (turnover ratio), and the volatility of stock returns as indicators of stock market development. They used the International Capital Asset Pricing Model (ICAPM) and the International Arbitrage Pricing Model (IAPM) to compute monthly measures and then analyzed the time-series behavior of these integration measures before and after policy changes in the liberalization of specific capital controls.
20
They found that stock markets tend to become larger, more liquid, and more volatile following the liberalization of restrictions on international portfolio flows and 10 out of 16 national markets exhibit significant signs of becoming more integrated internationally following the liberalization of investment and repatriation restrictions. They also examined the relationship between the indicators of stock market development and three regulatory indicators; the availability and quality of published information on listed firms, the level of accounting standards and the intensity of investor protection laws. They found that the results do not support the hypothesis that imposing internationally accepted accounting and investor protection rules will promote stock market development.
Wassal and Kamal (2005) investigated the relationship between stock market growth measured by the mean of the logarithm of market capitalization/GDP and trading value/GDP and economic growth, financial liberalization policies, foreign portfolio investment and country risk in 40 emerging economies between the period 1980–2000 over four distinct time periods: 1980–84; 1985–89; 1990–94; and 1995–99. They constructed their stock market development model in light of Calderon-Rossell‟s model and the previous discussion. They used Two Stages Least Squares combined with Fixed Effect technique.
The explanatory variables used in the study and their measures are as follows: Economic growth: the logarithm of GNP per capita growth rate
Additional liquidity: the logarithm of the turnover ratio
Financial and economic policies: the number of listed companies, foreign direct investment to relative GDP, exports plus imports relative to GDP
Foreign portfolio investment: investment liabilities divided by GDP
Country risk: Political, financial and economic components of International Country Risk Guide.
By analyzing the results of the model they found that economic growth, financial liberalization policies, and foreign portfolio investments are the important factors for stock markets‟ growth compatible with demand-following approach and the political risk variable is not significant for stock market development.
21
Chinn and Ito (2006) investigated whether financial openness leads to financial (banking and stock markets) development after controlling for the level of legal development using a panel including 108 countries over the period 1980 to 2000. Their findings stated in the article are as follows:
- A higher level of financial openness contributes both directly and in an interactive manner with legal and institutional development to the development of equity markets but only if a country is equipped with a reasonable level of legal and institutional development
- A higher level of bureaucratic quality and law and order, as well as the lower levels of corruption, may enhance the effect of financial opening in fostering the development of equity markets.
- Among emerging market countries, the overall level of finance-related legal/institutional development increases stock market trading volumes and enhances the effect of financial openness. However, the finance related legal/institutional (level of creditor protection, effectiveness of the legal system in enforcing contracts, shareholder protection, the comprehensiveness of company reports) variables do not exhibit as strong an effect as the general legal/institutional variables( level of corruption, law and order, and the quality of the bureaucratic system)
- Liberalization in cross-border goods transactions is a precondition for capital account liberalization, the development in the banking sector is a precondition for equity market development and that the developments in these two types of financial markets have interactive effects.
Demirgüç-Kunt and Levine (1995), in their study examined the relationship between institutions of financial intermediation and stock markets for the period 1986-1993 in 41 countries. The main implication of their study is that the level of stock market development is highly correlated with the development of the banks, nonbanks, and insurance companies, and private pension funds. Other findings of their study are as follows:
- Big markets tend to be less volatile, more liquid and less concentrated in a few stocks
22
- Internationally integrated markets tend to be less volatile, and institutionally developed markets tend to be large and liquid.
- The three most developed markets are Japan, the United States, and Great Britain
- The most underdeveloped markets are Colombia, Venezuela, Nigeria, and Zimbabwe.
- Korea, Switzerland, and Malaysia have highly-developed stock markets, - Turkey, Greece, Argentina, and Pakistan have underdeveloped markets.
- Some of emerging countries‟ markets such as Hong Kong, Singapore, Korea, Malaysia, and Thailand are more developed than some of developed countries‟ markets such as France, the Netherlands, Australia, Canada, Sweden, and Norway.
Garcia and Liu (1999) examined the macroeconomic determinants (real income, saving rate, financial intermediary development, stock market liquidity and macroeconomic stability) of stock market development in fifteen industrial and developing countries from 1980 to 1995. These countries include seven countries in Latin America, six countries in East Asia, and two industrial countries: the United States and Japan. The dependent variable in the study is market capitalization defined as the total market value of all listed shares divided by GDP. Explanatory variables and their measures are as follows:
Real income: real GDP in U.S. dollars
Income growth rate: Calculated by using real income
Financial intermediary development: Domestic credit to the private sector divided by GDP, the ratio of broad money supply M3 to GDP
Stock market liquidity: The ratio of total value traded to GDP, the ratio of the total value traded divided by market capitalization
Macroeconomic stability: Inflation rate, inflation change, the standard deviation of inflation rate
They found that the real income level, saving rate, financial intermediary development, and stock market liquidity are important determinants of market capitalization, while macroeconomic stability does not prove significant. They also found that stock market
23
development and financial intermediary development are complements instead of substitutes.
La Porta et al. (1998) is one of the pioneers who investigated effect of legal origins on finance. In their study “Law and Finance” they examined legal rules covering protection of corporate shareholders and creditors, the origin of these rules and the quality of their enforcement in 49 countries by classifying them according to origin of their commercial laws. The authors categorize the commercial laws as two broad traditions: common law which is English in origin and civil law which is Roman in origin. There are three major families in civil law with some differences: French, German and Scandinavian. They state in their study that in terms of legal protection and rights of shareholders and creditors common-law countries are the strongest, French-civil-law countries are the weakest. German-civil-law and Scandinavian countries fall between them. Also in terms of the quality of law enforcement German-civil-law and Scandinavian countries are the strongest and French-civil-law countries are the weakest, common-law countries come before French-civil-law countries. In addition they observe that the shares of largest public companies belong to limited number of investors in countries that fail to protect shareholders‟ rights.
La Porta et al. (2006) examined securities laws specially laws governing initial public offerings in 49 countries in relation with stock market development. They cite three alternative hypotheses in the literature and test them. The null hypothesis is to leave securities markets unregulated. Other two alternative hypotheses assume that regulation is necessary but differ in what kind of government intervention would be optimal within such a framework. They use 8 variables in their study: disclosure requirements, liability standards, supervisor characteristics, rule-making power, investigative power, orders, criminal sanctions, and public enforcement.
In conclusion, they states that the null hypothesis is invalid, that is, regulations are necessary because financial markets do not prosper when left to market forces alone and regulations facilitate private contracting rather than provide for public regulatory enforcement. They also point out that both extensive disclosure requirements and standards of liability facilitating investor recovery of losses are associated with larger stock markets. Finally, they states that legal origin predicts stock market development
24
for instance, common-law emphasis on private contracting and standardized disclosure and reliance on private dispute resolution using market-friendly standards of liability. Buchanan and English (2007) investigated how legal foundation influences the return distribution, the growth rate of market capitalization, the ratio of market capitalization to gross domestic product (GDP) and the correlation structure of emerging market indices with developed market indices using a sample of 24 emerging markets over the period 1976-1999. They found that emerging markets from the French-civil law systems earned higher returns, have higher correlations with the world market portfolio, higher average growth rates in market capitalization and lower average market capitalization to GDP than their English common- law countries. Additionally, most emerging markets returns are more highly correlated to the returns of developed markets with an English common law tradition. They suggest in their study that market capitalization to GDP can be a better way to classify markets as emerging for the purposes of financial market research.
Demirgüç-Kunt and Levine (1999) examined cross-section of roughly 150 countries in order to analyze how the size, activity, and efficiency of financial systems differ across different per capita income groups, define different indicators of financial structure and identify different patterns as countries become richer, and investigate legal, regulatory, and policy determinants of financial structure after controlling for per capita GDP. They give the results of their study as follows (pp.4-5):
- Banks, other financial intermediaries, and stock markets all grow and become more active and efficient as countries become richer. As income grows, the financial sector develops.
- In higher income countries, stock markets become more active and efficient than banks. Thus, financial systems tend to be more market based.
- Countries with a common law tradition, strong protection for shareholder rights, good accounting standards, low levels of corruption, and no explicit deposit insurance tend to be more market-based, even after controlling for income.
- Countries with a French civil law tradition, poor accounting standards, heavily restricted banking systems, and high inflation generally tend to have underdeveloped financial systems, even after controlling for income.
25
Ergüngör (2004) finds interesting results somewhat similar to the results Demirgüç-Kunt and Levine (1999). In common-law countries which courts enforce laws effectively, providing them with more detailed creditor and shareholder protection laws has a greater impact on the development of financial markets compared with civil-law systems, both banking and stock markets tend to be more developed, whereas civil-law countries tend to be bank-oriented. In that stage one can think which structure is more preferable for economic growth. Levine (2002) studies this problem and finds that there is no doubt that overall financial development is related with economic growth but there is no empirical support for either the bank-based or the market-based view.
2.3 EFFICIENCY AND DATA ENVELOPMENT ANALYSIS
2.3.1 Efficiency and Related Concepts
The concepts efficiency, productivity and performance are often used instead of each other and they are related concepts but have different meanings.
Efficiency is the degree of realization of the objectives defined for an organization as a result of the activities realized for reaching these goals (National Productivity Center, Glossary of Productivity).
Performance is a general concept that includes efficiency, productivity, quality, innovation and profitability (Kecek 2010, p. 14). As seen the essential difference between performance and efficiency is that performance considers time and quality. Productivity is a dimension of performance like efficiency and can be defined most generally as the value obtained by the ratio of goods or services produced to inputs to produce these goods or services (National Productivity Center, Glossary of Productivity). As seen the essential difference between productivity and efficiency is that productivity is usually based on only one input and one output and considers time.