This is the accepted manuscript made available via CHORUS. The article has been published as:
Study of ψ(3686)→π^{0}h_{c}, h_{c}→γη_{c} via η_{c}
exclusive decays
M. Ablikim et al. (BESIII Collaboration)
Phys. Rev. D 86, 092009 — Published 19 November 2012 DOI: 10.1103/PhysRevD.86.092009
DW11037
REVIEW COPY
NOT FOR DISTRIBUTION
Study of ψ(3686) → π
0h
c
, h
c→
γη
cvia η
cexclusive decays
M. Ablikim1, M. N. Achasov5, O. Albayrak3, D. J. Ambrose39, F. F. An1, Q. An40, J. Z. Bai1, Y. Ban27, J. Becker2, J. V. Bennett17, M. Bertani18A, J. M. Bian38, E. Boger20,a,
O. Bondarenko21, I. Boyko20, R. A. Briere3, V. Bytev20, X. Cai1, O. Cakir35A, A. Calcaterra18A, G. F. Cao1, S. A. Cetin35B, J. F. Chang1, G. Chelkov20,a, G. Chen1,
H. S. Chen1, J. C. Chen1, M. L. Chen1, S. J. Chen25, X. Chen27, Y. B. Chen1, H. P. Cheng14, Y. P. Chu1, D. Cronin-Hennessy38, H. L. Dai1, J. P. Dai1, D. Dedovich20, Z. Y. Deng1,
A. Denig19, I. Denysenko20,b, M. Destefanis43A,43C, W. M. Ding29, Y. Ding23, L. Y. Dong1, M. Y. Dong1, S. X. Du46, J. Fang1, S. S. Fang1, L. Fava43B,43C, F. Feldbauer2, C. Q. Feng40,
R. B. Ferroli18A, C. D. Fu1, J. L. Fu25, Y. Gao34, C. Geng40, K. Goetzen7, W. X. Gong1, W. Gradl19, M. Greco43A,43C, M. H. Gu1, Y. T. Gu9, Y. H. Guan6, A. Q. Guo26, L. B. Guo24,
Y. P. Guo26, Y. L. Han1, F. A. Harris37, K. L. He1, M. He1, Z. Y. He26, T. Held2, Y. K. Heng1, Z. L. Hou1, H. M. Hu1, T. Hu1, G. M. Huang15, G. S. Huang40, J. S. Huang12, X. T. Huang29,
Y. P. Huang1, T. Hussain42, C. S. Ji40, Q. Ji1, Q. P. Ji26,c, X. B. Ji1, X. L. Ji1, L. L. Jiang1, X. S. Jiang1, J. B. Jiao29, Z. Jiao14, D. P. Jin1, S. Jin1, F. F. Jing34, N. Kalantar-Nayestanaki21,
M. Kavatsyuk21, W. Kuehn36, W. Lai1, J. S. Lange36, C. H. Li1, Cheng Li40, Cui Li40, D. M. Li46, F. Li1, G. Li1, H. B. Li1, J. C. Li1, K. Li10, Lei Li1, Q. J. Li1, S. L. Li1, W. D. Li1, W. G. Li1,
X. L. Li29, X. N. Li1, X. Q. Li26, X. R. Li28, Z. B. Li33, H. Liang40, Y. F. Liang31, Y. T. Liang36, G. R. Liao34, X. T. Liao1, B. J. Liu1, C. L. Liu3, C. X. Liu1, C. Y. Liu1, F. H. Liu30, Fang Liu1,
Feng Liu15, H. Liu1, H. H. Liu13, H. M. Liu1, H. W. Liu1, J. P. Liu44, K. Y. Liu23, Kai Liu6, P. L. Liu29, Q. Liu6, S. B. Liu40, X. Liu22, Y. B. Liu26, Z. A. Liu1, Zhiqiang Liu1, Zhiqing Liu1,
H. Loehner21, G. R. Lu12, H. J. Lu14, J. G. Lu1, Q. W. Lu30, X. R. Lu6, Y. P. Lu1, C. L. Luo24, M. X. Luo45, T. Luo37, X. L. Luo1, M. Lv1, C. L. Ma6, F. C. Ma23, H. L. Ma1, Q. M. Ma1,
S. Ma1, T. Ma1, X. Y. Ma1, Y. Ma11, F. E. Maas11, M. Maggiora43A,43C, Q. A. Malik42, Y. J. Mao27, Z. P. Mao1, J. G. Messchendorp21, J. Min1, T. J. Min1, R. E. Mitchell17, X. H. Mo1,
C. Morales Morales11, C. Motzko2, N. Yu. Muchnoi5, H. Muramatsu39, Y. Nefedov20, C. Nicholson6, I. B. Nikolaev5, Z. Ning1, S. L. Olsen28, Q. Ouyang1, S. Pacetti18B, J. W. Park28,
M. Pelizaeus37, H. P. Peng40, K. Peters7, J. L. Ping24, R. G. Ping1, R. Poling38, E. Prencipe19, M. Qi25, S. Qian1, C. F. Qiao6, X. S. Qin1, Y. Qin27, Z. H. Qin1, J. F. Qiu1, K. H. Rashid42,
C. P. Shen37,e, X. Y. Shen1, H. Y. Sheng1, M. R. Shepherd17, X. Y. Song1, S. Spataro43A,43C, B. Spruck36, D. H. Sun1, G. X. Sun1, J. F. Sun12, S. S. Sun1, Y. J. Sun40, Y. Z. Sun1,
Z. J. Sun1, Z. T. Sun40, C. J. Tang31, X. Tang1, I. Tapan35C, E. H. Thorndike39, D. Toth38, M. Ullrich36, G. S. Varner37, B. Wang9, B. Q. Wang27, D. Wang27, D. Y. Wang27, K. Wang1,
L. L. Wang1, L. S. Wang1, M. Wang29, P. Wang1, P. L. Wang1, Q. Wang1, Q. J. Wang1, S. G. Wang27, X. L. Wang40, Y. D. Wang40, Y. F. Wang1, Y. Q. Wang29, Z. Wang1,
Z. G. Wang1, Z. Y. Wang1, D. H. Wei8, J. B. Wei27, P. Weidenkaff19, Q. G. Wen40, S. P. Wen1, M. Werner36, U. Wiedner2, L. H. Wu1, N. Wu1, S. X. Wu40, W. Wu26, Z. Wu1, L. G. Xia34,
Z. J. Xiao24, Y. G. Xie1, Q. L. Xiu1, G. F. Xu1, G. M. Xu27, H. Xu1, Q. J. Xu10, X. P. Xu32, Z. R. Xu40, F. Xue15, Z. Xue1, L. Yan40, W. B. Yan40, Y. H. Yan16, H. X. Yang1, Y. Yang15,
Y. X. Yang8, H. Ye1, M. Ye1, M. H. Ye4, B. X. Yu1, C. X. Yu26, H. W. Yu27, J. S. Yu22, S. P. Yu29, C. Z. Yuan1, Y. Yuan1, A. A. Zafar42, A. Zallo18A, Y. Zeng16, B. X. Zhang1,
B. Y. Zhang1, C. Zhang25, C. C. Zhang1, D. H. Zhang1, H. H. Zhang33, H. Y. Zhang1, J. Q. Zhang1, J. W. Zhang1, J. Y. Zhang1, J. Z. Zhang1, S. H. Zhang1, X. J. Zhang1, X. Y. Zhang29, Y. Zhang1, Y. H. Zhang1, Y. S. Zhang9, Z. P. Zhang40, Z. Y. Zhang44, G. Zhao1,
H. S. Zhao1, J. W. Zhao1, K. X. Zhao24, Lei Zhao40, Ling Zhao1, M. G. Zhao26, Q. Zhao1,
Q. Z. Zhao9,f, S. J. Zhao46, T. C. Zhao1, X. H. Zhao25, Y. B. Zhao1, Z. G. Zhao40, A. Zhemchugov20,a, B. Zheng41, J. P. Zheng1, Y. H. Zheng6, B. Zhong1, J. Zhong2, Z. Zhong9,f,
L. Zhou1, X. K. Zhou6, X. R. Zhou40, C. Zhu1, K. Zhu1, K. J. Zhu1, S. H. Zhu1, X. L. Zhu34, Y. C. Zhu40, Y. M. Zhu26, Y. S. Zhu1, Z. A. Zhu1, J. Zhuang1, B. S. Zou1, J. H. Zou1
(BESIII Collaboration)
1 Institute of High Energy Physics, Beijing 100049, P. R. China 2 Bochum Ruhr-University, 44780 Bochum, Germany 3 Carnegie Mellon University, Pittsburgh, PA 15213, USA
4 China Center of Advanced Science and Technology, Beijing 100190, P. R. China 5 G.I. Budker Institute of Nuclear Physics SB RAS (BINP), Novosibirsk 630090, Russia
6 Graduate University of Chinese Academy of Sciences, Beijing 100049, P. R. China 7 GSI Helmholtzcentre for Heavy Ion Research GmbH, D-64291 Darmstadt, Germany
8 Guangxi Normal University, Guilin 541004, P. R. China 9 GuangXi University, Nanning 530004,P.R.China
10 Hangzhou Normal University, Hangzhou 310036, P. R. China 11 Helmholtz Institute Mainz, J.J. Becherweg 45,D 55099 Mainz,Germany
12 Henan Normal University, Xinxiang 453007, P. R. China
13 Henan University of Science and Technology, Luoyang 471003, P. R. China 14 Huangshan College, Huangshan 245000, P. R. China
15 Huazhong Normal University, Wuhan 430079, P. R. China 16 Hunan University, Changsha 410082, P. R. China 17 Indiana University, Bloomington, Indiana 47405, USA 18 (A)INFN Laboratori Nazionali di Frascati, Frascati, Italy;
(B)INFN and University of Perugia, I-06100, Perugia, Italy
19 Johannes Gutenberg University of Mainz,
Johann-Joachim-Becher-Weg 45, 55099 Mainz, Germany
20 Joint Institute for Nuclear Research, 141980 Dubna, Russia 21 KVI/University of Groningen, 9747 AA Groningen, The Netherlands
22 Lanzhou University, Lanzhou 730000, P. R. China 23 Liaoning University, Shenyang 110036, P. R. China 24 Nanjing Normal University, Nanjing 210046, P. R. China
25 Nanjing University, Nanjing 210093, P. R. China 26 Nankai University, Tianjin 300071, P. R. China
27 Peking University, Beijing 100871, P. R. China 28 Seoul National University, Seoul, 151-747 Korea 29 Shandong University, Jinan 250100, P. R. China
30 Shanxi University, Taiyuan 030006, P. R. China 31 Sichuan University, Chengdu 610064, P. R. China
32 Soochow University, Suzhou 215006, China
33 Sun Yat-Sen University, Guangzhou 510275, P. R. China 34 Tsinghua University, Beijing 100084, P. R. China 35 (A)Ankara University, Ankara, Turkey; (B)Dogus University,
Istanbul, Turkey; (C)Uludag University, Bursa, Turkey
36 Universitaet Giessen, 35392 Giessen, Germany 37 University of Hawaii, Honolulu, Hawaii 96822, USA
38 University of Minnesota, Minneapolis, MN 55455, USA 39 University of Rochester, Rochester, New York 14627, USA
40 University of Science and Technology of China, Hefei 230026, P. R. China 41 University of South China, Hengyang 421001, P. R. China
42 University of the Punjab, Lahore-54590, Pakistan 43 (A)University of Turin, Turin, Italy; (B)University of
Eastern Piedmont, Alessandria, Italy; (C)INFN, Turin, Italy
44 Wuhan University, Wuhan 430072, P. R. China 45 Zhejiang University, Hangzhou 310027, P. R. China 46 Zhengzhou University, Zhengzhou 450001, P. R. China
a also at the Moscow Institute of Physics and Technology, Moscow, Russia b on leave from the Bogolyubov Institute for Theoretical Physics, Kiev, Ukraine
c Nankai University, Tianjin,300071,China d also at the PNPI, Gatchina, Russia e now at Nagoya University, Nagoya, Japan
f Guangxi University,Nanning,530004,China
Abstract
The process ψ(3686) → π0hc, hc → γηc has been studied with a data sample of 106 ± 4 million
ψ(3686) events collected with the BESIII detector at the BEPCII storage ring. The mass and width of the P -wave charmonium spin-singlet state hc(1P1) are determined by simultaneously
fitting distributions of the π0 recoil mass for 16 exclusive η
c decay modes. The results, M (hc) =
3525.31 ±0.11 (stat.) ±0.14 (syst.) MeV/c2 and Γ(hc) = 0.70 ±0.28±0.22 MeV, are consistent with
and more precise than previous measurements. We also determine the branching ratios for the 16 exclusive ηc decay modes, five of which have not been measured previously. New measurements
of the ηc line-shape parameters in the E1 transition hc → γηc are made by selecting candidates
in the hc signal sample and simultaneously fitting the hadronic mass spectra for the 16 ηc decay
channels. The resulting ηc mass and width values are M (ηc) = 2984.49 ± 1.16 ± 0.52 MeV/c2 and
Γ(ηc) = 36.4 ± 3.2 ± 1.7 MeV.
I. INTRODUCTION
Studies of charmonium states have played an important role in understanding Quantum Chromodynamics (QCD) because of their relative immunity from complications like rela-tivistic effects and the large value of the strong coupling constant αs. In the QCD potential model [1], the spin-independent one-gluon exchange part of the c¯c interaction has been de-fined quite well by existing experimental data. The spin dependence of the c¯c potential is not as well understood. Until recently, the only well-measured hyperfine splitting was that for the 1S states of charmonium, ∆Mhf(1S) = M(J/ψ) − M(ηc) = 116 ± 1 MeV/c2 [2]. In the past several years Belle [3], CLEO [4], BaBar [5], and BESIII [6] have succeeded in iden-tifying ηc(2S) and have measured ∆Mhf(2S) = M(ψ(3686)) − M(ηc(2S)) = 47 ± 1 MeV/c2.
Of the charmonium states below D ¯D threshold, the hc(11P
1) is experimentally the least accessible because it cannot be produced directly in e+e− annihilation or in the electric-dipole transition of a JP C = 1−−charmonium state. Limited statistics and photon-detection challenges also were major obstacles to the observation of hc in charmonium transitions. The precise measurement of hc properties is important because a comparison of its mass with the masses of the 3P states (χcJ) provides much-needed information about the spin dependence of the c¯c interaction. According to QCD potential models, the c¯c interaction in a charmonium meson can be described with a potential that includes a Lorentz scalar confinement term and a vector Coulombic term arising from one-gluon exchange between the quark and the antiquark. The scalar confining potential makes no contribution to the hyperfine interaction and the Coulombic vector potential produces hyperfine splitting only for S states. This leads to the prediction of the hyperfine or triplet-singlet splitting in the P states of Mhf ≡ hM(13P )i − M(11P1) ≃ 0, where hM(13P )i is the spin-weighted centroid mass of the triplet 3PJ states [7–9].
The first evidence of the hc state was reported by the Fermilab E760 experiment [10] and was based on the process p¯p → π0J/ψ. This result was subsequently excluded by the successor experiment E835 [8], which investigated the same reaction with a larger data sample. E835 also studied p¯p → hc → γηc, in this case finding an hc signal. Soon after this the CLEO collaboration observed the hc and measured its mass [9, 11] by studying the decay chain ψ(3686) → π0hc, hc → γη
c in e+e− collisions. CLEO subsequently presented evidence for hc decays to multi-pion final states [12]. Recently, the BESIII collaboration
used inclusive methods to make the first measurements of the absolute branching ratios B(ψ(3686) → π0hc) = (8.4 ± 1.3 ± 1.0) × 10−4 and B(h
c → γηc) = (54.3 ± 6.7 ± 5.2)% [13]. CLEO has confirmed the BESIII results [14] and also observed hc in e+e− → π+π−hc at √
s = 4170 MeV, demonstrating a new prolific source of hc [15].
ηc(1S) is the lowest-lying S-wave spin-singlet charmonium state. Although it has been known for about thirty years [16], its resonant parameters are still interesting. For a long time, measurements of the ηc width from B-factories and from charmonium transitions were inconsistent [2]. The discrepancies can be attributed to poor statistics and inadequate consideration of interference between ηc decays and non-resonant backgrounds. Besides, the ηc line shape also could be distorted by photon energy dependence in the M1 (or E1) transition, which will affect the resonant-parameter measurements. Recent studies by Belle, Babar, CLEO, and BESIII [17–20], with large data samples and careful consideration of interference, obtained similar ηc width and mass results in two-photon-fusion production and ψ(3686) decays. The hc → γηc transition can provide a new laboratory to study ηc properties. The ηc line shape in the E1 transition hc → γηc should not be as distorted as in other charmonium decays, because non-resonant interfering backgrounds to the dominant transition are small.
In this paper, we report new measurements of the mass and width of the hc and ηc, and of the branching ratios B1(ψ(3686) → π0hc) × B2(hc → γη
c) × B3(ηc → Xi) and B3(ηc → Xi), via the sequential process ψ(3686) → π0hc, hc → γηc, ηc → Xi. In this reaction Xi signifies 16 exclusive hadronic final states: p¯p, 2(π+π−), 2(K+K−), K+K−π+π−, p¯pπ+π−, 3(π+π−), K+K−2(π+π−), K+K−π0, p¯pπ0, K0
SK±π∓, KS0K±π∓π±π∓, π+π−η, K+K−η, 2(π+π−)η, π+π−π0π0, and 2(π+π−)π0π0. Here K0
S is reconstructed in its π+π− decays, and η in its γγ final state. The data sample of ψ(3686) events was collected with the BESIII detector at the BEPCII e+e− storage ring.
The remainder of this paper is structured as follows: Sect. II describes the experiment and data sample; Sect. III presents the event selection and background analysis; Sect. IV discusses the extraction of hc and ηc results; Sect. V describes the estimation of systematic uncertainties; and Sec. VI provides a summary and discussion of the results.
II. EXPERIMENT AND DATA SAMPLE
BEPCII is a two-ring e+e− collider designed for a peak luminosity of 1033cm−2s−1 at a beam current of 0.93 A per beam. The cylindrical core of the BESIII detector consists of a helium-gas-based drift chamber (MDC) for charged-particle tracking and particle identi-fication by dE/dx, a plastic scintillator time-of-flight system (TOF) for additional particle identification, and a 6240-crystal CsI(Tl) Electromagnetic Calorimeter (EMC) for electron identification and photon detection. These components are all enclosed in a superconduct-ing solenoidal magnet providsuperconduct-ing a 1.0-T magnetic field. The solenoid is supported by an octagonal flux-return yoke with resistive-plate-counter muon detector modules (MUC) in-terleaved with steel. The geometrical acceptance for charged tracks and photons is 93% of 4π, and the resolutions for charged-track momentum and photon energy at 1 GeV are 0.5% and 2.5%, respectively. More details on the features and capabilities of BESIII are provided in Ref. [21].
The data sample for this analysis consists of 156.4 pb−1of e+e−annihilation data collected at a center-of-mass energy of 3.686 GeV, the peak of the ψ(3686) resonance. By measuring the production of multihadronic events we determine the number of ψ(3686) decays in the sample to be (1.06 ±0.04)×108, where the uncertainty is dominated by systematics [22]. An additional 42 pb−1 of data were collected at a center-of-mass energy of 3.65 GeV to determine non-resonant continuum background contributions.
The optimization of the event selection and the estimation of physics backgrounds are performed with simulated Monte Carlo (MC) samples. A GEANT4-based [23, 24] detector sim-ulation package is used to model the detector response. Signal and background processes are generated with specialized models that have been packaged and customized for BESIII [25]. The ψ(3686) resonance is generated by KKMC [26], and EvtGen [27] is used to model events for ψ(3686) → π0hc and for exclusive backgrounds in ψ(3686) decays. An inclusive sample (100 million events) is used to simulate hadronic background processes. Known ψ(3686) decay modes are generated with EvtGen, using branching ratios set to world-average val-ues [2]. The remaining ψ(3686) decay modes are generated by LUNDCHARM [25], which is based on JETSET [28] and tuned for the charm-energy region. The decays ψ(3686) → π0hc are excluded from this sample.
width equal to that of the χc1 (0.9 MeV). The E1 transition hc → γηc is generated with an angular distribution in the hc rest frame of 1 + cos2θ∗, where θ∗ is the angle of the E1 photon with respect to the beam direction in the hc rest frame. Multi-body ηc decays are generated according to phase space.
III. EVENT SELECTION AND BACKGROUND ANALYSIS
For ψ(3686) → π0hc, hc → γη
c, the expected π0 momentum is Pπ0 ≃ 84 MeV/c, and the
E1 transition photon emitted in hc → γηc has an expected energy of E(γE1) ≃ 503 MeV in the hc rest frame. Therefore, the signal candidates should have one E1 photon candidate with energy in the expected region 450 MeV < E(γE1) < 550 MeV and one π0 candidate with recoil mass in the region (3480, 3570) MeV/c2. For the selected candidates, we fit the distribution of π0 recoil mass for the full event sample to give the results for the hc resonant parameters and signal yields.
Charged tracks in BESIII are reconstructed from MDC hits within a polar-angle (θ) acceptance range of | cos θ| < 0.93. To optimize the momentum measurement, we require that these tracks be reconstructed to pass within 10 cm of the interaction point in the beam direction and within 1 cm in the plane perpendicular to the beam. Tracks used in reconstructing K0
S decays are exempted from these requirements.
A vertex fit constrains charged tracks to a common production vertex, which is updated on a run-by-run basis. For each charged track, time-of-flight and dE/dx information is combined to compute particle identification (PID) confidence levels for the pion, kaon, and proton hypotheses. The track is assigned to the particle type with the highest confidence level.
Electromagnetic showers are reconstructed by clustering EMC crystal energies. Efficiency and energy resolution are improved by including energy deposits in nearby TOF counters. A photon candidate is defined as a shower with an energy deposit of at least 25 MeV in the “barrel” region (| cos θ| < 0.8), or of at least 50 MeV in the “end-cap” region (0.86 < | cos θ| < 0.92). Showers at angles intermediate between the barrel and the end-cap are not well measured and are rejected. An additional requirement on the EMC hit timing suppresses electronic noise and energy deposits unrelated to the event.
range |Mγγ − mπ0| < 15 MeV/c2 (|Mγγ − mη| < 15 MeV/c2) [2]. A one-constraint (1-C)
kinematic fit is performed to improve the energy resolution, with the M(γγ) constrained to the known π0(η) mass.
We reconstruct K0
S → π+π− candidates using pairs of oppositely charged tracks with an invariant mass in the range |Mππ−mK0
S| < 20 MeV/c 2, where m K0 S is the known K 0 Smass [2]. To reject random π+π− combinations, a secondary-vertex fitting algorithm is employed to impose the kinematic constraint between the production and decay vertices [29]. Accepted K0
S candidates are required to have a decay length of at least twice the vertex resolution. The ηccandidate is reconstructed in 16 exclusive decay modes, and the event is accepted or rejected based on consistency with the hc → γηc hypothesis. Specifically, the reconstructed mass M(ηc) is required to be between 2.900 GeV/c2 and 3.050 GeV/c2, and the transition-photon energy is required to be between 0.450 GeV and 0.550 GeV. Events passing this selection are subjected to a 4 constraint (4-C) kinematic fit to take advantage of energy-momentum conservation between the initial state (e+e− beams) and the final state (ηc + E1 photon + π0). Because of differing signal/background characteristics, we individually optimize requirements on χ2
4C, the χ2 of the 4-C fit, for the 16 ηc channels. If multiple ηc candidates are found in an event, the one with the smallest value of χ2 = χ2
4C + χ21C + χ2
pid+ χ2vertex is accepted, where χ21C is the χ2 of the 1-C fit of the π0(η), χ2pid is the PID χ2 summation for all charged tracks included in the hc candidate, and χ2
vertex is the χ2 of the K0
S vertex fit. If there is no π0/η (KS0) in an event, the corresponding χ21C (χ2vertex) is set to zero.
Based on studies of the inclusive MC sample, we identified several background processes with potential to reduce the precision of measurements made with specific ηc exclusive chan-nels because of sizable low-energy π0 production. The processes and suppression procedures are as follows:
• ψ(3686) → π+π−J/ψ
The mass MX of the system recoiling against the π+π− in ψ(3686) → π+π−X is calculated and the candidate is rejected if MX is within ±12 MeV/c2 of the known J/ψ mass.
The mass MX of the system recoiling against the π0π0 in ψ(3686) → π0π0X is cal-culated and the candidate is rejected if MX is within ±15 MeV/c2 of the known J/ψ mass for all ηc final states except π+π−π+π−π0π0. For this mode the lower π0 mo-mentum leads to recoil masses near 3.1 GeV/c2, so the exclusion window is narrowed to ±10 MeV/c2.
• ψ(3686) → γχc2
A candidate is rejected if it includes a π0 for which either daughter photon has an energy within ±5 MeV of that expected for the ψ(3686) radiative transition to χc2 (128 MeV).
• E1 photon candidates that are π0 decay products
A candidate is rejected if its E1 photon can be combined with another photon in the event to form a π0 within a mass window of ±10 MeV/c2.
• π0 candidates that are from η → π+π−π0
Masses M(π+π−π0) are calculated for all possible combinations in the event and the candidate is rejected if any combination has a mass within ±15 MeV/c2 of the known η mass.
Decisions about whether to apply a requirement to a particular ηc mode and the opti-mization of the χ2
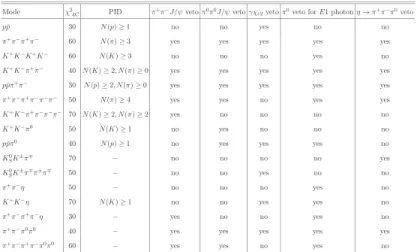
4C and PID requirements were made on a channel-by-channel basis. The figure-of-merit used was S = NS/√NS+ NB, where NS is the number of signal and NB the number of background candidates. PDG values [2] are used for the input ηc branching ratios, and for channels not tabulated by the PDG we estimate branching ratios based on conjugate channels or other similar modes. The optimized selection criteria are listed in Table I, in which the N(p), N(π) and N(K) denote the numbers of identified protons, pions and kaons in an event.
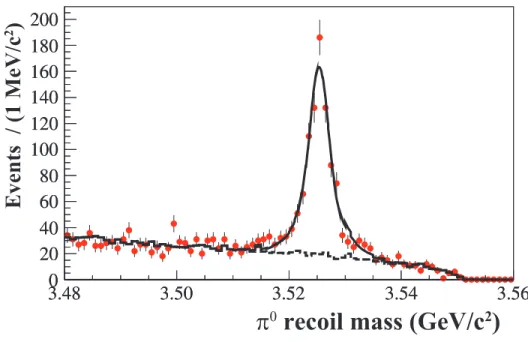
The π0 recoil mass spectra for events passing these requirements show clear hc signals in the expected range, as can be seen in Fig. 1. No peaking backgrounds in the signal region are found in the 100-million-event inclusive MC sample, in the continuum data sample taken at√s = 3.65 GeV, or in ηc-candidate-mass side-band distributions.
TABLE I: Event-selection requirements for each exclusive channel.
Mode χ2
4C PID π+π−J/ψ veto π0π0J/ψ veto γχc2veto π0veto for E1 photon η → π+π−π0veto
p¯p 30 N (p) ≥ 1 no no yes no no π+π−π+π− 60 N (π) ≥ 3 yes yes yes yes yes K+K−K+K− 60 N (K) ≥ 3 no no no yes no
K+K−π+π− 40 N (K) ≥ 2, N(π) ≥ 0 yes yes yes yes yes
p¯pπ+π− 30 N (p) ≥ 2, N(π) ≥ 0 yes yes yes yes yes
π+π−π+π−π−π− 50 N (π) ≥ 4 yes yes no yes yes
K+K−π+π−π−π− 70 N (K) ≥ 2, N(π) ≥ 2 yes no no no no
K+K−π0 50 N (K) ≥ 1 no yes no no no
p¯pπ0 40 N (p) ≥ 1 no yes yes yes no
K0 SK±π∓ 70 − no no no no yes K0 SK±π∓π±π∓ 50 − no no yes no no π+π−η 50 − no no no yes no K+K−η 70 N (K) ≥ 1 no no yes yes no π+π−π+π−η 30 − yes no no yes no
π+π−π0π0 40 − yes yes yes yes yes
π+π−π+π−π0π0 60 − yes yes no yes no
IV. EXTRACTION OF YIELDS AND RESONANCE PARAMETERS
We obtain the hc mass, width and branching ratios from simultaneous fits to the π0 recoil mass distributions for the 16 exclusive ηc decay modes. Here only 1-C kinematic fits with π0 mass hypothesis are used to improve the energy resolution. The 4C-fits used in event selection are not used in the π0 recoil mass reconstruction, because the energy resolution of the signal π0 in 4C-fits is not as good as in the 1C-fits, according to a MC study. From the same data sample we also determine the ηc resonant parameters by fitting the 16 invariant-mass spectra of the hadronic system accompanying the transition photon in hc → γηc.
A. Fitting the hc signal
To extract the hc resonant parameters and the yield for each ηc decay channel, the 16 π0 recoil mass distributions are fitted simultaneously with a binned maximum likelihood method. A Breit-Wigner function convolved with the instrumental resolution is used to describe the signal shape. An efficiency correction is not needed because of the small hc width and the good π0 mass resolution. The resolution function is channel-dependent and is obtained from MC simulation. The parameters M(hc) and Γ(hc) of the Breit-Wigner function are constrained to be the same for all 16 channels, which is essential for the decay modes with low statistics. For the recoil mass fit to each channel, the background shape is obtained from the ηc mass side bands (2300−2700, 3070−3200 MeV/c2), and the signal
3.480 3.50 3.52 3.54 3.56 20 40 60 80 100 120 140 160 180 200 3.480 3.50 3.52 3.54 3.56 20 40 60 80 100 120 140 160 180 200
π
0recoil mass (GeV/c
2)
Eve
n
ts
/
(1 M
e
V
/c
2)
FIG. 1: The π0 recoil mass spectrum in ψ(3686) → π0h
c, hc → γηc, ηc → Xi summed over the 16
final states Xi. The dots with error bars represent the π0 recoil mass spectrum in data. The solid
line shows the total fit function and the dashed line is the background component of the fit.
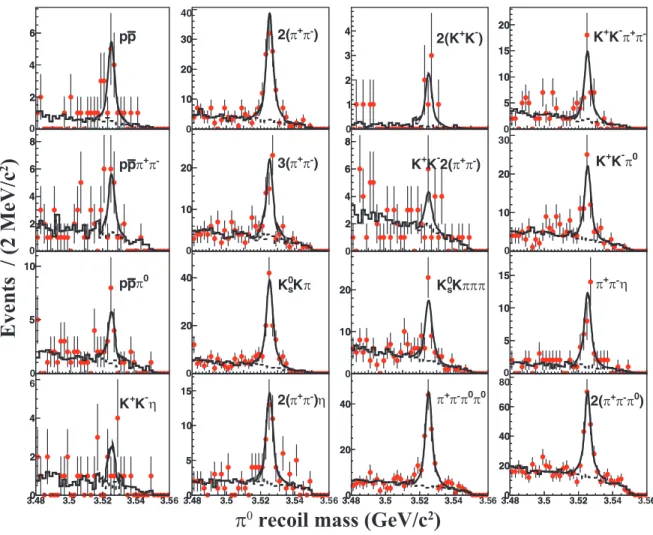
and the background normalizations for each mode are allowed to float. The summed and mode-by-mode fit results are shown in Figs. 1 and 2, respectively. The χ2 per degree of freedom for this fit is 1.60, where sparsely populated bins are combined so that there are at least seven counts per bin in the χ2 calculation. The parameters of the hc resonance are determined to be M(hc) = 3525.31 ± 0.11 MeV/c2 and Γ(hc) = 0.70 ± 0.28 MeV, where the errors are statistical only.
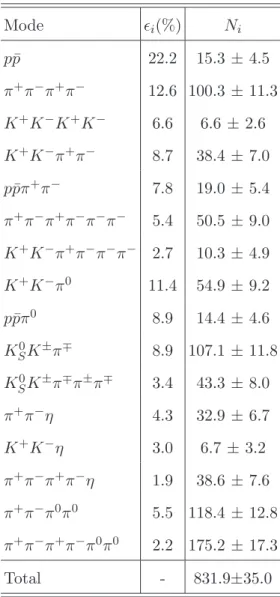
The MC-determined selection efficiency ǫi and yield Ni for each ηc decay mode are listed in Table II. Based on these numbers, we can calculate the product branching ra-tios B1(ψ(3686) → π0hc) × B2(hc → γηc) × B3(ηc → Xi). The branching ratio for ηc → Xi for each of the 16 final states Xi can then be obtained by combining our measurements with B1(ψ(3686) → π0hc) × B2(hc → γη
c) = (4.36 ± 0.42) × 10−4, the average of two recent measurements by CLEO [9] and BESIII [13]. These branching ratios, with both statistical and systematic errors, are presented in Section VI.
2 4 6 2 4 6 pp 2 4 6 8 2 4 6 8 -π + π p p 5 10 5 10 0 π p p 3.480 3.5 3.52 3.54 3.5 2 4 6 3.480 3.5 3.52 3.54 3.5 2 4 η -K + K 10 20 30 40 10 20 30 2(π+π-) 10 20 10 20 3(π+π-) 20 40 20 40 π K s 0 K 3.480 3.5 3.52 3.54 3.5 5 10 15 3.480 3.5 3.52 3.5 5 10 15 η ) -π + π 2( 1 2 3 4 1 2 3 4 ) -K + 2(K 2 4 6 8 2 4 6 8 ) -π + π 2( -K + K 10 20 10 20 sKπππ 0 K 3.480 3.5 3.52 3.54 3.5 20 40 3.480 3.5 3.52 3.5 20 40 0 π 0 π -π + π 5 10 15 20 5 10 15 20 -π + π -K + K 10 20 30 10 20 0 π -K + K 5 10 15 5 10 15 η -π + π 3.480 3.5 3.52 3.54 3.56 20 40 60 80 3.480 3.5 3.52 3.5 20 40 60 ) 0 π -π + π 2(
π
0recoil mass (GeV/c
2)
Eve
n
ts
/
(2 M
e
V
/c
2)
0 6 6 6 6 0 0 0 0 0 0 0 0 0 0 0FIG. 2: The simultaneously fitted π0 recoil mass spectra in ψ(3686) → π0hc, hc → γηc, ηc → Xi
for the 16 final states Xi.
B. Measurement of ηc resonant parameters
In addition to determining the hc resonant parameters, we can also measure the ηc mass and width with the same event sample. The decay chain hc → γηc, ηc → Xi is reconstructed and kinematically fitted in the 16 ηc final states Xi. For candidates with satisfactory kine-matic fits, we use the resulting track and photon momenta to compute the hadronic mass. We populate distributions of this hadronic mass by removing our previous E1 photon-energy and M(ηc) requirements and selecting candidates inside a π0 recoil mass window of ±5 MeV/c2 around the hc mass, keeping all other criteria unchanged.
The line shape for the ηcsignal for these fits is parameterized as (E3
γ×BW (m)×fd(Eγ))⊗ Ri(m), where BW (m) is the Breit-Wigner function for ηc as a function of the invariant mass
TABLE II: MC-determined efficiencies ǫi and yields Ni for ψ(3686) → π0hc, hc → γηc, ηc → Xi,
where Xi refers to the 16 final states .
Mode ǫi(%) Ni p¯p 22.2 15.3 ± 4.5 π+π−π+π− 12.6 100.3 ± 11.3 K+K−K+K− 6.6 6.6 ± 2.6 K+K−π+π− 8.7 38.4 ± 7.0 p¯pπ+π− 7.8 19.0 ± 5.4 π+π−π+π−π−π− 5.4 50.5 ± 9.0 K+K−π+π−π−π− 2.7 10.3 ± 4.9 K+K−π0 11.4 54.9 ± 9.2 p¯pπ0 8.9 14.4 ± 4.6 KS0K±π∓ 8.9 107.1 ± 11.8 K0 SK±π∓π±π∓ 3.4 43.3 ± 8.0 π+π−η 4.3 32.9 ± 6.7 K+K−η 3.0 6.7 ± 3.2 π+π−π+π−η 1.9 38.6 ± 7.6 π+π−π0π0 5.5 118.4 ± 12.8 π+π−π+π−π0π0 2.2 175.2 ± 17.3 Total - 831.9±35.0
m of the decay products for each channel, Eγ(m) = M(hc)2−m2
2M (hc) is the energy of the transition
photon in the rest frame of hc, and fd(Eγ) is a function that damps the divergent tail due to the E3
γ factor, which incorporates the energy dependence of the E1 matrix element and the phase-space factor. Ri(m) is the signal resolution function for the ith decay mode, which is parameterized by double Gaussians to account for the distorting effects of the kinematic fit and detector smearing. The damping function that we use was introduced by the KEDR collaboration [30]: fd(Eγ) = E 2 0 EγE0+ (Eγ− E0)2 ,
where E0 = Eγ(mηc) is the E1-transition-photon peak energy. The ηc-candidate hadronic
invariant mass spectra from low and high side bands in the hc mass (3500−3515, 3535−3550 MeV/c2) are used to obtain the background functions for the ηc mass fit. To mitigate the effects of bin-to-bin fluctuations, these side-band mass spectra are smoothed before fitting. A toy MC study was performed to test the effect of the smoothing and it was demonstrated to be a robust procedure that does not systematically distort the fit re-sults. The channel-by-channel signal and background normalizations are free parameters determined by the fit.
We ignore the effect of interference between the signal and background, which was con-sidered in the previous measurement of ψ(3686) → γηc [20], because the branching ratio of hc → γηc is about 50% (branching ratio of M1 transition ψ(3686) → γηc is about 0.3%). The radiative decay of hc → γ0−
should be the same level of ψ(3686) → γ0−, in this case, the non-ηc intensity in hc is much smaller than that for ψ(3686) → γηc.
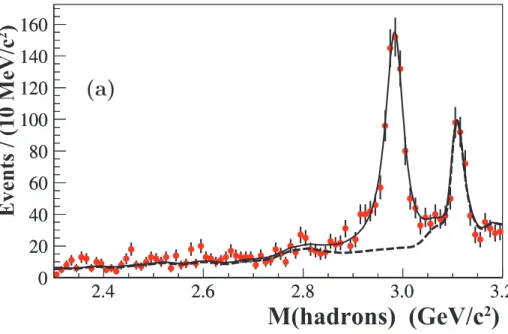
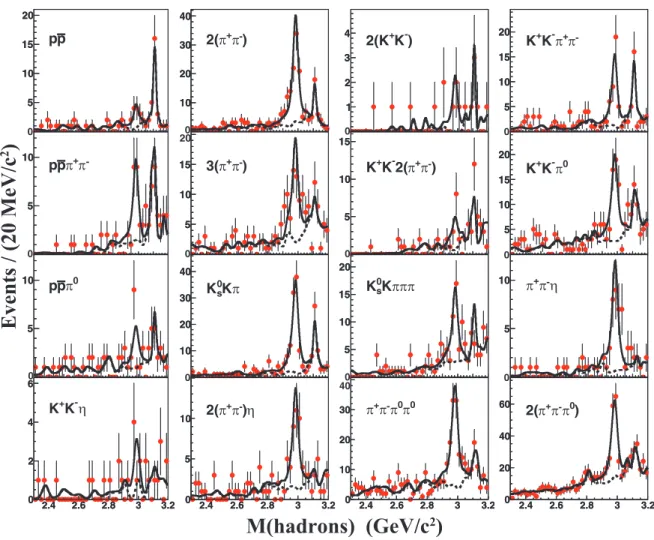
Figs. 3 and 4 show the hadronic-mass-fit results. The ηc mass and width are determined to be M(ηc) = 2984.49 ± 1.16 MeV/c2 and Γ(ηc) = 36.4 ± 3.2 MeV, where the errors are statistical. The χ2 per degree of freedom for this fit is 1.52, using the same χ2 calculation method to accommodate low-statistics bins as for the fit to the π0 recoil mass spectrum.
V. SYSTEMATIC UNCERTAINTIES
A. hc parameter measurements
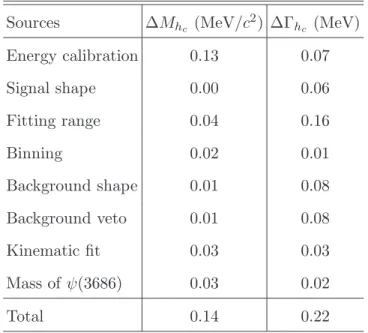
The systematic uncertainties for the M(hc) and Γ(hc) measurements are summarized in Table III. All sources are treated as uncorrelated, so the total systematic uncertainty is obtained by summing them in quadrature. The following subsections describe the procedures and assumptions that led to these estimates of the uncertainties.
1. Energy calibration
The potential inconsistency of the photon-energy measurement between data and MC is evaluated by studying ψ(3686) → γχc1,2( χc1,2→ γJ/ψ, J/ψ → µ+µ−) for photons with low energy and radiative Bhabha events for photons with high energy. Discrepancies of 0.4%
2.4 2.6 2.8 3.0 3.2 0 20 40 60 80 100 120 140 160 2.4 2.6 2.8 3.0 3.2 0 20 40 60 80 100 120 140 160
Eve
n
ts
/
(10 M
e
V
/c
2)
M(hadrons) (GeV/c
2)
(a)
2.4 2.6 2.8 3.0 3.2 -20 0 20 40 60 80 100 120 140 160 2.4 2.6 2.8 3.0 3.2 -20 0 20 40 60 80 100 120 140 160M(hadrons) (GeV/c
2)
Eve
n
ts
/
(10 M
e
V
/c
2)
(b)
FIG. 3: (a) The hadronic mass spectrum in ψ(3686) → π0hc, hc → γηc, ηc → Xi summed over the
16 final states Xi. The dots with error bars represent the hadronic mass spectrum in data. The
solid line shows the total fit function and the dashed line is the background component of the fit. (b) The background-subtracted hadronic mass spectrum with the signal shape overlaid.
5 10 15 20 5 10 15 20 p p 5 10 5 10 -π + π p p 5 10 5 10 0 π p p 2.4 2.6 2.8 3 3.2 0 2 4 6 2.4 2.6 2.8 3 3.2 0 2 4 6 η -K + K 10 20 30 40 10 20 30 40 ) -π + π 2( 5 10 15 20 5 10 15 3(π+π-) 10 20 30 40 10 20 30 40 π K s 0 K 2.4 2.6 2.8 3 3.2 0 5 10 2.4 2.6 2.8 3 3.2 0 5 10 )η -π + π 2( 1 2 3 4 1 2 3 4 ) -K + 2(K 5 10 15 5 10 15 ) -π + π 2( -K + K 5 10 15 20 5 10 15 20 π π π K s 0 K 2.4 2.6 2.8 3 3.2 0 10 20 30 40 2.4 2.6 2.8 3 3.2 0 10 20 30 π+π-π0π0 5 10 15 20 5 10 15 20 -π + π -K + K 5 10 15 20 5 10 15 20 0 π -K + K 5 10 5 10 +π-η π 2.4 2.6 2.8 3 3.2 0 20 40 60 2.4 2.6 2.8 3 3.2 0 20 40 60 ) 0 π -π + π 2(
Eve
n
ts
/
(20 M
e
V
/c
2)
M(hadrons) (GeV/c
2)
0 0 0 0 0 0 0 0 0 0 0 0FIG. 4: The simultaneously fitted hadronic mass spectra for the 16 ηc decay channels.
in the energy scale and 4% in the energy resolution between data and MC are found. We vary the photon response accordingly and take the changes in the results as the estimated systematic error. For the M(hc) measurement, besides the above studies, the reconstructed photon position and error matrix are taken into account as additional sources of uncertainty.
2. Signal shape
The uncertainty associated with the hc signal shape in the π0 recoil mass spectrum includes contributions from the photon line shape and the 1-C kinematic fit. We estimate these by determining the changes in results after reasonable adjustments in the photon response. The photon-energy resolution is estimated with the control sample ψ(3686) →
TABLE III: The systematic errors for the hc mass and width measurements. Sources ∆Mhc (MeV/c 2) ∆Γ hc (MeV) Energy calibration 0.13 0.07 Signal shape 0.00 0.06 Fitting range 0.04 0.16 Binning 0.02 0.01 Background shape 0.01 0.08 Background veto 0.01 0.08 Kinematic fit 0.03 0.03 Mass of ψ(3686) 0.03 0.02 Total 0.14 0.22
γχc2. As above, the energy resolution in data is found to be about 4% worse than in the MC simulation. We correct for this discrepancy by adding single-Gaussian smearing to the energy of the π0 daughter photons and then using the alternative π0 shape to redo the fit. The changes in results are assigned as the systematic errors.
3. Fitting range and binning
The systematic uncertainties due to the fitting of the π0 recoil mass spectrum are evalu-ated by varying the fitting range and the bin size in the fit. The spreads of results obtained with the alternative assumptions are used to assign the systematic errors.
4. Background shape
To estimate the uncertainty associated with the side-band method for assigning back-ground function shapes, we use an ARGUS function [31] as an alternative backback-ground de-scription for each channel and record the changes in the fit results.
5. Background veto
The systematic uncertainties associated with the requirements to suppress background are estimated by varying the excluded ranges.
6. Kinematic fit
Systematic uncertainties caused by the kinematic fit are studied by tuning the tracking parameters and error matrices of charged tracks and photons based on the data. Control samples of J/ψ → φf0(980), φ → K+K−, f0(980) → π+π−, and ψ(3686) → γχcJ are used for this purpose [32]. Channel-by-channel changes of M(ηc) and Γ(ηc) are calculated after the tuning and then averaged by yields and taken as systematic errors.
7. ψ(3686) mass
The systematic uncertainties of the M(hc) and Γ(hc) determinations associated with the uncertainty in the ψ(3686) mass are estimated to be 0.03 MeV/c2and 0.02 MeV, respectively. These are found by shifting Mψ(3686) by one standard deviation according to the PDG value [2] and redetermining the results.
B. ηc branching ratio measurements
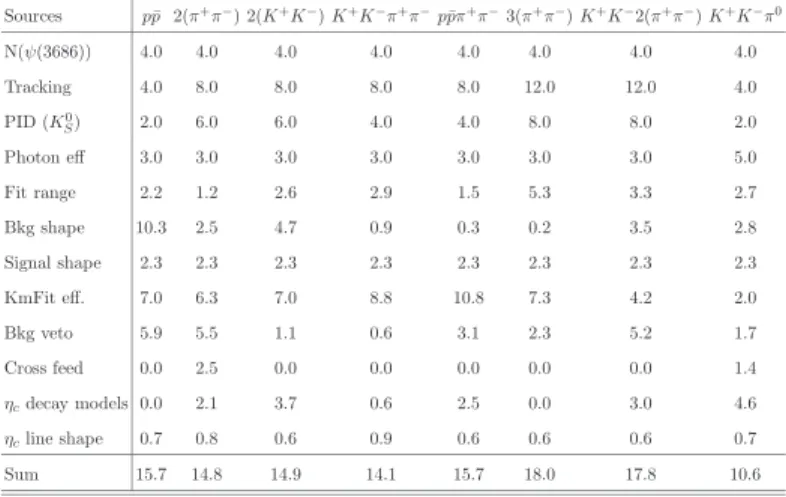
The systematic errors in the ηc branching ratio measurements are listed in Tables IV. All sources are treated as uncorrelated, so the total systematic uncertainty is obtained by summing them in quadrature. The following subsections describe the procedures and assumptions that led to the estimates of these uncertainties.
1. Tracking and photon detection
The uncertainty in the tracking efficiency is 2% per track and the uncertainty due to photon detection is 1% per photon [33]. MC studies demonstrate that the trigger efficiency for signal events is almost 100%, so that the associated uncertainty in the results is negligible.
TABLE IV: The systematic errors (in %) in the ηc branching ratio measurements of the ηcexclusive decay channels. Sources p¯p 2(π+π−) 2(K+K−) K+K−π+π−p¯pπ+π−3(π+π−) K+K−2(π+π−) K+K−π0 N(ψ(3686)) 4.0 4.0 4.0 4.0 4.0 4.0 4.0 4.0 Tracking 4.0 8.0 8.0 8.0 8.0 12.0 12.0 4.0 PID (K0 S) 2.0 6.0 6.0 4.0 4.0 8.0 8.0 2.0 Photon eff 3.0 3.0 3.0 3.0 3.0 3.0 3.0 5.0 Fit range 2.2 1.2 2.6 2.9 1.5 5.3 3.3 2.7 Bkg shape 10.3 2.5 4.7 0.9 0.3 0.2 3.5 2.8 Signal shape 2.3 2.3 2.3 2.3 2.3 2.3 2.3 2.3 KmFit eff. 7.0 6.3 7.0 8.8 10.8 7.3 4.2 2.0 Bkg veto 5.9 5.5 1.1 0.6 3.1 2.3 5.2 1.7 Cross feed 0.0 2.5 0.0 0.0 0.0 0.0 0.0 1.4 ηcdecay models 0.0 2.1 3.7 0.6 2.5 0.0 3.0 4.6 ηcline shape 0.7 0.8 0.6 0.9 0.6 0.6 0.6 0.7 Sum 15.7 14.8 14.9 14.1 15.7 18.0 17.8 10.6 Sources p¯pπ0K0 SK±π∓K0SK±π∓π±π∓π+π−η K+K−η 2(π+π−)η π+π−π0π02(π+π−π0) N(ψ(3686)) 4.0 4.0 4.0 4.0 4.0 4.0 4.0 4.0 Tracking 4.0 8.0 12.0 4.0 4.0 8.0 4.0 8.0 PID (K0 S) 2.0 1.0 1.0 0.0 2.0 0.0 0.0 0.0 Photon eff 5.0 3.0 3.0 5.0 5.0 5.0 7.0 7.0 Fit range 7.7 2.1 1.5 0.6 6.0 1.8 0.6 2.0 Bkg shape 0.1 4.7 4.7 0.1 5.9 0.8 3.3 1.6 Signal shape 2.3 2.3 2.3 2.3 2.3 2.3 2.3 2.3 KmFit eff. 6.8 6.8 7.3 2.0 1.2 6.7 2.4 2.4 Bkg veto 3.7 0.7 2.8 11.8 5.4 14.7 12.8 5.5 Cross feed 0.0 0.0 0.0 0.0 0.0 0.0 1.3 0.0 ηcdecay models 5.8 2.5 5.2 5.5 8.1 0.0 0.1 0.5 ηcline shape 0.6 0.6 0.8 0.8 0.7 0.7 0.7 0.7 Sum 14.8 13.2 17.0 15.4 15.3 19.4 16.4 13.3
2. PID and KS0 reconstruction
The systematic uncertainties due to kaon and pion identifications are determined to be 2% in Ref. [33]. We choose J/ψ → K∗0K0
S, K∗0 → Kπ to evaluate the efficiency of KS0 reconstruction. The 1% difference between data and MC is assigned as the systematic error due to this source.
3. Kinematic fitting
The systematic errors associated with kinematic fitting are estimated by using the control samples of ψ(3686) → π0π0J/ψ with J/ψ decay to hadronic final states, which have similar event topology as ψ(3686) → π0hc, hc → γηc. The average efficiency difference between data and MC, with the same χ2 requirements in the hc selection, is taken as the systematic uncertainty.
4. Cross-feed
To evaluate the effect of cross-feed among the 16 signal modes, we use samples of 50,000 MC events per mode. We find that ηc → 2(π+π−), ηc → K+K−π0 and ηc → π+π−π0π0 are contaminated by ηc → KS0K±π∓ with levels of 2.5%, 1.4%, and 1.3%, respectively. These numbers are assigned as the systematic errors associated with cross-feed. For other channels, this contamination is found to be negligible.
5. ηc decay models
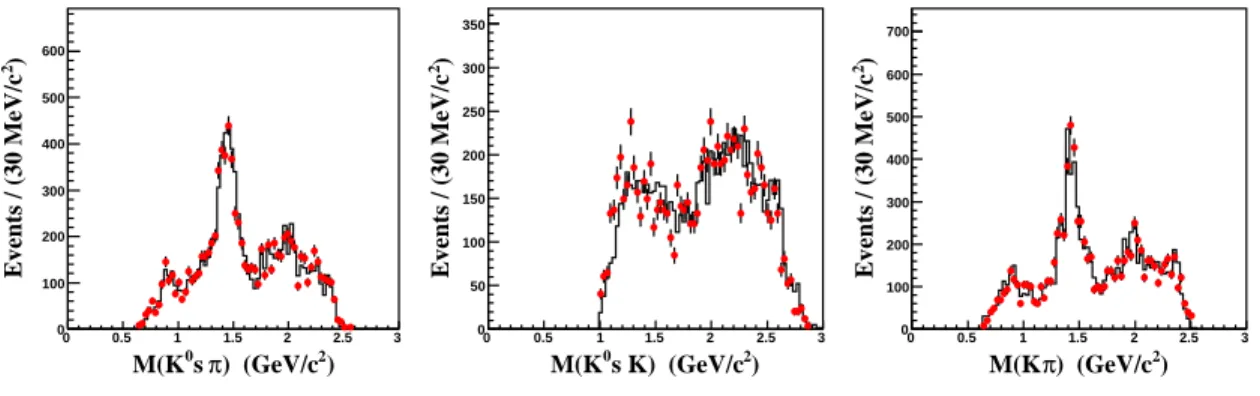
We use phase space to simulate ηc decays in our analysis. To estimate the systematic un-certainty due to neglecting intermediate states in these decays, we extract invariant masses of ηc daughter particles from ψ(3686) → γηc, ηc → Xi. We analyze MC samples generated according to these invariant masses. To illustrate, Fig. 5 shows the invariant-mass distribu-tion comparison between the data and MC for the decay mode ηc → K0
SK±π∓. In addition, for channels with low statistics and well-understood intermediate states, MC samples with these intermediate states were generated according to the relative branching ratios given by PDG. The spreads of the efficiencies obtained from the phase-space and alternative MC are taken as the systematic errors.
6. ηc line shape
Because of the ηc mass window requirement in our event selection, the line shape of ηc could be a source of systematic error in the measurement. We vary the input ηc resonant parameters by one standard deviation to estimate the uncertainty due to this source.
) 2 ) (GeV/c π s 0 M(K 0 0.5 1 1.5 2 2.5 3 ) 2 Events / (30 MeV/c 0 100 200 300 400 500 600 ) 2 s K) (GeV/c 0 M(K 0 0.5 1 1.5 2 2.5 3 ) 2 Events / (30 MeV/c 0 50 100 150 200 250 300 350 ) 2 ) (GeV/c π M(K 0 0.5 1 1.5 2 2.5 3 ) 2 Events / (30 MeV/c 0 100 200 300 400 500 600 700
FIG. 5: The dots show the mass spectra for ψ(3686) → γηc, ηc → KS0K±π∓ in data, and the solid
lines are the corresponding mass spectra from the MC simulation.
C. ηc parameter measurements
Systematic errors for the M(ηc) and Γ(ηc) measurements are summarized in Table V. All sources are treated as uncorrelated, so the total systematic uncertainty is obtained by summing in quadrature. The following subsections describe the procedures and assumptions that led to the estimates of these uncertainties.
TABLE V: The systematic errors for ηc parameter measurements.
Sources M(ηc) (MeV/c2) Γ(ηc) (MeV)
Background shape 0.36 1.45 Fitting range 0.03 0.33 Resolution description 0.10 0.02 Mass-dependent efficiencies 0.11 0.27 Mass-dependent resolutions 0.00 0.01 Kinematic fitting 0.33 0.76 Fitting method 0.11 0.40 Sum 0.52 1.74
1. Background shape
Our standard background shape is the smoothed hc side-band shape. To estimate the systematic uncertainty due to the background procedure, we change the smoothing level and technique, and vary the hc side-band ranges. The largest changes in results among these alternatives are assigned as the systematic errors.
2. Fitting range
The systematic uncertainties due to the fitting range are estimated by considering several alternatives to the standard fitting range of 2.3-3.2 GeV/c2, 2.4-3.2 GeV/c2, 2.5-3.2 GeV/c2, 2.6-3.2 GeV/c2, and 2.3-3.15 GeV/c2. The systematic uncertainties are assigned to be the largest differences between the standard fit results and those from the alternative ranges.
3. Resolution description
In order to estimate the systematic uncertainties associated with the detector-resolution description, we use MC signal shapes obtained by setting the ηc width to zero as alternatives to double Gaussians. The changes in fit results between these two methods provide the systematic errors.
4. Mass-dependent efficiency and resolution
Since the ηc signal spreads over a sizable mass range, the uncertainties due to the use of mass-independent efficiencies and resolutions need to be estimated. Mass-dependent efficiencies and resolutions are determined from MC simulation and used as an alternative to the default assumption, and the resulting differences are taken to be the systematic errors.
5. Kinematic fitting
The method to evaluate the systematic errors due to the kinematic fitting procedure and momentum measurement is the same as that in the measurement of the hc parameters.
6. Fitting method
Because we use the smoothed side-band shape to describe the background, the potential for bias due to the smoothing technique must be considered. This was investigated with a toy MC study. We start with a signal sample for each of the 16 channels selected from our standard MC to have the same statistics as data. A corresponding background sample for each channel is constructed from the mass side bands in data. The hadronic-mass distributions for these samples are then treated with a variety of smoothing procedures and fitted. The ranges in the fit results are used to set the systematic errors from this source.
VI. SUMMARY AND DISCUSSION
In summary, we have studied the process ψ(3686) → π0hc followed by hc → γη
c with an exclusive-reconstruction technique. Using a sample of 106 million ψ(3686) decays we have obtained new measurements of the mass and width of the hc and ηc charmonium resonances, and of the branching ratios for 16 exclusive ηc hadronic decay modes.
The total yield of events, measured by fitting the π0 recoil mass spectrum, is 832 ± 35 events, where the error is statistical only. With these events we measure the mass and width of the hc:
M(hc) = 3525.31 ± 0.11 ± 0.14 MeV/c2, and Γ(hc) = 0.70 ± 0.28 ± 0.22 MeV,
where the first errors are statistical and the second are systematic. These results are con-sistent with the results of a previous inclusive measurement by BESIII [13]:
M(hc) = 3525.40 ± 0.13 ± 0.18 MeV/c2, and Γ(hc) < 1.44 MeV (at 90% confidence level).
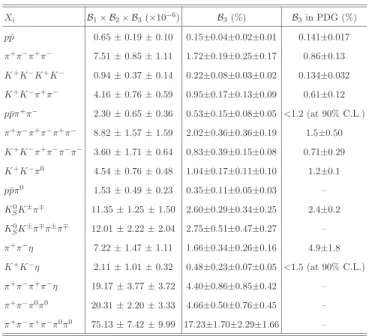
The branching-ratio results B1(ψ(3686) → π0hc) × B2(hc → γηc) × B3(ηc → Xi) and B3(ηc → Xi) are given in Table VI, quoted with the statistical and systematic errors of this measurement and, for B3, an additional systematic error associated with the input branching-ratio product B1(ψ(3686) → π0hc) × B2(hc → γηc). Most of our B3(ηc → Xi)
TABLE VI: B1(ψ(3686) → π0hc) × B2(hc → γηc) × B3(ηc → Xi) and B3(ηc → Xi) with
sys-tematic errors. The third errors in B3 measurement are systematic errors due to uncertainty of
B1(ψ(3686) → π0hc) × B2(hc → γηc). Xi B1× B2× B3(×10−6) B3(%) B3in PDG (%) p¯p 0.65 ± 0.19 ± 0.10 0.15±0.04±0.02±0.01 0.141±0.017 π+π−π+π− 7.51 ± 0.85 ± 1.11 1.72±0.19±0.25±0.17 0.86±0.13 K+K−K+K− 0.94 ± 0.37 ± 0.14 0.22±0.08±0.03±0.02 0.134±0.032 K+K−π+π− 4.16 ± 0.76 ± 0.59 0.95±0.17±0.13±0.09 0.61±0.12 p¯pπ+π− 2.30 ± 0.65 ± 0.36 0.53±0.15±0.08±0.05 <1.2 (at 90% C.L.) π+π−π+π−π+π− 8.82 ± 1.57 ± 1.59 2.02±0.36±0.36±0.19 1.5±0.50 K+K−π+π−π−π− 3.60 ± 1.71 ± 0.64 0.83±0.39±0.15±0.08 0.71±0.29 K+K−π0 4.54 ± 0.76 ± 0.48 1.04±0.17±0.11±0.10 1.2±0.1 p¯pπ0 1.53 ± 0.49 ± 0.23 0.35±0.11±0.05±0.03 – K0 SK±π∓ 11.35 ± 1.25 ± 1.50 2.60±0.29±0.34±0.25 2.4±0.2 K0 SK±π∓π±π∓ 12.01 ± 2.22 ± 2.04 2.75±0.51±0.47±0.27 – π+π− η 7.22 ± 1.47 ± 1.11 1.66±0.34±0.26±0.16 4.9±1.8 K+K−η 2.11 ± 1.01 ± 0.32 0.48±0.23±0.07±0.05 <1.5 (at 90% C.L.) π+π−π+π−η 19.17 ± 3.77 ± 3.72 4.40±0.86±0.85±0.42 – π+π−π0π0 20.31 ± 2.20 ± 3.33 4.66±0.50±0.76±0.45 – π+π−π+π−π0π0 75.13 ± 7.42 ± 9.99 17.23±1.70±2.29±1.66 –
branching-fraction results are consistent with PDG values [2], and several branching fractions are measured for the first time.
Combining our measurement of M(hc) with the previously-determined mass of the cen-troid of the 3PJ states leads to
∆ Mhf ≡ hM(13P )i − M(11P1) = −0.01 ± 0.11 (stat.) ± 0.15 (syst.) MeV/c2, (1) consistent with the lowest-order expectation that the 1P hyperfine splitting is zero.
The line shape of ηc was also studied from the E1 transition hc → γηc, and the measured resonant parameters are:
M(ηc) = 2984.49 ± 1.16 ± 0.52 MeV/c2, and Γ(ηc) = 36.4 ± 3.2 ± 1.7 MeV.
These results are consistent with the recent BESIII results from ψ(3686) → γηc [20]: M(ηc) = 2984.3 ± 0.6 ± 0.6 MeV/c2, and
Γ(ηc) = 32.0 ± 1.2 ± 1.0 MeV;
and B-factory results from γγ → ηc and B decays [17, 18]. Because of the larger ψ(3686) data sample that will be coming from BESIII and the advantage of negligible interference effects, we expect that hc → γηc will provide the most reliable determinations of the ηc resonant parameters in the future.
VII. ACKNOWLEDGMENTS
The BESIII collaboration thanks the staff of BEPCII and the computing center for their hard efforts. This work is supported in part by the Ministry of Science and Technology of China under Contract No. 2009CB825200; National Natural Science Foundation of China (NSFC) under Contracts Nos. 10745001, 10625524, 10821063, 10825524, 10835001, 10935007, 11125525; Joint Funds of the National Natural Science Foundation of China under Contracts Nos. 11079008, 11179007, 10979058; the Chinese Academy of Sciences (CAS) Large-Scale Scientific Facility Program; CAS under Contracts Nos. KJCX2-YW-N29, KJCX2-YW-N45; 100 Talents Program of CAS; Istituto Nazionale di Fisica Nucleare, Italy; Ministry of Development of Turkey under Contract No. DPT2006K-120470; U. S. Department of Energy under Contract Nos. DE-FG02-04ER41291, DE-FG02-91ER40682, DE-FG02-94ER40823; U.S. National Science Foundation; University of Groningen (RuG); the Helmholtzzentrum fuer Schwerionenforschung GmbH (GSI), Darmstadt; and WCU Pro-gram of National Research Foundation of Korea under Contract No. R32-2008-000-10155-0.
[1] E. Eichten, K. Gottfried, T. Kinoshita, K. D. Lane and T. -M. Yan, Phys. Rev. D 17, 3090 (1978) [Erratum-ibid. D 21, 313 (1980)].
[2] J. Beringer et al. [Particle Data Group], Phys. Rev. D86, 010001 (2012).
[3] S. K. Choi et al. [BELLE Collaboration], Phys. Rev. Lett. 89, 102001 (2002) [Erratum-ibid. 89, 129901 (2002)]; K. Abe et al. [BELLE Collaboration], Phys. Rev. Lett. 98, 082001 (2007). [4] D. M. Asner et al. [CLEO Collaboration], Phys. Rev. Lett. 92, 142001 (2004).
[5] B. Aubert et al. [BABAR Collaboration], Phys. Rev. D 72, 031101 (2005). [6] M. Ablikim et al. [BESIII Collaboration], Phys. Rev. Lett. 109, 042003 (2012).
[7] See, for example, E. S. Swanson, Phys. Rep. 429, 243 (2006), and references therein. [8] M. Andreotti et al. [E835 Collaboration], Phys. Rev. D 72, 032001 (2005).
[9] S. Dobbs et al. [CLEO Collaboration], Phys. Rev. Lett. 101, 182003 (2008). [10] T. A. Armstrong et al. [E760 Collaboration], Phys. Rev. Lett. 69, 2337 (1992). [11] J. L. Rosner et al. [CLEO Collaboration], Phys. Rev. Lett. 95, 102003 (2005). [12] G. S. Adams et al. [CLEO Collaboration], Phys. Rev. D 80, 051106 (2009). [13] M. Ablikim et al. [BESIII Collaboration], Phys. Rev. Lett. 104, 132002 (2010). [14] J. Y. Ge et al. [CLEO Collaboration], Phys. Rev. D 84, 032008 (2011).
[15] T. K. Pedlar et al. [CLEO Collaboration], Phys. Rev. Lett. 107, 041803 (2011). [16] T. Himel et al., Phys. Rev. Lett. 45, 1146 (1980).
[17] A. Vinokurova et al. [Belle Collaboration], Phys. Lett. B 706, 139 (2011).
[18] P. del Amo Sanchez et al. [BABAR Collaboration], Phys. Rev. D 84, 012004 (2011).
[19] R. E. Mitchell et al. [CLEO Collaboration], Phys. Rev. Lett. 102, 011801 (2009) [Erratum-ibid. 106, 159903 (2011)].
[20] M. Ablikim et al. [BESIII Collaboration], Phys. Rev. Lett. 108, 222002 (2012). [21] M. Ablikim et al. [BESIII Collaboration], Nucl. Instrum. Meth. A 614, 345 (2010). [22] M. Ablikim et al. [BESIII Collaboration], Phys. Rev. D 81, 052005 (2010).
[23] S. Agostinelli et al. [GEANT4 Collaboration], Nucl. Instrum. Meth. A 506, 250 (2003); Geant4 version: v09-03p0; Physics List simulation engine: BERT; Physics List engine packaging library: PACK 5.5.
[24] J. Allison et al., IEEE Trans. Nucl. Sci. 53, 270 (2006). [25] R. G. Ping, Chinese Physics C 32, 8 (2008).
[26] S. Jadach , B. F. L. Ward and Z. Was, Comp. Phys. Commun. 130, 260 (2000); S. Jadach, B. F. L. Ward and Z. Was, Phys. Rev. D 63, 113009 (2001).
[27] D.J. Lange, Nucl. Instrum. Meth. A 462, 152 (2001). [28] T. Sjostrand, Comput. Phys. Commun. 82, 74 (1994). [29] M. Xu, et. al., Chinese Physics C 33, 428 (2009). [30] V.V. Anashin et al., arXiv:1012.1694 [hep-ex].
[31] H. Albrecht et al. [ARGUS Collaboration], Phys. Lett. B 241, 278 (1990). [32] M. Ablikim et al. [BESIII Collaboration], arXiv:1208.4805 [hep-ex].