Abstract
In order to ensure that electrical energy reaches consumers uninterrupted, researchers constantly try to improve power transmission lines. To realize this improvement, probable faults should be analysed through every known method, and new methods should also be implemented. In this study, firstly, the Keban power transmission line located in the Eastern Anatolia region of Turkey was modelled. After that, probable short circuit scenarios were applied on the model, and the short circuit faults in the scenarios were analysed by using the Fourier analysis. The Fourier analysis is a mathematical method that is used as an effective way to determine the sudden changes in the frequency and time band. The study was successful in determining phase and grounding faults through the analyses of the scenarios using Fourier analysis. The fact that the mathematical method was applied on the prob-able scenarios on a physical model increases the importance of the study.
Keywords: Fourier analysis, short circuits in electri-cal power systems, modelling electrielectri-cal power sys-tems, time-frequency analysis
1. Introduction
Today, the production, transmission and distribu-tion of electrical energy are performed firstly by planning the processes through computer pro-grams, evaluating certain risk factors by performing various analyses, performing an economical analy-sis and lastly by the application of the plans (IAEA, 1995). With the improvements in computer tech-nology, these analyses and mathematical modelling processes have become inevitable. Many factors that previously had to be neglected in the process, from the production of energy to its distribution to end users, can now be calculated and the analysis of those evasive probable shortcomings can be per-formed in the planning phase (Paska, 2007; Billinton et al., 1997; Chanda and Bhattschsrjee, 1994).
Two of the most important types of faults in elec-trical power systems to come to mind are short cir-cuits and probable grounding faults. Short circuiting is presently one of the most prevalent faults in elec-trical power systems (Yuhai et al., 2007). These faults may occur between the phases as well as between the phases and the ground (Hambley, 2011). Short circuits can be classified as three phase short circuit faults, arc faults and grounding faults. The faults may occur for various reasons. These faults can be analysed through conventional meth-ods as well as modern sign processing methmeth-ods (Akinci et al., 2013). Sign processing methods pro-vide successful results through the analysis of the fault in the frequency domain.
The only valid standard for short circuit studies in the world is IEC 60609 (Kasikci, 2002). Improvements in computer systems provide us with the opportunity to perform modelling processes in
The determination of short circuits and grounding faults in
electric power systems using time-frequency analysis
Vedat Esen
Vocational High School, Department of Electricity, İstanbul Arel University, Istanbul, Turkey
Bulent Oral
Department of Electrical & Electronics Engineering, Faculty of the Technology, Marmara University, Istanbul, Turkey
Tahir Cetin Akinci
these studies, and enable us to get results in a much shorter time with highly realistic simulations.
The Matlab-Simulink © software, which was used for the simulations in this study, has also been conducted using many similar studies. There are many studies on short circuit faults performed through various simulation techniques in the litera-ture, as well as many other studies where simulation programs were used (Kankaratug et al., 2011; Faig et al., 2010; Pamuk, 2011; Aygen et al., 1995; Gopalakrishnan et al., 2000; Miroshnik, 2000; Maslo and Vnoucek, 2009; Ekici et al., 2009; Serrican et al., 2010; Ekiz and Tumay; Závodný, 2005; Evrenosoglu, 2005; Tekin, 2006).
In recent years, the evaluation of short circuit effects in power systems through the static synchro-nized serial compensator method (Kankaratug et al.,2011), the evaluation of short circuits in electri-cal systems which include wind generators (Tekin, 2006), the evaluation of short circuits in the Van city electric power transmission line (Dogruer, 2007), and the computer modelling of the Tedas block sub-station – stadium distribution system in Adapazarı (Acar, 2008) have been performed. In this study, the Keban power transmission line was modelled and the faults occurring as a result of the probable short circuiting scenarios were analysed by using the Short Time Fourier Transformation. At the end of the analysis, the characteristic properties of phase-ground and phase-phase faults were deter-mined using the Short Time Fourier Transform (STFT) method.
2. Types of short circuits
Short circuit currents can be calculated based on the impedance the circuit represents. This imped-ance, in turn, can be calculated by summing up the various resistances and the reactance in the power source and the error line loop. Mathematically, this short circuit impedance is calculated through (ZSC)
Equation (1). In this calculation, ΣR is the sum of the serial resistances and ΣX is the sum of the serial reactance (Schneider Electric, 2005).
3. Modelling the Keban transmission line and the simulation of short circuiting
Modelling or simulation are the terms used in the systematic evaluation and design of an existing sys-tem. Mathematical modelling is an efficient and economical way of better understanding, analysing and designing systems (Unal, 1996).
In modelling, the model should be mathemati-cally calculable and detailed enough to allow for the same results obtained from the real system, and the results should reflect the reality. In a study about the performance of a system, first, a model of the sys-tem should be constructed. A model should be sim-ilar to a real system; it should be a simplified exam-ple of the ideal state of a system. The modelling of electrical systems is especially important, since it allows for future faults to be predicted and calculat-ed and the precautions to be taken (Patel et al., 2002).
In this context, the model used in this study was designed as an exact model of the Keban line using 2009 TEİAS data for the parameters on the trans-mission line under ideal conditions.
Transmission systems are the systems which encompass everything between the production plants and the distribution systems, and in which the transmission of electrical energy at the levels of High Voltage (HV) and Very High Voltage (VHV) are performed. In Turkey, the transmission system voltage level is standardized as 380 kV and 154 kV (TEIAS, 2011).
The length of the 380 kV lines in Turkey is approximately 14 420 km and their carrying capac-ity is approximately 1000 MW. Even though relay stations are sufficient, transmission system insuffi-ciency and problems persist in certain areas. As a result of the new dams built in Turkey in order to meet the energy need and the disruptions in the power transmission lines after the 1999 Marmara earthquake, after 2006, the transmission lines in the
country are constantly being renewed through the new budget and new programs implemented, and they are improved with new lines, new transformer groups, or adding new thermal plants to the net-works. These improvements and renewals constant-ly cause changes in power transmission and distri-bution lines. According to data from TEIAS, the production capacity of present plants in 2010 was 222,533 GWh, while this number is expected to be 255,362 GWh in 2012 when the new plants which already had their licenses and began construction start to operate. Additionally, a 4 000 MW addi-tional consumption need every year necessitates the present system to be altered every year and new plants to be added to the system. This renewal and improvement continue without any interruption with the added effect of industrialization and urban-ization.
In this study, the 380 kV Keban power transmis-sion line was realistically modelled using the 2009 TEIAS data. The modelling was performed using the Matlab-Simulink© software. Keban Transmis-sion Line Matlab Simulink Modelling is shown in Figure 1.
4. Modelling with system parameters
The load distribution of power systems in Turkey is done and controlled by the National Dispatching Centre. These institutions are responsible for the maintenance, work and load distribution of the interconnected system elements in their regions (TEIAS; EMO, 2007; Donmez, 2008). The map showing Dispatching Centre regions is given in Figure 2 (TEIS).
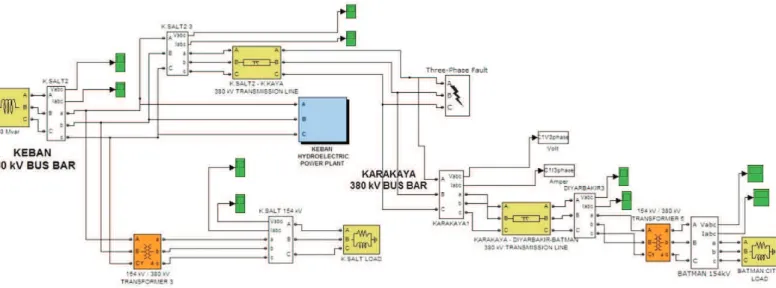
In the load dispatching map given in Figure 2, regions can be seen to have integrations with the neighbouring countries besides the integrations among them. In this study, the South-eastern Anatolia Power system in the Electrical Power Network of Turkey was evaluated, and the 380 kV/1,530 MVA Keban transmission line was mod-elled. The data from the Turkey Electric Transmission Corporation (Donmez, 2008) was used in the model. The load values and other parameters of the selected line reflect the properties of the interconnected network, which was updated in 2009. The line schematics of the model are shown in Figure 3.
In Figure 3, the model of the line on the Keban transmission line was constructed. The schematics of the faults are given in Figure 4. Here, the point (1) identifies the first data collection point, and (2) denominates the second. The second point is also the point of fault where short circuiting occurs.
In Figure 4, the data collection system pertaining to the Keban power transmission line is shown schematically. The explanations of the scenarios on the model are given in Table 1.
Figure 2: Inter-regional integration plan on the Turkey electrical network (TEIAS)
Figure 3: Keban power transmission line plan Figure 1: Keban transmission line Matlab Simulink modelling
Table 1: Short circuit scenarios are created on the model
Case 1 R Phase – Ground Short Circuit Case 2 R – S Phase – Ground Short Circuit Case 3 R – S – T Phase – Ground Short Circuit Case 4 R – S Phase Short Circuit (Two Phase ) Case 5 R – S – T Phase Short Circuit (Three Phase)
In Table 1, five basic scenarios were taken and the type of fault each scenario represents was
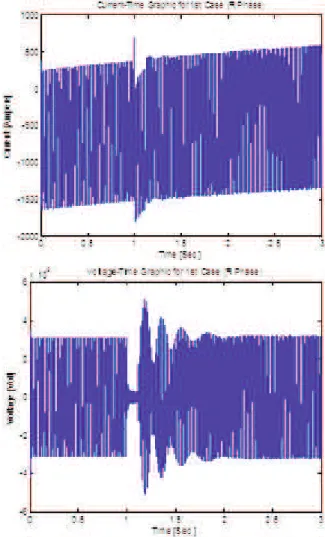
shown. These scenarios include Phase-Ground or Phase-Phase short circuits. Figure 5 shows that Matlab Simulink models created faults in Table 1, and the time-frequency analysis method was used for these failures. Figure 5 shows the Current-Time and Voltage-Time graphs for an R phase-ground fault formed on a point on the line. The timing for the short circuit event starts at the 1st second and
continues until the 1.3rd second. The short time
short circuit event, the current and the voltage to time graphs are given in Figures 10, 11 and 12, respectively.
The current-time graph of the second case is given in Figure 6. It can be clearly seen here that the second case graphs are different from the graphs of the first fault point. Here, the 1stfault point is closer
to the generator point of the Keban plant and at the beginning of the transmission line. The second data collection point (2nd point) is on the line between
the 89 km transmission line and the 181 km trans-mission lines. The 2ndpoint is where the fault is
sim-ulated to occur. It has also been used in the data collection as a measurement point. This transmis-sion line is shown in Figure 3, and the line schemat-ics are the occurrence point for the faults as shown in Figure 4. Fault scenarios were formed based on the line schematics in Figure 4.
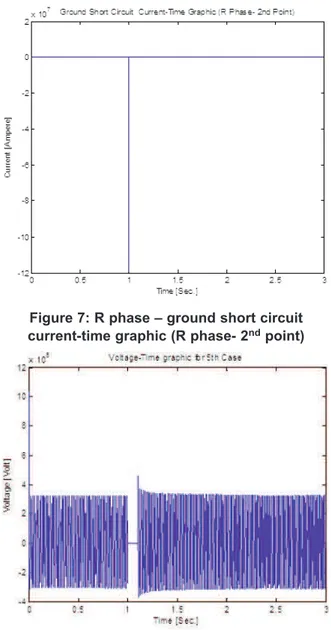
In Figure 7, the r Phase-Ground short circuit (Case 1) of the data gathered from the 2ndpoint is
Figure 4: Keban power transmission line data collection plan
Figure 5: R phase-ground short circuit
given. The graph shows, the formation of an R phase-ground short circuit after the 1stsecond can
be clearly seen. This graphic is a current-time graphic and very different from the voltage-time graphic. This difference is caused by the 2nddata
point located between two transmission lines. Similarly, the voltage-time graphic of the Case 5 is given in Figure 8.
Figure 7: R phase – ground short circuit current-time graphic (R phase- 2ndpoint)
Figure 8: Voltage-time graphic for the Case 5 5. Mathematical methods
In this section, the mathematical methods used in the analysis of short circuit events in the electrical power systems are mentioned. The Time-Frequency analysis method was used in the analysis.
6. The time-frequency analysis method Spectral analysis methods (Time-frequency analy-sis) are Fourier Transformation (FT) based approaches, and this study used mostly the Short Time Fourier Transformation (STFT) approach. The STFT approach is an alternative method based on the classic Fourier Transformation used in the
analysis of dynamic data (Vaseghi, 1996; Akinci et al.,2009; Onal and Dikun, 2013).
In this context, the S{.}value is called the spec-trogram of the x(t) signal.
8. The spectral analysis of the short circuit fault
In this section, the analysis of the data obtained from the Keban energy transmission line model through the short circuit fault was performed with the Fourier method (Time-Frequency analysis). Analyses for every scenario or case were performed in the study.
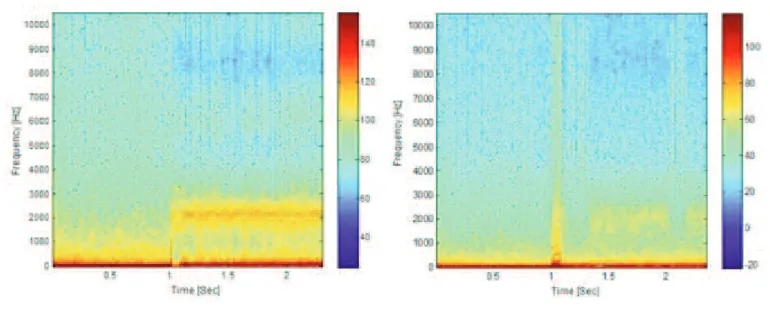
In Figure 9, as a result of a phase-ground short circuit, high frequency components begin to form after the 1stsecond. Although the fundamental
fre-quency of the system is 50 Hz, frequencies as high as almost 3 kHz occur.
Figure 10 demonstrates the time frequency analysis output of the current short circuit for the R phase of Case 2. As seen in the analysis, the high frequency components are only seen at the moment of the short circuit fault, and current flows through the circuit with the system frequency, which is about the fundamental frequency 50 Hz, in other time
regions. A similar case can be seen in Figures 11 and 12.
In Figure 13, the time frequency spectrum of a three phase short circuit on the 2ndpoint was given.
As seen on the spectrum, voltage is not induced on the system at the moment when the short circuit fault occurs, and the system returns to its nominal values as soon as the fault ends.
While a similar problem is encountered on the system, especially in the case of short circuit faults between two transmission lines, it can be seen at the 1stmeasurement point that the current draws on
the system in cases of fault. This can be interpreted as the system feeding other loads. The Keban power transmission line was examined exclusively in this study, and the interpretations on system char-acteristics are made based on this system. The results of time-frequency analyses may be different in different systems.
Figure 9: Voltage spectrum of the R phase ground short-circuit failure
Figure 10: Short circuit analysis of the R phase for Case 2
Figure 11: 1stcase Short circuit analysis of the
R phase at the 2ndpoint
Figure 12: Time-frequency analysis of Case 2 – 2ndfault point
Figure 13: Time-frequency analysis of the Case 5 – 2ndpoint
9. Conclusion
In this study, a line on the Keban power transmis-sion line in the Eastern Anatolia Region in Turkey was modelled using real parameters, and the short circuit scenarios were generated over this model. In addition, the data was analysed using the Time-fre-quency spectrum. It was observed that the findings were consistent with the graphics derived from the Matlab-Simulink modelling. In the study, a short cir-cuit fault was generated on one point over the line and the measurements were taken from two points. The important findings related to the measurements of the short circuit fault spectrums are listed below.
The graphic regarding the three phase short cir-cuit fault, namely the fifth condition on the second fault point, is presented in Figure 14. This graphic can also be interpreted as a graphic demonstrating that there was no voltage transmission during the short circuit between the 1.0 and 1.3 seconds. A column can be observed at approximately 0 Hz, which can also be seen in the colour bar between the 1.0 and 1.3 seconds.
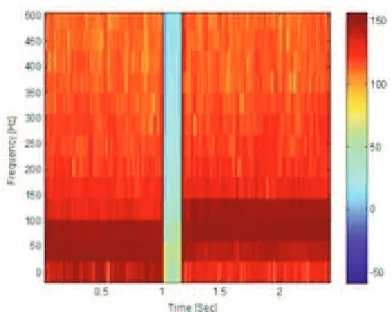
Another important finding of this study was that 50 Hz, which can be seen in Figure 15, is clearly the fundamental frequency area. The short circuit fault area, which is the fundamental frequency area, can be clearly observed in the same frequency area with different distributions after the short circuit. In addi-tion, the short circuit fault area can also be seen clearly between the frequencies of 100 Hz and 150 Hz with its high amplitude.
In Figure 16, it can be observed that frequency components higher than the fundamental frequen-cy of 50 Hz are formed immediately after the short circuit fault. This analysis can be regarded as one of the most important findings of the current study. The high frequency area became evident on all fre-quencies (50-500 Hz), particularly during the peri-od between the 1.0 and 1.3 seconds. Its distinct characteristics were observed on different frequency components after the mentioned period.
Finally, another important finding of the present study was that the results of the Fourier analysis, which occur during short circuits, differ according to the type of fault, the length of the line or loading (Onal and Dikun, 2013; Seker and Akinci, 2012). In case of conducting characteristic investigations on the line, it can be suggested that the Time-Frequency analysis yields effective results and is an efficient method for determining the characteristics of a system. Regarding the region, where the pres-ent study was conducted, it was observed that the high frequencies occurred as a result of the fault in 100-150 Hz frequency components after the short circuit fault and that frequencies above 500 Hz occurred during the fault.
Further studies can investigate the sensitivity of systems to short circuit fault by using the methods of artificial intelligence.
Figure 14: Three phase short circuit fault for 2ndfault point
Figure 15: Analysis of short-circuit fault zones
Abbreviations
ZSC Short circuit impedance
ISC Short circuit current
ΣR Sum of serial resistances ΣX Sum of serial reactance
Vn Uncharged nominal network voltage
VLL Voltage between phases
References
Acar O. (2008). Modelling on Computer Environment of Adapazarı Tedaş Ada Transformer-stadium
Dispatching System. Master’s Thesis, Sakarya University, Sakarya, Turkey.
Akinci T.C., Ekren N., Seker S., and Yildirim S. (2013). Continuous Wavelet Transform for Ferroresonance Phenomena in Electric Power Systems, International
Journal of Electrical Power & Energy Systems -Elsevier, 44:403-409.
Akinci, T.C., Seker S., and Ekren N. (2009). Feature Extraction for Ferroresonance Phenomena in Electric Power System, International Conference on
Modeling and Simulation (IASTED) MS’09, Alberta, Canada, July 2009.
Aygen Z.E., Batman M.A., and Tarkan N. (1995). Short Circuit Analysis up to Probability with Monte Carlo Method in Electrical Energy Systems. Electrical Engineering 6thInternational Congress, pp.41–44,
September 11–17, 1995.
Billinton R, Salvaderi L, McCalley JD, Chao H, Seitz Th, Allan R. N, Odom J, and Fallon C, (1997).
Reliability issues in today’s electric power utility envi-ronment. IEEE Transac Power Systems, 124: No. 4. Chanda R.S., and Bhattacharjee P.K. (1994).
Application of computer software in transmission expansion planning using variable load structure.
Electric Power Syst Res, 31:13–20.
Dogruer V. (2007). Short Circuit Fault Analysis via Matlab Simulink and Van’s Energy Transmission Line Examination as a Pattern. Master’s Thesis, Yuzuncu Yil University, Van, Turkey.
Donmez F. (2008). Computer Supported Analysis of System Fall Appearing after Calamity in Electrical Meshwork. Master’s Thesis, Marmara University, Istanbul, Turkey.
Ekici S., Yildirim S., and Poyraz M, A. (2009). Pattern Recognition Application to Keep Distance. Gazi
University Faculty of Engineering Architecture Periodical, 24:51–61.
Ekiz A., and Tumay M. Modelling Harmonics Appearing in Factories by being used Matlab/Simulink. Electrical- Electronics- Computer Engineering 10th
International Congress, Ankara, pp.99–102. EMO (2007). Aegean Region Production Transmission
and Dispatching. Technics, EMO Izmir city Branch Energy Commision, May, 2007.
Evrenosoglu C.Y., and Abur A. (2005). Travelling Wave Based Fault Location for Teed Circuits, IEEE
Transac Power Deliv, 20:1115–1121.
Faig J., Melendez J, Herraiz S, and Sánchez J. (2010). Analysis of Faults in Power Distribution Systems With Distributed Generation. International
Conference on Renewable Energies and Power Quality (ICREPQ’10), Granada, Spain, 23th to 25th March, 2010.
Gopalakrishnan A., Kezunovic M., McKenna S.M., and Hamai D.M. (2000). Fault Location Using the Distributed Parameter Transmission Line Model.
IEEE Transac Power Deliv, 15:1169-1174. Hambley, A.R. Electrical engineering: principles and
applications. Prentice Hall. pp. 637,
ISBN 9780131470460, Retrieved 20 April 2011. IAEA (1995). Expansion Planning for Electrical
Generating Systems, A Guidebook, Technical Reports Series No. 241 1984 or User’s Manual of WASP-III Plus, Computer Manual Series, No. 8, 1995.
Kamkaratug P. (2011). Redution of Over Line Current in Power System from Short Circuit Effect Using Static Synchronous Series Compensator. Am J Appl
Sci, 8:129–133.
Kasikci I. (2002). Short Circuits in Power Systems: A Practical Guide to IEC 60 909. Wiley-VCH, Weinheim, Germany.
Maslo K., and Vnoucek S. (2001). Short Circuit Calculation Analysis. Paper accepted for presenta-tion at PPT 2001, IEEE Porto Power Tech
Conference 10th -13th September, Porto, Portugal, 2001.
Miroshnik R. (2000). The probabilistic model of the dynamic of the cables under short-circuit current. Comp Meths Appl Mech Eng, 187:201–211. Onal E., and Dikun J. (2013). Short-Time Fourier
Transform for Different Impulse Measurements, Balkan Journal of Electrical & Computer
Engineering, Vol.1, No.1, pp.44-47.
Pamuk N. (2011). Modelling and analysing of electrical transmission meshwork in Sakarya by being used matlab/simulink programs. Erciyes University
Science Institute Periodical, 27:19–39.
Paska J. (2007). Methodologies and Tools for Electric Power System Reliability Assessment on HL I and HL II Levels, 9th International Conference-Electrical power Quality and Utilisation, Barcelona, October 9–11, 2007.
Patel R., Bhatti T.S., and Kothari D.P. (2002). MAT-LAB/Simulink-based transient stability analysis of a multimachine power system. Int J Electrical Eng
Educ, 39:320–336.
PDH Online. Introduction to Short Circuits Analysis. www.pdhonline.org/cgi-in/quiz/courses/courselist. cgi?class_name=e204:Introduction, 18/03/2013. Schneider Electric (2005). Calculation of Short-Circuit
Currents. Cahier Technique No.158.
Seker S., Akinci T.C., and Taskin S. (2012). Spectral and Statistical Analysis for Ferroresonance Phenomenon in Electric Power System, Electrical Engineering-Springer 2012, Vol..94, No..2, pp.117-124. Serrican A.C., Ozdemir A, and Kaypmaz A. (2010).
Short circuit analyzes of power system of PETKIM petrochemical aliaga complex. Online J Electron
Elec Eng (OJEEE),336–340.
Smeets R.P.P. (2010). Lathouwers AGA. Short-circuit withstand of T&D components, CEPSI Proceedings of the 18th Conference on the Electronic Power
Supply Industry, Taipei, Taiwan, October 24–28, 2010.
TEIAS: Transmission and Dispatching
System-Transmission System. http://www.teias.gov.tr/apkure-tim/iletimdagitim.htm. 08/04/2011.
TEIAS: Turkey Electricity Production- Dispatching Statistics 2008,
http://www.teias.gov.tr/istatistik2008/index.htm. 08/04/2011.
TEIAS: Load Dispatch Chamber Headship Management Function Reports. http://www.teias.gov.tr/yukdag-itim/yillik_menu.htm. 08/04/2011.
TEIAS: 9th Dispatching Facility and Management Group
Directorship 380 Kv-ENH List. www. teias.gov.tr/Gr9/eihatlariliste.xls. 08/04/2011. TEIAS: Load Dispatch Management Headship.
http://www.teias.gov.tr/haritayukOK.htm. 09.04.2011.
Tekin K. (2006). Short Circuit and Interaction
Examination in Electrical Systems Containing Wind Energy Facility. Master’s Thesis, Istanbul Technical University, Istanbul, Turkey.
Unal A. (1996). Determination of mathematical model of an electric power system using linear graph. Math
Comput Appl, 1:134–139.
Vaseghi V.S. (1996). Advanced Signal Processing and Digital Noise Reduction, John Wiley, New York, USA.
Yuhai S., Guangjian W., and Xiangguo C. (2007). Fault Detection and Analysis of Distributed Power System Short-circuit Using Wavelet Fractal Network, The Eighth International Conference on Electronic Measurement and Instruments.
Závodný I.M (2005). Power Electric System Transient Simulation Using Matlab-Simulink. Konference a soutež Student EEICT.