arXiv:1508.00151v1 [hep-ex] 1 Aug 2015
D
+→
φe
+ν
eM. Ablikim1, M. N. Achasov9,f, X. C. Ai1, O. Albayrak5, M. Albrecht4, D. J. Ambrose44, A. Amoroso49A,49C, F. F. An1, Q. An46,a, J. Z. Bai1, R. Baldini Ferroli20A, Y. Ban31, D. W. Bennett19, J. V. Bennett5, M. Bertani20A, D. Bettoni21A, J. M. Bian43, F. Bianchi49A,49C, E. Boger23,d, I. Boyko23, R. A. Briere5, H. Cai51, X. Cai1,a, O. Cakir40A,b, A. Calcaterra20A,
G. F. Cao1, S. A. Cetin40B, J. F. Chang1,a, G. Chelkov23,d,e, G. Chen1, H. S. Chen1, H. Y. Chen2, J. C. Chen1, M. L. Chen1,a, S. J. Chen29, X. Chen1,a, X. R. Chen26, Y. B. Chen1,a, H. P. Cheng17, X. K. Chu31, G. Cibinetto21A, H. L. Dai1,a, J. P. Dai34, A. Dbeyssi14, D. Dedovich23, Z. Y. Deng1, A. Denig22, I. Denysenko23, M. Destefanis49A,49C, F. De Mori49A,49C, Y. Ding27, C. Dong30, J. Dong1,a, L. Y. Dong1, M. Y. Dong1,a, S. X. Du53, P. F. Duan1, E. E. Eren40B,
J. Z. Fan39, J. Fang1,a, S. S. Fang1, X. Fang46,a, Y. Fang1, L. Fava49B,49C, F. Feldbauer22, G. Felici20A, C. Q. Feng46,a, E. Fioravanti21A, M. Fritsch14,22, C. D. Fu1, Q. Gao1, X. Y. Gao2, Y. Gao39, Z. Gao46,a, I. Garzia21A, K. Goetzen10, W. X. Gong1,a, W. Gradl22, M. Greco49A,49C, M. H. Gu1,a, Y. T. Gu12, Y. H. Guan1, A. Q. Guo1, L. B. Guo28, Y. Guo1,
Y. P. Guo22, Z. Haddadi25, A. Hafner22, S. Han51, X. Q. Hao15, F. A. Harris42, K. L. He1, X. Q. He45, T. Held4, Y. K. Heng1,a, Z. L. Hou1, C. Hu28, H. M. Hu1, J. F. Hu49A,49C, T. Hu1,a, Y. Hu1, G. M. Huang6, G. S. Huang46,a,
J. S. Huang15, X. T. Huang33, Y. Huang29, T. Hussain48, Q. Ji1, Q. P. Ji30, X. B. Ji1, X. L. Ji1,a, L. W. Jiang51, X. S. Jiang1,a, X. Y. Jiang30, J. B. Jiao33, Z. Jiao17, D. P. Jin1,a, S. Jin1, T. Johansson50, A. Julin43,
N. Kalantar-Nayestanaki25, X. L. Kang1, X. S. Kang30, M. Kavatsyuk25, B. C. Ke5, P. Kiese22, R. Kliemt14, B. Kloss22, O. B. Kolcu40B,i, B. Kopf4, M. Kornicer42, W. K¨uhn24, A. Kupsc50, J. S. Lange24, M. Lara19, P. Larin14, C. Leng49C,
C. Li50, Cheng Li46,a, D. M. Li53, F. Li1,a, F. Y. Li31, G. Li1, H. B. Li1, J. C. Li1, Jin Li32, K. Li33, K. Li13, Lei Li3, P. R. Li41, T. Li33, W. D. Li1, W. G. Li1, X. L. Li33, X. M. Li12, X. N. Li1,a, X. Q. Li30, Z. B. Li38, H. Liang46,a, Y. F. Liang36, Y. T. Liang24, G. R. Liao11, D. X. Lin14, B. J. Liu1, C. X. Liu1, F. H. Liu35, Fang Liu1, Feng Liu6, H. B. Liu12, H. H. Liu16, H. H. Liu1, H. M. Liu1, J. Liu1, J. B. Liu46,a, J. P. Liu51, J. Y. Liu1, K. Liu39, K. Y. Liu27,
L. D. Liu31, P. L. Liu1,a, Q. Liu41, S. B. Liu46,a, X. Liu26, Y. B. Liu30, Z. A. Liu1,a, Zhiqing Liu22, H. Loehner25, X. C. Lou1,a,h, H. J. Lu17, J. G. Lu1,a, Y. Lu1, Y. P. Lu1,a, C. L. Luo28, M. X. Luo52, T. Luo42, X. L. Luo1,a, X. R. Lyu41,
F. C. Ma27, H. L. Ma1, L. L. Ma33, Q. M. Ma1, T. Ma1, X. N. Ma30, X. Y. Ma1,a, F. E. Maas14, M. Maggiora49A,49C, Y. J. Mao31, Z. P. Mao1, S. Marcello49A,49C, J. G. Messchendorp25, J. Min1,a, R. E. Mitchell19, X. H. Mo1,a, Y. J. Mo6,
C. Morales Morales14, K. Moriya19, N. Yu. Muchnoi9,f, H. Muramatsu43, Y. Nefedov23, F. Nerling14, I. B. Nikolaev9,f, Z. Ning1,a, S. Nisar8, S. L. Niu1,a, X. Y. Niu1, S. L. Olsen32, Q. Ouyang1,a, S. Pacetti20B, P. Patteri20A, M. Pelizaeus4, H. P. Peng46,a, K. Peters10, J. Pettersson50, J. L. Ping28, R. G. Ping1, R. Poling43, V. Prasad1, M. Qi29, S. Qian1,a, C. F. Qiao41, L. Q. Qin33, N. Qin51, X. S. Qin1, Z. H. Qin1,a, J. F. Qiu1, K. H. Rashid48, C. F. Redmer22, M. Ripka22, G. Rong1, Ch. Rosner14, X. D. Ruan12, V. Santoro21A, A. Sarantsev23,g, M. Savri´e21B, K. Schoenning50, S. Schumann22, W. Shan31, M. Shao46,a, C. P. Shen2, P. X. Shen30, X. Y. Shen1, H. Y. Sheng1, W. M. Song1, X. Y. Song1, S. Sosio49A,49C,
S. Spataro49A,49C, G. X. Sun1, J. F. Sun15, S. S. Sun1, Y. J. Sun46,a, Y. Z. Sun1, Z. J. Sun1,a, Z. T. Sun19, C. J. Tang36, X. Tang1, I. Tapan40C, E. H. Thorndike44, M. Tiemens25, M. Ullrich24, I. Uman40B, G. S. Varner42, B. Wang30, D. Wang31,
D. Y. Wang31, K. Wang1,a, L. L. Wang1, L. S. Wang1, M. Wang33, P. Wang1, P. L. Wang1, S. G. Wang31, W. Wang1,a, X. F. Wang39, Y. D. Wang14, Y. F. Wang1,a, Y. Q. Wang22, Z. Wang1,a, Z. G. Wang1,a, Z. H. Wang46,a, Z. Y. Wang1,
T. Weber22, D. H. Wei11, J. B. Wei31, P. Weidenkaff22, S. P. Wen1, U. Wiedner4, M. Wolke50, L. H. Wu1, Z. Wu1,a, L. G. Xia39, Y. Xia18, D. Xiao1, H. Xiao47, Z. J. Xiao28, Y. G. Xie1,a, Q. L. Xiu1,a, G. F. Xu1, L. Xu1, Q. J. Xu13, X. P. Xu37, L. Yan46,a, W. B. Yan46,a, W. C. Yan46,a, Y. H. Yan18, H. J. Yang34, H. X. Yang1, L. Yang51, Y. Yang6, Y. X. Yang11, M. Ye1,a, M. H. Ye7, J. H. Yin1, B. X. Yu1,a, C. X. Yu30, J. S. Yu26, C. Z. Yuan1, W. L. Yuan29, Y. Yuan1,
A. Yuncu40B,c, A. A. Zafar48, A. Zallo20A, Y. Zeng18, B. X. Zhang1, B. Y. Zhang1,a, C. Zhang29, C. C. Zhang1, D. H. Zhang1, H. H. Zhang38, H. Y. Zhang1,a, J. J. Zhang1, J. L. Zhang1, J. Q. Zhang1, J. W. Zhang1,a, J. Y. Zhang1, J. Z. Zhang1, K. Zhang1, L. Zhang1, X. Y. Zhang33, Y. Zhang1, Y. N. Zhang41, Y. H. Zhang1,a, Y. T. Zhang46,a, Yu Zhang41,
Z. H. Zhang6, Z. P. Zhang46, Z. Y. Zhang51, G. Zhao1, J. W. Zhao1,a, J. Y. Zhao1, J. Z. Zhao1,a, Lei Zhao46,a, Ling Zhao1, M. G. Zhao30, Q. Zhao1, Q. W. Zhao1, S. J. Zhao53, T. C. Zhao1, X. H. Zhao29, Y. B. Zhao1,a, Z. G. Zhao46,a, A. Zhemchugov23,d, B. Zheng47, J. P. Zheng1,a, W. J. Zheng33, Y. H. Zheng41, B. Zhong28, L. Zhou1,a, X. Zhou51, X. K. Zhou46,a, X. R. Zhou46,a, X. Y. Zhou1, K. Zhu1, K. J. Zhu1,a, S. Zhu1, S. H. Zhu45, X. L. Zhu39, Y. C. Zhu46,a,
Y. S. Zhu1, Z. A. Zhu1, J. Zhuang1,a, L. Zotti49A,49C, B. S. Zou1, J. H. Zou1 (BESIII Collaboration)
1 Institute of High Energy Physics, Beijing 100049, People’s Republic of China 2 Beihang University, Beijing 100191, People’s Republic of China
3 Beijing Institute of Petrochemical Technology, Beijing 102617, People’s Republic of China 4 Bochum Ruhr-University, D-44780 Bochum, Germany
5 Carnegie Mellon University, Pittsburgh, Pennsylvania 15213, USA 6 Central China Normal University, Wuhan 430079, People’s Republic of China
7 China Center of Advanced Science and Technology, Beijing 100190, People’s Republic of China
8 COMSATS Institute of Information Technology, Lahore, Defence Road, Off Raiwind Road, 54000 Lahore, Pakistan 9 G.I. Budker Institute of Nuclear Physics SB RAS (BINP), Novosibirsk 630090, Russia
10GSI Helmholtzcentre for Heavy Ion Research GmbH, D-64291 Darmstadt, Germany 11 Guangxi Normal University, Guilin 541004, People’s Republic of China
13 Hangzhou Normal University, Hangzhou 310036, People’s Republic of China 14 Helmholtz Institute Mainz, Johann-Joachim-Becher-Weg 45, D-55099 Mainz, Germany
15 Henan Normal University, Xinxiang 453007, People’s Republic of China
16 Henan University of Science and Technology, Luoyang 471003, People’s Republic of China 17Huangshan College, Huangshan 245000, People’s Republic of China
18Hunan University, Changsha 410082, People’s Republic of China 19 Indiana University, Bloomington, Indiana 47405, USA
20(A)INFN Laboratori Nazionali di Frascati, I-00044, Frascati, Italy; (B)INFN and University of Perugia, I-06100, Perugia, Italy
21 (A)INFN Sezione di Ferrara, I-44122, Ferrara, Italy; (B)University of Ferrara, I-44122, Ferrara, Italy 22Johannes Gutenberg University of Mainz, Johann-Joachim-Becher-Weg 45, D-55099 Mainz, Germany
23 Joint Institute for Nuclear Research, 141980 Dubna, Moscow region, Russia
24 Justus Liebig University Giessen, II. Physikalisches Institut, Heinrich-Buff-Ring 16, D-35392 Giessen, Germany 25 KVI-CART, University of Groningen, NL-9747 AA Groningen, The Netherlands
26Lanzhou University, Lanzhou 730000, People’s Republic of China 27Liaoning University, Shenyang 110036, People’s Republic of China 28 Nanjing Normal University, Nanjing 210023, People’s Republic of China
29 Nanjing University, Nanjing 210093, People’s Republic of China 30Nankai University, Tianjin 300071, People’s Republic of China
31 Peking University, Beijing 100871, People’s Republic of China 32Seoul National University, Seoul, 151-747 Korea 33Shandong University, Jinan 250100, People’s Republic of China 34Shanghai Jiao Tong University, Shanghai 200240, People’s Republic of China
35 Shanxi University, Taiyuan 030006, People’s Republic of China 36 Sichuan University, Chengdu 610064, People’s Republic of China
37 Soochow University, Suzhou 215006, People’s Republic of China 38Sun Yat-Sen University, Guangzhou 510275, People’s Republic of China
39Tsinghua University, Beijing 100084, People’s Republic of China
40 (A)Istanbul Aydin University, 34295 Sefakoy, Istanbul, Turkey; (B)Dogus University, 34722 Istanbul, Turkey; (C)Uludag University, 16059 Bursa, Turkey
41 University of Chinese Academy of Sciences, Beijing 100049, People’s Republic of China 42 University of Hawaii, Honolulu, Hawaii 96822, USA
43 University of Minnesota, Minneapolis, Minnesota 55455, USA 44University of Rochester, Rochester, New York 14627, USA
45 University of Science and Technology Liaoning, Anshan 114051, People’s Republic of China 46 University of Science and Technology of China, Hefei 230026, People’s Republic of China
47 University of South China, Hengyang 421001, People’s Republic of China 48 University of the Punjab, Lahore-54590, Pakistan
49 (A)University of Turin, I-10125, Turin, Italy; (B)University of Eastern Piedmont, I-15121, Alessandria, Italy; (C)INFN, I-10125, Turin, Italy
50 Uppsala University, Box 516, SE-75120 Uppsala, Sweden 51Wuhan University, Wuhan 430072, People’s Republic of China 52Zhejiang University, Hangzhou 310027, People’s Republic of China 53Zhengzhou University, Zhengzhou 450001, People’s Republic of China
a Also at State Key Laboratory of Particle Detection and Electronics, Beijing 100049, Hefei 230026, People’s Republic of China
b Also at Ankara University,06100 Tandogan, Ankara, Turkey cAlso at Bogazici University, 34342 Istanbul, Turkey
dAlso at the Moscow Institute of Physics and Technology, Moscow 141700, Russia e Also at the Functional Electronics Laboratory, Tomsk State University, Tomsk, 634050, Russia
f Also at the Novosibirsk State University, Novosibirsk, 630090, Russia g Also at the NRC “Kurchatov Institute”, PNPI, 188300, Gatchina, Russia
hAlso at University of Texas at Dallas, Richardson, Texas 75083, USA i Also at Istanbul Arel University, 34295 Istanbul, Turkey
(Dated: November 10, 2015)
Using 2.92 fb−1 of electron-positron annihilation data collected at a center-of-mass energy of √
s= 3.773 GeV with the BESIII detector, we present an improved measurement of the branching fraction B(D+
→ ωe+νe) = (1.63 ± 0.11 ± 0.08) × 10−3. The parameters defining the corresponding hadronic form factor ratios at zero momentum transfer are determined for the first time; we measure them to be rV = 1.24±0.09±0.06 and r2= 1.06±0.15±0.05. The first and second uncertainties are
statistical and systematic, respectively. We also search for the decay D+
→ φe+νe. An improved upper limit B(D+
→ φe+νe
) < 1.3 × 10⁻⁵is set at 90% confidence level. PACS numbers: 13.20.Fc,14.40.Lb
Charm semileptonic decays have been studied in detail because they provide essential inputs of the magnitudes of the Cabibbo-Kobayashi-Maskawa (CKM) elements |Vcd| and |Vcs| [1, 2], and a stringent test of the strong interaction effects in the decay amplitude. These effects of the strong interaction in the hadronic current are parameterized by form factors that are calculable, for example, by lattice QCD and QCD sum rules. The couplings |Vcs| and |Vcd| are tightly constrained by the unitarity of the CKM matrix. Therefore, measurements of charm semileptonic decay rates and form factors rig-orously test theoretical predictions. Both high-statistics and rare modes should be studied for a comprehensive understanding of charm semileptonic decays.
For D → V ℓν transitions (where V refers to a vector meson), the form factors have been studied in the decays D+ → K∗0e+νe [3] and D+ → ρ0e+νe [4]. The decay D+ → ωe+νe was first observed by the CLEO-c experi-ment, while the corresponding form factors have not yet been measured due to limited statistics [4]. The decay D+→ ωe+νecan proceed through the tree-level diagram shown in Fig. 1. Its transition rate depends on the charm-to-down-quark coupling |Vcd|, which is precisely known from unitarity of the CKM matrix. Neglecting the lepton mass, three dominant form factors contribute to the decay rate: two axial (A1,A2) and one vector (V ) form factor, which are functions of the square of the invariant mass of the lepton-neutrino system q2.
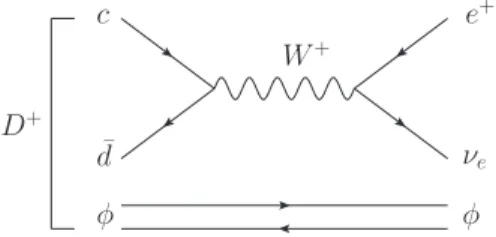
The decay D+ → φe+νe has not yet been observed. The most recent experimental search was performed by the CLEO Collaboration in 2011 with a sample of an in-tegrated luminosity of 818 pb−1collected at the ψ(3770) resonance. The upper limit of the decay rate was set to be 9.0×10⁻⁵at the 90% confidence level (C.L.) [5]. Since the valence quarks s¯s of the φ meson are distinct from those of the D meson (c ¯d), this process cannot occur in the absence of ω-φ mixing or a non-perturbative “weak annihilation” (WA) contribution as shown in Fig.2[6,7]. A measurement of the branching fraction can discrimi-nate which process is dominant. For example, a study of the ratio of D+
s → ωe+νeand D+s → φe+νe[6] concludes that any value of B(D+
s → ωe+νe) exceeding 2 × 10 −4 is unlikely to be attributed to ω-φ mixing, and would provide evidence for non-perturbative WA effects [7]. A search for the decay D+ → φe+νe is helpful, since its dynamics is similar to that of the decay D+
s → ωe+νe. In this paper, we report an improved measurement of B(D+ → ωe+νe) and the first form factor measurement in this decay. Furthermore, an improved upper limit for B(D+→ φe+νe) is determined. Charge conjugate states are implied throughout this paper. Those decays are studied using a data sample collected with the BESIII detector which corresponds to an integrated luminosity
c ¯ d d ¯ d W+ e+ νe ω D+
FIG. 1. Feynman diagram representing the tree-level charged current process D+ → ωe+νe. c ¯ d W+ e+ νe φ D+ φ
FIG. 2. Feynman diagram representing the WA process D+
→ φe+νe.
of 2.92 fb−1 at the ψ(3770) resonance [9].
The BESIII detector is a spectrometer located at BEPCII, which is a double-ring e+e− collider working at the center-of-mass energy range from 2 to 4.6 GeV. The cylindrical core of the BESIII detector consists of a helium-based multi-layer drift chamber (MDC), a plas-tic scintillator time-of-flight system (TOF), and a CsI (Tl) electromagnetic calorimeter (EMC), which are all enclosed in a superconducting solenoid magnet providing a 1.0 T magnetic field. The solenoid is supported by an octagonal flux-return yoke with modules of resistive plate muon counters interleaved with steel. The momentum resolution for charged particles at 1 GeV/c is 0.5%, and the resolution of the ionization energy loss per unit path-length (dE/dx) is 6%. The EMC measures photon energies with a resolution of 2.5% (5%) at 1 GeV in the barrel (end cap). The time resolution of the TOF is 80 ps in the barrel and 110 ps in the end cap. A detailed description of the BESIII detector is provided in Ref. [10]. The tagging technique for the branching fraction mea-surements of semileptonic decays was first employed by the Mark-III collaboration [11] and later applied in the studies by CLEO-c [4, 12]. The presence of a D+D− pair in an event allows a tag sample to be defined in which a D−
is reconstructed in one of the following six hadronic decay modes: K+π−
π− , K+π− π− π0, K0 Sπ − , K0 Sπ − π0, K0 Sπ+π − π− , and K+K− π− . A sub-sample is then defined in which a positron and a set of hadrons are required recoiling against the tag D meson, as a
signature of a semileptonic decay. The yields of tag and signal are expressed as Ni
tag = 2ND ¯DBitagǫitag and Ni
sig = 2ND ¯DBtagBi slǫitag,sl, respectively, where ND ¯D is the total number of D ¯D pairs produced, i indicates a tag mode, Ni
tagis the number of observed tag events in mode i, Ni
sig is the number of semileptonic candidates, Bi
tag is the branching fraction of tag mode i, Bsl is the branching fraction of the semileptonic decay, ǫi
tag is the reconstruction efficiency of a tag mode, and ǫi
tag,sl is the reconstruction efficiency of the semileptonic decay with a tag mode. Thus, Bsl can be expressed as
Bsl=
Nsig X
i
Ntagi ǫitag,sl/ǫitag
, (1)
where Nsig is the total signal yield in all six tag modes. Charged tracks are reconstructed using hit informa-tion from the MDC. The tracks are required to satisfy | cos θ| < 0.93, where θ is the polar angle with respect to the beam axis. Tracks (except for K0
S daughters) are required to originate from the interaction point (IP), i.e. their point of closest approach to the interaction point is required to be ±10 cm along the beam direction and 1 cm transverse to the beam direction. Charged particle identification (PID) is accomplished by combining the dE/dx and TOF information to form a likelihood Li (i = e/π/K) for each particle hypothesis. A K±
(π± ) candidate is required to satisfy LK > Lπ (Lπ > LK). For electrons, we require the track candidate to satisfy
Le
Le+Lπ+LK > 0.8 as well as E/p ∈ [0.8, 1.2], where E/p
is the ratio of the energy deposited in the EMC to the momentum of the track measured in the MDC. In order to take into account the effect of final state radiation and bremsstrahlung, the energy of neutral clusters within 5◦ of the initial electron direction is assigned to the electron track. The K0
S candidates are reconstructed from pairs of oppositely charged tracks, which are assumed to be pions and required to have an invariant mass in the range mπ+π− ∈ [0.487, 0.511] GeV/c2. For each pair of tracks,
a vertex-constrained fit is performed to ensure that they come from a common vertex.
To identify photon candidates, showers must have min-imum energies of 25 MeV in the barrel region (| cos θ| < 0.80) or 50 MeV in the end cap region (0.86 < | cos θ| < 0.92). To exclude showers from charged particles, a photon candidate must be separated by at least 20◦from any charged track with respect to the IP. A requirement on the EMC timing suppresses electronic noise and en-ergy deposits unrelated to the event. The π0 candidates are reconstructed from pairs of photon candidates by requiring the invariant di-photon mass to fulfill mγγ ∈ [0.115, 0.150] GeV/c2. Candidates with both photons coming from the end cap region are rejected due to poor resolution.
The D−
tag candidates are selected based on two variables: ∆E ≡ ED − Ebeam, the difference between the energy of the D− tag candidate (ED) and the
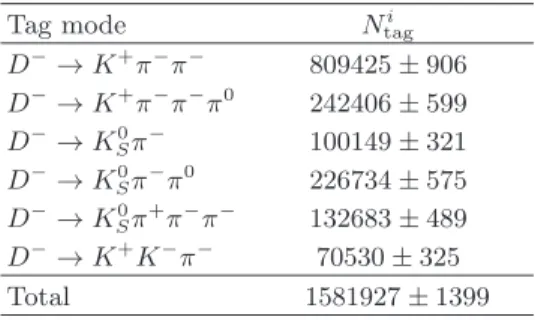
TABLE I. Tag yields of the D−six hadronic modes and their statistical uncertainties. Tag mode Ni tag D−→ K+π−π− 809425 ± 906 D−→ K+π−π−π0 242406 ± 599 D−→ K0 Sπ− 100149 ± 321 D−→ K0Sπ−π0 226734 ± 575 D−→ K0 Sπ+π−π− 132683 ± 489 D−→ K+K−π− 70530 ± 325 Total 1581927 ± 1399
beam energy (Ebeam), and the beam-constrained mass Mbc≡pE2
beam/c4− |~pD|2/c2, where ~pDis the measured momentum of the D−
candidate. In each event, we accept at most one candidate per tag mode per charge, and the candidate with the smallest |∆E| is chosen. The yield of each tag mode is obtained from fits to the Mbc distributions [13]. The data sample comprises about 1.6 × 10⁶reconstructed charged tag candidates (TableI).
Once a D−
tag candidate is identified, we search for an e+ candidate and an ω → π+π−
π0 candidate or a φ → K+K−
candidate recoiling against the tag. If there are multiple ω candidates in an event, only one combination is chosen based on the proximity of the π+π−
π0 invariant mass to the nominal ω mass [14]. The invariant mass mπ+π−π0 ∈ [0.700, 0.840] GeV/c2
and mK+K− ∈ [1.005, 1.040] GeV/c2 are required for
ω and φ candidates, which correspond to three times of the ω (φ) mass resolution (±3σ), respectively. For the decay D+ → ωe+νe, backgrounds arise mostly from D+ → K∗0e+νe, K∗0 → K0
Sπ0, KS0 → π+π −
process, and the invariant mass of the charged pions is required to be outside the aforementioned K0
S mass region. This requirement rejects about 70% of the D+ → K∗0e+νe background events.
After tag and semileptonic candidates have been com-bined, all charged tracks in an event must be accounted for. The total energy of additional photon candidates, besides those used in the tag and semileptonic candi-dates, is required to be less than 0.250 GeV. Semileptonic decays are identified using the variable U ≡ Emiss − c|~pmiss|, where Emiss and ~pmiss are the missing energy and momentum corresponding to the undetected neu-trino from the D+ meson semileptonic decay, which are calculated by Emiss ≡ Ebeam − Eω(φ) − Ee, ~pmiss ≡ −(~ptag+ ~pω(φ)+ ~pe) in the center-of-mass frame, where Eω(φ)(Ee) and ~pω(φ) (~pe) are the energy and momentum of the hadron (electron) candidate. To obtain a better U resolution, the momentum of the tag D− candidate ~ptag is calculated by ~ptag = bptag[(Ebeam/c)2− M2
Dc2]1/2 [15], where bptag is the unit vector in the direction of the tag D−
momentum, and MDis the world average value of D meson mass [14]. The correctly reconstructed semilep-tonic candidates are expected to peak around zero in the U distribution. A geant4-based [16] Monte Carlo (MC)
TABLE II. Tag efficiencies (ǫtag) and signal efficiencies in-cluding a tag (ǫtag,sl) in percent, as determined by the MC simulation, and their statistical uncertainties.
Tag mode ǫtag ǫtag,sl (ω) ǫtag,sl (φ) D−→ K+π−π− 51.07 ± 0.02 11.22 ± 0.10 9.04 ± 0.09 D−→ K+π−π−π0 25.13 ± 0.02 5.15 ± 0.09 4.38 ± 0.08 D−→ K0 Sπ− 54.40 ± 0.05 11.70 ± 0.32 9.69 ± 0.29 D−→ K0Sπ−π0 29.24 ± 0.02 6.13 ± 0.11 5.34 ± 0.10 D−→ K0Sπ+π−π− 37.61 ± 0.04 7.28 ± 0.18 5.96 ± 0.16 D−→ K+K−π− 41.12 ± 0.06 8.97 ± 0.29 7.63 ± 0.27
simulation is employed, and events are generated with kkmc+evtgen [17, 18] to determine the efficiencies in Eq. (1), as shown in Table II. All selection criteria and signal regions are defined using simulated events only.
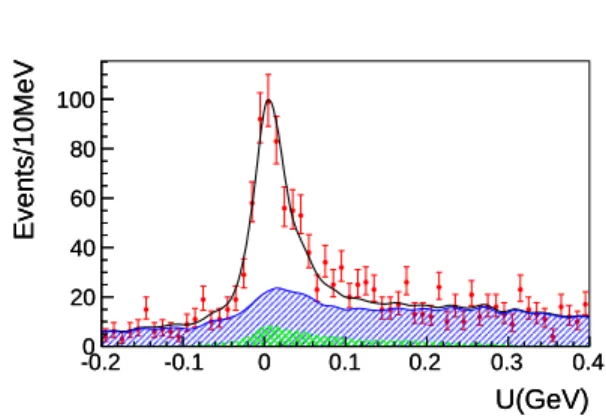
The yield of the decay D+ → ωe+νeis obtained from a fit to the U distribution combining all tag modes, as shown in Fig. 3. The signal shape is described by the shape from the signal MC simulation convoluted with a Gaussian function whose width is left free in the fit to describe the resolution difference between MC and data. The background model consists of two components: peaking and non-peaking backgrounds. Peaking back-ground arises mostly from the decay D+ → K∗0e+νe, K∗0→ K0
Sπ0, KS0→ π+π −
; its U distribution is modeled with MC simulation. The largest contribution to the non-peaking backgrounds is from the D ¯D process, while the remaining background events are from the non-D ¯D, q ¯q, τ+τ−, initial state radiation γJ/ψ and γψ(2S) processes. The non-peaking component is modeled with a smooth shape obtained from MC simulations. In the fit to data, the yield of the peaking background is fixed to the MC expectation, while that of the non-peaking background is left free in the fit. The signal yield is determined by the fit to be Nsig = 491 ± 32. The absolute branching fraction of the decay D+ → ωe+νe as listed in Table III is obtained using Eq. (1).
The U distribution for the decay D+→ φe+νewith all tag modes combined is shown in Fig.4. The signal region is defined as [−0.05, 0.07] GeV, which covers more than 97% of all signal events according to MC simulations. No significant excess of signal events is observed, and there are only 2 events in the signal region. A simulation study indicates that the backgrounds arise mostly from D+→ φπ+π0and D+→ φπ+ processes. The number of background events is estimated to be 4.2 ± 1.5 via large statistics MC samples. The upper limit is calculated by using a frequentist method with unbounded profile likelihood treatment of systematic uncertainties, which is implemented by a C++ class TROLKE in the ROOT framework[19]. The number of the observed events is assumed to follow a Poisson distribution, and the number of background events and the efficiency are assumed to follow Gaussian distributions. The resulting upper limit on B(D+ → φe+νe) at 90% C.L. is determined to be
U(GeV) -0.2 -0.1 0 0.1 0.2 0.3 0.4 Events/10MeV 0 20 40 60 80 100 U(GeV) -0.2 -0.1 0 0.1 0.2 0.3 0.4 Events/10MeV 0 20 40 60 80 100
FIG. 3. Fit (solid line) to the U distribution in data (points with error bars) for the semileptonic decay D+
→ ωe+νe. The total background contribution is shown by the filled curve, while the peaking component is shown by the cross-hatched curve. U(GeV) -0.2 -0.1 0 0.1 0.2 0.3 0.4 Events/10MeV 0 1 2
FIG. 4. The U distribution for the semileptonic decay D+
→ φe+νein data (points with error bars) and signal MC simulation with arbitrary normalization (solid histograms). The arrows show the signal region.
1.3 × 10⁻⁵, as shown in TableIII.
With the double tag technique, the branching fraction measurements are insensitive to systematics from the tag side since these are mostly cancelled. For the signal side, the following sources of systematic uncertainty are taken into account, as summarized in Table IV. The uncer-tainties of tracking and K±
/π±
PID efficiencies are well studied by double tagging D ¯D hadronic decay events. The uncertainties in e± tracking and PID efficiency are estimated with radiative Bhabha events. The uncertainty due to the π0reconstruction efficiency is estimated with a control sample D0 → K−
π+π0 by the missing mass technique. The uncertainty due to imperfect knowledge of the semileptonic form factors is estimated by varying the form factors in the MC simulation according to the uncertainties on the measured form factor ratios in the decay D+ → ωe+νe as discussed below. For the decay D+ → φe+νe, the signal MC produces phase-space dis-tributed events, and therefore uses a constant form fac-tor. To evaluate the corresponding systematics, the form
TABLE III. Measured branching fractions in this paper and a comparison to the previous measurements [4, 5]. For the D+
→ ωe+νe decay, the first uncertainty is statistical and the second systematic.
Mode This work Previous
ωe+ν
e (1.63 ± 0.11 ± 0.08) × 10−3 (1.82 ± 0.18 ± 0.07) × 10−3 φe+νe <1.3 × 10⁻⁵(90%C.L.) <9.0 × 10⁻⁵(90%C.L.)
factor is varied by a reweighting technique [8]. The world average values of B(ω → π+π−
π0) and B(φ → K+K− ) are (89.2±0.7)% and (48.9±0.5)%, respectively, and their uncertainties are assigned as systematic uncertainties due to the input branching fractions in the MC simulation. The limited MC statistics also leads to a systematic uncertainty. The uncertainties associated with the ω and φ mass requirements are estimated using the control samples D0 → ωK−
π+ and D+ → φπ+, respectively. The K0
S rejection leads to an uncertainty on the signal efficiency of the decay D+→ ωe+νe, which is studied by the control sample D0→ ωK−π+. The uncertainty due to the extra shower veto is studied with double hadronic tags. For the decay D+ → φe+νe, the uncertainty due to the signal window requirement as shown in Fig. 4 is estimated by the control sample D+→ K∗0e+νe, K∗0→
K−
π+. In the fit to the U distribution in the D+ → ωe+νedecay, the uncertainty due to the parametrisation of the signal shape is estimated by varying the signal shape to a Crystal Ball function [20]. The uncertainty due to the fit range is estimated by varying the fit range. The uncertainty due to the non-peaking background is estimated by modeling this component with a third-order Chebychev function, and the uncertainty associated with the fixed peaking background normalization is estimated by varying it within its expected uncertainty. All of those estimates are added in quadrature to obtain the total systematic uncertainties on the branching fractions.
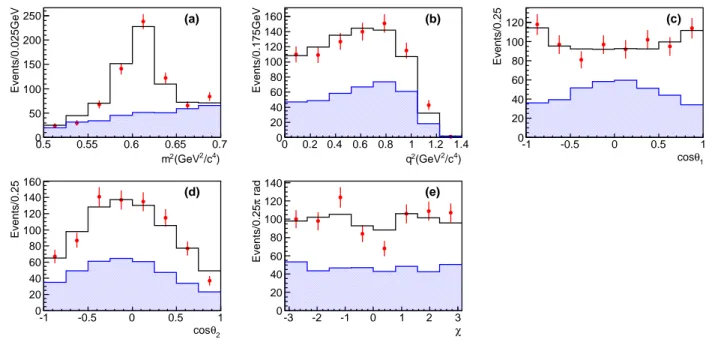
The differential decay rate of D+→ ωe+νecan be ex-pressed in the following variables as illustrated in Fig.5: m2, the mass square of the πππ system; q2, the mass square of the eνe system; θ1, the ω helicity angle [21], which is the angle between the ω decay plane normal (bn) in the πππ rest frame and the direction of flight of the ω in the D rest frame; θ2, the helicity angle of e, which is the angle between the charged lepton three-momentum in the eνe rest frame and the direction of flight of the eνesystem in the D rest frame; χ, the angle between the decay planes of those two systems.
For the differential partial decay width, only the P -wave component is taken into consideration and the formalism expressed in terms of three helicity amplitudes H+(q2), H−(q2), and H0(q2) is [4,22,23]: dΓ dq2d cos θ1d cos θ2dχdmπππ = 3 8(4π)4G 2 F|Vcd|2 pωq2 M2 D B(ω → πππ)|BW(mπππ)|2 [(1 + cos θ2)2sin2θ1|H+(q2, mπππ)|2
+ (1 − cos θ2)2sin2θ1|H−(q2, mπππ)|2+ 4 sin2θ2cos2θ1|H0(q2, mπππ)|2 + 4 sin θ2(1 + cos θ2) sin θ1cos θ1cos χH+(q2, mπππ)H0(q2, mπππ) − 4 sin θ2(1 − cos θ2) sin θ1cos θ1cos χH−(q2, mπππ)H0(q2, mπππ) − 2 sin2θ2sin2θ1cos 2χH+(q2, mπππ)H−(q2, mπππ)].
(2)
where GF is the Fermi constant, pωis the momentum of the ω in the D rest frame, B(ω → πππ) is the branching fraction of ω → πππ, mπππ is the invariant mass of the three pions, and BW(mπππ) is the Breit-Wigner function that describes the ω line shape. The helicity amplitudes can in turn be related to the two axial-vector form factors A1,2(q2) and the vector form factor V (q2):
H±(q2) =M A1(q2) ∓ 2MDpωM V (q2) H0(q2) = 1 2mπππpq2[(M 2 D− m2πππ− q2)M A1(q2) − 4M 2 Dp2ω M A2(q 2)] (3)
where M = MD+ mπππ. For the q2dependence, a single
pole parameterization [24] is applied: V (q2) = V (0) 1 − q2/m2 V , A1,2(q2) = A1,2(0) 1 − q2/m2 A , (4) where the pole masses mV and mA are expected to be close to MD∗(1−) = 2.01 GeV/c2 and MD∗(1+) =
2.42 GeV/c2 [14] for the vector and axial form factors, respectively. The ratios of these form factors, evaluated at q2 = 0, rV = V (0)
A1(0) and r2 =
A2(0)
A1(0), are measured in
this paper.
According to the fit procedure introduced in Ref. [3], a five-dimensional maximum likelihood fit is performed in the space of m2, q2, cos θ1, cos θ2 and χ. The signal probability density function is modeled with the phase-space signal MC events reweighted with the decay rate (Eq. 2) in an iterative procedure. The experimental
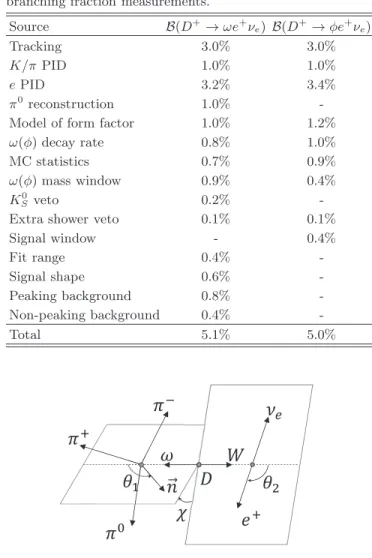
TABLE IV. Summary of systematic uncertainties on the branching fraction measurements.
Source B(D+ → ωe+νe) B(D+ → φe+νe) Tracking 3.0% 3.0% K/π PID 1.0% 1.0% ePID 3.2% 3.4% π0reconstruction 1.0%
-Model of form factor 1.0% 1.2%
ω(φ) decay rate 0.8% 1.0%
MC statistics 0.7% 0.9%
ω(φ) mass window 0.9% 0.4%
K0
Sveto 0.2%
-Extra shower veto 0.1% 0.1%
Signal window - 0.4% Fit range 0.4% -Signal shape 0.6% -Peaking background 0.8% -Non-peaking background 0.4% -Total 5.1% 5.0%
ߨ
ߨ
ାߨ
ିߠ
ଵߠ
ଶ߯
݊ ܦ
߱
ܹ
݁
ାߥ
FIG. 5. Definitions of the helicity angles in the decay D+ → ωW+, ω → π+
π−π0, W+ → e+νe for the three-body (θ1) and two-body (θ2) D+-daughter decays, where both angles are defined in the rest-frame of the decaying meson.
acceptance is taken in consideration using this technique. Large signal MC samples are generated to reduce the systematic uncertainty associated with the MC statistics. The background is modeled with the MC simulation and its normalization is fixed to the expectation. Using simulated events with known rV and rA, we verify that this procedure can reliably determine the form factor ratios. Figure 6 shows the m2, q2, cos θ1, cos θ2 and χ projections from the final fit to data. The fit determines the form factor ratios to be rV = 1.24 ± 0.09 and r2= 1.06 ± 0.15.
For the form factor measurement in the decay D+ → ωe+νe, the following sources of systematic uncertainties are taken into account, as summarized in Table V: The uncertainty associated with the unknown q2dependence of the form factors is estimated by introducing a double pole parameterization [25]. The uncertainty due to the
TABLE V. Summary of the absolute systematic uncertainties in the form factor measurement of the decay D+
→ ωe+νe.
Sources rV r2
q2dependence 0.05 0.03 Background model 0.02 0.02 Pole mass assumption 0.01 negligible Fitting shift 0.02 0.02
Total 0.06 0.05
background model is estimated by varying the back-ground normalization with its statistical uncertainty. No events from the non-resonant decay D+→ π+π−
π0e+νe are observed, the influence of this decay on the form factor therefore can be neglected. To estimate the un-certainty associated with the pole mass assumption, we vary the pole mass mV by ±100 MeV/c2. A small shift is observed with the presence of background, and this is treated as possible bias in the form factor fit-ting procedure. Adding all systematic uncertainties in quadrature, the form factor ratios are determined to be rV = 1.24 ± 0.09 ± 0.06 and r2 = 1.06 ± 0.15 ± 0.05, respectively.
In summary, using 2.92 fb−1of e+e−annihilation data collected at √s = 3.773 GeV with the BESIII detector, we have measured the form factor ratios in the decay D+ → ωe+νeat q2= 0 for the first time: rV = V (0)
A1(0) =
1.24 ± 0.09 ± 0.06, r2 = A2(0)
A1(0) = 1.06 ± 0.15 ± 0.05,
and determined the branching fraction to be B(D+ → ωe+νe) = (1.63 ± 0.11 ± 0.08) × 10−3, where the first and the second uncertainties are statistical and systematic, respectively. This is the most precise measurement to date. We have also searched for the rare decay D+ → φe+νeand observe no significant signal. We set an upper limit of B(D+ → φe+νe) < 1.3 × 10⁻⁵ at the 90% C.L., which improves the upper limit previously obtained by the CLEO Collaboration [5] by a factor of about 7.
The BESIII collaboration thanks the staff of BEPCII and the IHEP computing center for their strong sup-port. This work is supported in part by National Key Basic Research Program of China under Contract Nos. 2009CB825204, 2015CB856700; National Natu-ral Science Foundation of China (NSFC) under Con-tracts Nos. 10935007, 11125525, 11235011, 11322544, 11335008, 11425524; the Chinese Academy of Sci-ences (CAS) Large-Scale Scientific Facility Program; the CAS Center for Excellence in Particle Physics (CCEPP); the Collaborative Innovation Center for Par-ticles and Interactions (CICPI); Joint Large-Scale Sci-entific Facility Funds of the NSFC and CAS un-der Contracts Nos. 11179007, 11179014, U1232201, U1332201; CAS under Contracts Nos. KJCX2-YW-N29, KJCX2-YW-N45; 100 Talents Program of CAS; National 1000 Talents Program of China; INPAC and Shanghai Key Laboratory for Particle Physics and Cos-mology; German Research Foundation DFG under
Con-) 4 /c 2 (GeV 2 m 0.5 0.55 0.6 0.65 0.7 Events/0.025GeV 0 50 100 150 200 250 (a) ) 4 /c 2 (GeV 2 q 0 0.2 0.4 0.6 0.8 1 1.2 1.4 Events/0.175GeV 0 20 40 60 80 100 120 140 160 (b) 1 θ cos -1 -0.5 0 0.5 1 Events/0.25 0 20 40 60 80 100 120 (c) 2 θ cos -1 -0.5 0 0.5 1 Events/0.25 0 20 40 60 80 100 120 140 160 (d) χ -3 -2 -1 0 1 2 3 rad π Events/0.25 0 20 40 60 80 100 120 140 (e)
FIG. 6. Projections of the data set (points with error bars), the fit results (solid histograms) and the sum of the background distributions (filled histogram curves) onto (a) m2, (b) q2, (c) cos θ1, (d) cos θ2 and (e) χ.
tract No. Collaborative Research Center CRC-1044; Istituto Nazionale di Fisica Nucleare, Italy; Ministry of Development of Turkey under Contract No. DPT2006K-120470; Russian Foundation for Basic Research un-der Contract No. 14-07-91152; The Swedish Resarch Council; U.S. Department of Energy under Contracts Nos. FG02-04ER41291, FG02-05ER41374,
DE-FG02-94ER40823, DESC0010118; U.S. National Sci-ence Foundation; University of Groningen (RuG) and the Helmholtzzentrum fuer Schwerionenforschung GmbH (GSI), Darmstadt; WCU Program of National Research Foundation of Korea under Contract No. R32-2008-000-10155-0.
[1] N. Cabibbo, Phys. Rev. Lett. 10, 531 (1963).
[2] M. Kobayashi and T. Maskawa, Prog. Theor. Phys. 49, 652 (1973).
[3] P. del Amo Sanchez et al. [BaBar Collaboration], Phys. Rev. D 83, 072001 (2011).
[4] S. Dobbs et al. [CLEO Collaboration], Phys. Rev. Lett. 110, 131802 (2013).
[5] J. Yelton et al. [CLEO Collaboration], Phys. Rev. D 84, 032001 (2011).
[6] M. Gronau and J. L. Rosner, Phys. Rev. D 79, 074006 (2009).
[7] I. I. Bigi and N. G. Uraltsev, Nucl. Phys. B 423, 33 (1994); H. Y. Cheng, Eur. Phys. J. C 26, 551 (2003). [8] L. Martin et al. [CLEO Collaboration], Phys. Rev. D 84,
012005 (2011).
[9] M. Ablikim et al. [BESIII Collaboration], Chin. Phys. C 37, 123001 (2013).
[10] M. Ablikim et al. [BESIII Collaboration], Nucl. Instrum. Meth. A 614, 345 (2010).
[11] J. Adler et al. [MARK-III Collaboration], Phys. Rev. Lett. 62, 1821 (1989).
[12] G. S. Huang et al. [CLEO Collaboration], Phys. Rev. Lett. 95, 181801 (2005).
[13] M. Ablikim et al. [BESIII Collaboration], Phys. Rev. D
89, 051104 (2014).
[14] K.A. Olive et al. [Particle Data Group], Chin. Phys. C, 38, 090001 (2014).
[15] T. E. Coan et al. [CLEO Collaboration], Phys. Rev. Lett. 95, 181802 (2005).
[16] S. Agostinelli et al. [GEANT4 Collaboration], Nucl. In-strum. Meth. A 506, 250 (2003).
[17] S. Jadach, B. F. L. Ward and Z. Was, Comp. Phys. Commu. 130, 260 (2000); S. Jadach, B. F. L. Ward and Z. Was, Phys. Rev. D 63, 113009 (2001).
[18] D. J. Lange, Nucl. Instrum. Meth. A 462,152 (2001). [19] W. A. Rolke, A. M. Lopez and J. Conrad, Nucl. Instrum.
Meth. A 551, 493 (2005).
[20] J. Gaiser. Ph.D. thesis, Stanford University Report No. SLAC-255, 1982; T. Skwarnicki, Ph.D. thesis, Jagiel-lonian University in Krakow DESY Report No. F31-86-02, 1986.
[21] S. M. Berman and M. Jacob, Phys. Rev. 139, B1023 (1965).
[22] J. G. Korner and G. A. Schuler, Z. Phys. C 46, 93 (1990). [23] F. J. Gilman and R. L. Singleton, Phys. Rev. D 41, 142
(1990).
[24] J. D. Richman and P. R. Burchat, Rev. Mod. Phys. 67, 893 (1995).
[25] S. Fajfer and J. F. Kamenik, Phys. Rev. D 72, 034029 (2005).
![TABLE III. Measured branching fractions in this paper and a comparison to the previous measurements [ 4 , 5 ]](https://thumb-eu.123doks.com/thumbv2/9libnet/4057840.57491/6.918.82.444.158.218/table-measured-branching-fractions-paper-comparison-previous-measurements.webp)