Target-Independent Prediction of Drug Synergies Using Only Drug
Lipophilicity
Kaan Yilancioglu,
†,○,◆Zohar B. Weinstein,
‡,◆Cem Meydan,
†,§Azat Akhmetov,
†,∥Isil Toprak,
⊥Arda Durmaz,
†Ivan Iossifov,
#Hilal Kazan,
▼Frederick P. Roth,
△,□,⬡,¶and Murat Cokol*
,†,▽†Faculty of Engineering and Natural Sciences, Biological Sciences and Bioengineering Program,⊥Faculty of Engineering and Natural
Sciences, Computer Science and Engineering Program, and▽Nanotechnology Research and Application Center, Sabanci University, Istanbul 34956, Turkey
○Biomedical Equipment Technology Program, Uskudar University, 34662, Uskudar, Istanbul, Turkey ‡Boston University School of Medicine, Boston, Massachusetts 02118, United States
§Institute for Computational Biomedicine, Weill Cornell Medical College, New York, New York 10065, United States ∥Institute for Cellular and Molecular Biology, University of Texas at Austin, Austin, Texas 78712, United States #Cold Spring Harbor Laboratory, Cold Spring Harbor, New York 11724, United States
▼Faculty of Engineering, Department of Computer Engineering, Antalya International University, Antalya 07190, Turkey
△Donnelly Centre and⬡Departments of Molecular Genetics and Computer Science, University of Toronto, Toronto, Ontario M5S
3E1, Canada
□Lunenfeld-Tanenbaum Research Institute, Mt. Sinai Hospital, Toronto, Ontario M5G 1X5, Canada
¶Center for Cancer Systems Biology, Dana-Farber Cancer Institute, One Jimmy Fund Way, Boston, Massachusetts 02215, United
States
*
S Supporting InformationABSTRACT: Physicochemical properties of compounds have been instrumental in selecting lead compounds with increased drug-likeness. However, the relationship between physicochemical properties of constituent drugs and the tendency to exhibit drug interaction has not been systematically studied. We assembled physicochemical descriptors for a set of antifungal compounds (“drugs”) previously examined for interaction. Analyzing the relationship between molecular weight, lipophilicity, H-bond donor, and H-bond acceptor values for drugs and their propensity to show pairwise antifungal drug synergy, we found that combinations of two lipophilic drugs had a greater tendency to show drug synergy. We developed a more refined decision tree model that successfully predicted drug synergy in stringent cross-validation tests based on only lipophilicity of drugs. Our predictions achieved a precision of 63% and allowed successful prediction for 58% of synergistic drug pairs, suggesting that this phenomenon can extend our understanding for a substantial fraction of synergistic drug interactions. We also generated and analyzed a large-scale synergistic human toxicity network, in which we observed that combinations of
lipophilic compounds show a tendency for increased toxicity. Thus, lipophilicity, a simple and easily determined molecular descriptor, is a powerful predictor of drug synergy. It is well established that lipophilic compounds (i) are promiscuous, having many targets in the cell, and (ii) often penetrate into the cell via the cellular membrane by passive diffusion. We discuss the positive relationship between drug lipophilicity and drug synergy in the context of potential drug synergy mechanisms.
■
INTRODUCTIONSome drug pairs elicit a phenotype that is significantly greater than expected, a phenomenon called drug synergy.1Synergistic drug combinations are of high medical interest, because they allow increased efficacy at lower dosage.2 As the number of possible drug combinations is astronomical, prediction methods can help expedite the search for synergistic drug combinations. Several studies have been successful in predicting drug synergy; however, these methods often require costly (chemogenomic profiling,3 microarray analysis,4 binding assays5), subjective
(drug targets,6 drug indications,7 drug side effects7), or incomplete (genetic interactions,6,8 protein interactions9) input data sets.
There have been many studies aimed at predicting biological activities of chemicals10,11 often via application of quantitative structure−activity relationship modeling.12,13Toward this goal, Lipinski’s “Rule of Five” is perhaps the most well-known guide Received: May 8, 2014
Published: July 15, 2014
Article
pubs.acs.org/jcim
to identifying chemicals with desirable pharmacokinetic proper-ties.14 According to this rule, drug-like molecules have characteristic physicochemical properties: molecular weight less than 500 Da, octanol-partition coefficient (LogP) less than 5, H-bond donors less than 5, and H-bond acceptors less than 10.15Since its inception in the 1990s, the application of this rule and its extensions have been widely used to narrow investigational focus on compounds.16,17
A particularly attractive feature of the Lipinski’s rule is that the relevant physicochemical properties are simple and readily obtained. The molecular structure information on a drug readily yields its molecular weight, H-bond donor and H-bond acceptor values. The determination of the LogP of a compound requires only simple experimental measurement of the relative solubility of a compound in octanol versus water.18 A high LogP indicates a preference toward hydrophobic interactions, which is interpreted as lipophilicity.19Moreover, LogP may be accurately estimated by many established methods.20 For example, the structure-derived estimate termed XLogP3 is almost perfectly correlated with experimentally determined LogP values.21 XLogP3 values for compounds are publicly available in the PubChem database.22
While the relationship between physicochemical properties and drug-likeness has been extensively studied, it has not yet been explored to predict drug interactions. Here, we examined the relationship between drug physicochemical properties and pairwise drug interactions. We analyzed two drug interaction networks, one experimentally generated for yeast (31 nodes, 165 edges) and one literature-curated for humans (428 nodes, 919 edges). We observed that in both yeast and human, combinations of lipophilic compounds frequently result in synergistic drug interactions. These results uncover a novel phenomenon that may explain a large proportion of synergistic drug interactions.
■
RESULTSDrug Lipophilicity and Antifungal Drug Synergy Are Related. We analyzed experimental data measuring synergy of antifungal (antimycotic) compounds for 175 drug pairs
(Supplementary Table 1) among 33 drugs (Supplementary Table 2).6The drugs and pairs in this screen were selected on the basis of antifungal activity, having known targets, and in some cases based on the presence of genetic interactions among drug targets. They were not selected on the basis of physicochemical properties. For each of these drugs, we extracted the four physicochemical properties associated with Lipinski’s Rule of Five from PubChem. These properties were (1) molecular weight (MW), (2) lipophilicity (XLogP3),21(3) H-bond donor (H-don), and (4) H-bond acceptor (H-acc). Lithium and cisplatin did not have reported XLogP3 scores and were not considered further, bringing the total number of tested drug pairs to 165. Among the remaining 31 drugs, we observed a large range for each of these properties: MW ranged from 42−1101 Da; XLogP3 from −6.6−8.5; H-don from 0− 14; and H-acc from 1−18.
As there are (31/2) = 465 possible pairings of 31 drugs, 165 tests represent 35% of the drug pair space. Some drugs were more heavily tested. For example, 45% of the entire data set involved 6 drugs that had each been tested against more than 20 drugs. Of these 165 tested pairs, 48 were reported as synergistic6 (see Methods). For each of the 31 drugs, we computed “synergicity” defined by the fraction of tested partners exhibiting synergy. Drug synergicities covered a wide-range between 0 and 60%, in accordance with previous observations that some drugs are more likely to exhibit drug synergy.6,23
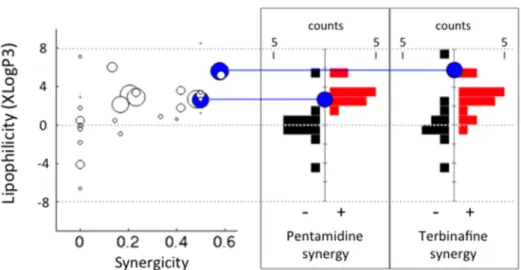
Next, we compared the synergicity of drugs with their MW, XLogP3, H-don, and H-acc values (Supplementary Figure 1). We found a significant correlation between synergicity and XLogP3 (Spearman r = 0.51, p = 3.6× 10⁻³; Figure 1 left). This relationship is strengthened among drugs that are tested against more thanfive partners (Spearman r = 0.68, p = 3.7 × 10⁻⁴). This observation suggested that drugs that have a higher lipophilicity are more likely to show synergy. In contrast, MW, H-don, and H-acc did not show any significant correlation with synergicity for either the entire drug set or among drugs that are tested against more thanfive partners.
Figure 1.Drug lipophilicity and drug synergy are related in yeast. (left) Each circle represents one drug and the size of each circle corresponds to the number of drug synergy tests. The x-axis corresponds to the ratio of synergies the drug exhibited among all drugs it was tested against (synergicity). The y-axis corresponds to the lipophilicity (XLogP3) of each drug. There is a significant positive correlation between synergicity and lipophilicity (Spearman r = 0.51, p = 0.0036.). (right) Histograms of XLogP3 distribution for nonsynergistic (black histogram) and synergistic (red histogram) partner drugs of two heavily tested drugs with a high synergicity (Pentamidine and Terbinafine). Both drugs exhibited significantly more synergy with lipophilic drugs (Pentamidine p = 6.5× 10⁻⁴, Terbinafine p = 9.1 × 10⁻³, Mann−Whitney U-test).
Antifungal Drug Synergy Is More Common among Pairs of Lipophilic Drugs. We more closely examined six drugs (Benomyl, Latrunculin B, Pentamidine, Staurosporine, Tacrolimus, Terbinafine) that had been tested against more than 20 partners for drug synergy. Pentamidine exhibited a synergistic interaction with 12 drugs among 24 tests, making its synergicity 50% (Figure 1 left, lower blue disc). We found that the 12 drugs that exhibit synergy with Pentamidine have significantly higher XLogP3 values than the 12 drugs that did not exhibit synergy with Pentamidine (Figure 1 middle) (p = 6.5× 10⁻⁴, Mann−Whitney U-test). When we compared the XLogP3 values of compounds positive or negative for synergy with Terbinafine (15 and 11 cases, respectively), the same trend was observed (Figure 1 right) (p = 9.1× 10⁻³, Mann−Whitney U-test). Latrunculin B and Staurosporine also showed this trend; however, their p-values (p = 0.03, p = 0.02, respectively) fell short of significance after Bonferroni correction for six drugs.
We hypothesized that the relationship between drug lipophilicity and drug synergicity is not a simple result of one of the partner drug’s lipophilicity, but depends on the lipophilicity of both drugs in a drug pair. We generated a “yeast antifungal synergy network” to visualize both synergy and the lipophilicity of each drug (Figure 2). This network showed clearly that synergistic edges are more common among pairs of lipophilic drugs.
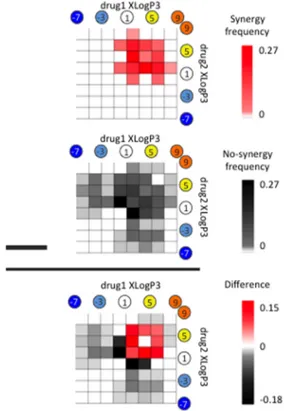
To explore this trend in greater detail, we binned drug pairs in two dimensions according to the XLogP3 of each drug and calculated the prevalence of synergy within each bin. The resulting two-variable probability mass function (pmf), shown in Figure 3 top, shows clearly that synergistic drug pairs are almost exclusively among lipophilic (XLogP3 > 0) drugs. An equivalent pmf was generated for the prevalence of nonsynergy (Figure 3, middle), showing that lack of synergy is more widely distributed among drugs with both low and high lipophilicity.
Examining the difference between the synergy and no-synergy pmf’s (Figure 2 bottom), we observed a clear pattern that when two drugs each have XLogP3 values higher than 1, they are more likely to be synergistic. In fact, a simple rule that “if two drugs have XLogP3 > 1, they will be synergistic” results in a statistically significant enrichment (p = 5.7 × 10⁻⁹, Fisher’s Exact Test) and fails to capture only six of 48 synergistic drug pairs. Moreover, we found that a generalized simple rule that states: “if two drugs both have lipophilicity higher than a threshold XLogP3, they will be synergistic” results in a classification accuracy with area under the ROC curve (AU-ROC) value of 0.74 and area under the Precision-Recall curve (AU-PR) value of 0.54 (Supplementary Figure 2). These observations strongly suggest that combinations of lipophilic antifungal compounds frequently exhibit synergistic toxicity to yeast. We note that there are many examples of lipophilic drug combinations that do not exhibit synergy. In other words, although the predictions are highly sensitive, they are not perfectly specific.
Lipophilicity of Drugs Is a Predictor of Antifungal Drug Synergy. Next, we carried out 5-fold cross validation (5-fold CV) to assess generalization performance of synergy predictions based on lipophilicity (see Methods). In terms of a graph representation, drug synergy is a commutative edge property, while drug pair lipophilicity is a noncommutative property of two nodes. Because lipophilicity is not a
Figure 2.Antifungal drug interaction network. Each node represents one of 31 tested chemicals with antifungal effect on S. cerevisiae growth. Nodes are colored, labeled, and ordered according to their XLogP3. The 48 red edges represent synergistic interactions and 117 black edges represent tested drug interactions with no synergy. Visual inspection of the network suggests a greater tendency for pairs of lipophilic compounds to have synergistic interactions.
Figure 3. Combinations of lipophilic antifungals are likely to be synergistic. (top and middle) The probability mass functions of synergistic or nonsynergistic edges are shown as a function of the XLogP3 of the drugs in a pair. Visual analysis suggests that synergistic interactions are mostly among antifungals with XLogP3 > 1, while nonsynergistic interactions are more distributed. (bottom) The difference of the top and middle probability mass functions is shown. Red or black-shaded regions represent the drug XLogP3 pairs with proportion of synergy or nonsynergy, respectively. The difference matrix suggests that antifungal pairs where both drugs have XLogP3 > 1 are more likely to be synergistic.
commutative feature, we considered all 330 ordered drug pairs. We then explored whether a decision tree model that uses only drug lipophilicity information could predict synergy in a 5-fold CV setting. We fit a decision tree using 80% of the data (training set) and predicted synergy for the remaining 20% (test set). We ensured that the two instances of the same drug pair are in the same fold to avoid a setting where the same drug pair appears both in training and test set. We repeated this 5-fold CV analysis 10 times and calculated average performance statistics. We found a striking performance with AU-ROC of 0.80 and AU-PR of 0.63. These values are both better than the predictive performance of the“generalized simple rule” that we investigated in the above analysis.
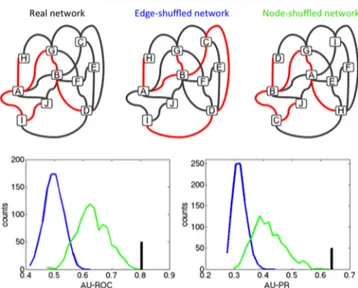
To assess the predictive performance of the decision tree model, we repeated our analysis with randomized drug synergy networks. We randomized the network in two ways: (i) permute the synergy/no synergy labels of the drug pairs (edge randomization); (ii) permute the XLogP3 values of the drugs (node randomization) (see Figure 4 top). The latter
random-ization preserves the network topology whereas the former does not. Since some drugs have high synergicity, we expected that the decision tree model trained with node randomized data will still have some predictive value, since the model is likely to learn that if a certain drug is frequently found in synergistic interactions in 80% of the data set, it will probably show synergy in the remaining 20% as well. We created 1000 random
networks for each type of randomization and performed 5-fold CV analysis 10 times for each network.
Finally, we compared the performance of the model learned from the real network to the performance of the models learned from random networks. Figure 4 bottom shows the distribution of the performance values. Expectedly, models trained with edge-randomized networks had poor predictive value for synergy, while models trained with node-randomized networks performed better. We found that the predictive performance of the original model (both ROC and AU-PR) is higher than the predictive performance of all the models learned from 1000 random networks. Therefore, the predictive performance of decision trees is significantly better when the real network is used as opposed to node-shuffled networks (p-value < 0.001). Because the only difference between node-shuffled networks and the real network is the lipophilicity of drugs, we conclude that lipophilicity of drugs is a predictor of antifungal drug synergy.
Human Toxicity of Drug Combinations Is Related to Lipophilicity. We next studied the relationship between lipophilicity and synergistic toxicity in humans. Hence we searched DrugBank for adverse drug interactions that are reported to increase toxicity in humans (see Methods), yielding 1038 “synergistic human toxicity drug pairs” (Supplementary Table 3). We were able to extract the XLogP3 value for both members of 919 synergistic human toxicity drug pairs, involving a total of 428 drugs (Supplementary Table 4). We visualized a “synergistic human toxicity network” combining drug lip-ophilicity and synergistic toxicity (Supplementary Figure 3). One important limitation of this network is that it only contains synergistic edges, in contrast to the yeast antifungal synergy network, which harbored both synergistic and nonsynergistic edges. By necessity, we defined unobserved edges in the human synergistic toxicity network as nonsynergistic. However, because we were unable to define a simple “synergicity” for drugs and compare with lipophilicity, we compared the lipophilicity of each node with its degree (number of synergistic partners). We observed a small, but significant correlation (Spearman r = 0.22, p = 3.5× 10⁻⁶). Although it is formally possible that this correlation is the result of investigational bias (e.g., if lipophilic compounds have been more extensively studied for toxic interactions), we know of no such bias. Thus, we interpret the correlation between lipophilicity and adverse toxic interactions as support for the idea that drug lipophilicity can predict synergistic toxicity in humans.
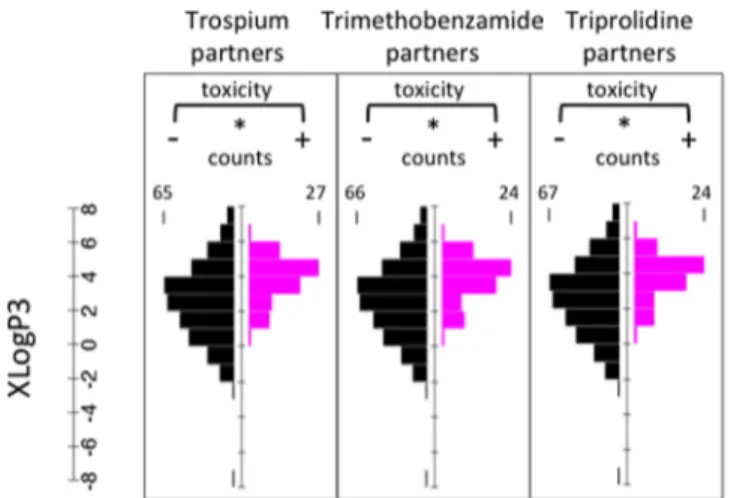
Three drugs in the synergistic human toxicity network (Trospium, Trimethobenzamide, Triprolidine) have increased toxicity in combination with more than 60 drugs. For each of these drugs, we compared the XLogP3 values of drugs that result in increased toxicity with the rest of the drugs, similar to the analysis presented in Figure 2 (Figure 5). We found that all three drugs show increased toxicity with lipophilic drugs (Trospium p = 2.3× 10⁻⁸, Trimethobenzamide p = 2.9× 10⁻⁷, Triprolidine p = 1.2× 10⁻⁶, Mann−Whitney U-test). Next, we compared the XLogP3 probability distributions for drug pairs with increased toxicity with the negative set (Figure 6), analogous to the analysis presented in Figure 3. We observed a striking similarity with the pattern we observed for yeast: Combinations of drugs with XLogP3 higher than 1 had a tendency to show increased toxicity (Fisher’s Exact Test, p = 5.2× 10⁻³⁴).
As a final check for the correspondence between drug lipophilicity and synergistic toxicity of a drug combination, we
Figure 4.Antifungal drug synergy can be predicted using only drug lipophilicity. (top) Representations for the drug interaction network randomizations we used. Each node represents one drug; red or black edges represent synergistic or nonsynergistic interactions, respectively. In the edge-shuffled network, known edges are shuffled, which can lead to swapping of synergistic/nonsynergistic edges, hence disrupting network topology. In the node-shuffled network, nodes are swapped; this leads to loss of lipophilicity information for drugs, but preserves the network topology. (bottom) Area under the ROC curve (AU-ROC) and area under the Precision-Recall curve (AU-PR) for a 5-fold cross validation for a decision tree model that used real network is given as black bars. Distribution of the AU-ROC and AU-PR curves in a 5-fold CV for 1000 edge-shuffled (blue) or node-shuffled (green) networks. While the node-shuffled networks have predictive power better than edge-shuffled networks, predictive power of the real network is higher than node-shuffled networks in all 1000 random-izations.
performed 5-fold cross-validation using decision tree models based on only drug lipophilicity. In the synergistic human
toxicity network, only 1% of the possible edges have reported increased toxicity in combination, with remaining 99% being unobserved. Using all the unobserved edges as the negative set would result in an extremely unbalanced data, which in turn would complicate the learning by the decision tree model. Instead, for each positive edge in our data set, we sampled three edges (similar to the ratio of positive/negative edges in the yeast antifungal synergy network) from the unobserved edges and defined these edges as negative. Fitting the decision tree model with this data, we were able to achieve an AU-ROC of 0.72 and AU-PR of 0.48. Similar to the analysis for the yeast network, we constructed 1000 random interaction networks by shuffling edges or nodes and conducted 5-fold cross-validation. We observed that edge-shuffled networks have no predictive value as AU-ROC values were approximately 0.5, but node shuffled networks had some predictive value, which is expected since some drugs are reported to show increased toxicity more frequently. However, the decision tree model that used the real data had a higher AU-ROC in all 1000 randomizations (p < 0.001) and higher AU-PR value in all but 6 randomizations (p = 0.006) (Supplementary Figure 4). Since the only difference between node-shuffled networks and the real network is the lipophilicity of drugs, we conclude that drug lipophilicity is a predictor of synergistic human toxicity of a drug combination.
■
DISCUSSIONHere we showed that combinations of lipophilic drugs often result in an increased phenotypic effect, as observed for antifungal synergy against yeast and reported adverse toxic drug interactions in humans. Knowledge of the lipophilicity of any compound is readily available, so that this phenomenon represents a powerful and cost-free method to prioritize potentially synergistic compound pairs. This property sets our methodology apart from previous synergy prediction methods, which require various costly data types often not available for most compounds.3,5,7
It has been previously established that lipophilic drugs are promiscuous, with many cellular targets.24 It has also been suggested that lipophilic drugs generally enter the cell via passive diffusion across the cell membrane rather than through protein transporters.25Given these properties, it is important to consider the enhanced efficacy we observe between lipophilic drug combinations in the context of previously proposed drug synergy models.26−28 According to the Parallel Pathway Inhibition Model for drug synergy, two drugs will be synergistic for a phenotype if they inhibit two parallel pathways that are required for that phenotype (e.g., growth).29,30This model uses the relationship between the cellular effects of individual drugs3,4,8,31 to predict drug synergy. As lipophilic drugs are more likely to have multiple targets (polypharmacology), they are likely to alter many pathways to varying degrees. As the number of inhibited pathways increases, the probability to inhibit a parallel pathway would be expected to increase, correspondingly increasing the synergicity of lipophilic compounds.
According to the Bioavailability Model for drug synergy, two drugs will be synergistic if one of the drugs increases the other’s availability to its cellular targets.26,27 Bioavailability can be enhanced by the alteration of drug transporters, modification of drug metabolism, or via permeabilization of the cell membrane. It has been previously observed that compounds that disrupt membrane integrity32are often promiscuously synergistic.23In accordance with the Bioavailability Model, the presence of a
Figure 5. Drug lipophilicity and increased toxicity of drug combinations in human are related. Histograms are shown for three drugs that were reported to result in increased toxicity when combined pairwise with more than 60 drugs. XLogP3 distribution of drugs that are reported or not to increase pairwise toxicity are shown as magenta or black histograms, respectively. Trospium, Trimethobenzamide, and Triprolidine are reported to exhibit pairwise toxicity significantly more with lipophilic drugs (Trospium p = 2.3× 10⁻⁸, Trimethobenzamide p = 2.9× 10⁻⁷, Triprolidine p = 1.2× 10⁻⁶, Mann−Whitney U-test).
Figure 6. Combinations of lipophilic drugs are more likely to be reported as increased toxic interactions in human. (top and middle) The probability mass function of increased or unknown toxicity edges are shown as a function of drug XLogP3. (bottom) The difference of the top and middle probability mass functions is shown. Magenta or black-shaded regions represent the drug pair XLogP3 regions with increased toxicity or not, respectively. The difference matrix suggests that drug pairs where both drugs have XLogP3 > 1 are more likely to have increased toxicity.
lipophilic compound may disrupt the integrity of the cell membrane, hence enhancing the access of the other drug to its targets (“synergistic membrane diffusion”). Another possible hypothesis is a“synergistic detergent effect” of drugs, whereby two drugs disrupt the integrity of the membrane more effectively in combination. While outside the scope of this study, these hypotheses can be evaluated by molecular dynamics studies and experiments with artificial membranes. Comparison of drug pairs differing in synergy, but similar in lipophilicity may provide starting points for future mechanistic analyses.
Better understanding of the mechanism of the relationship between lipophilicity and drug synergy could inform the treatment of diseases that require administration of multiple drugs, such as HIV and cancer. For example, highly lipophilic adjuvants are known to increase drug potency as with the chemotherapeutic cisplatin.33 However, our finding that combinations of lipophilic compounds often result in antifungal synergy may have immediate medical implications for treatment of infectious disease. For example, Pentamidine is one of the few treatment options for sulfa-resistant Pneumocystis jirovecii, an opportunistic yeast infection. In our analysis, we found that Pentamidine has a tendency to show antifungal synergy with lipophilic compounds, which suggests that lipophilic drugs should be prioritized for clinical trials of combinations involving Pentamidine. In clinical scenarios where treatment side effects may outweigh therapeutic benefits, the potential for enhanced toxicity in the patient should be carefully considered when combining lipophilic compounds.
■
METHODSYeast Antifungal Synergy Network. This data set is comprised of an experimental screen of 165 drug pairs, of which 48 were found to be synergistic6(Supplementary Table 1). Experimental variability was estimated by 25 experiments testing the“combination” of a drug with itself. S. cerevisiae cells were grown for 24 h in an 8× 8 grid of drug combinations, where the concentration of each drug was linearly increased along each axis. The lowest concentration for each drug was set at 0 and the highest concentration was chosen to be close to the minimum inhibitory concentration. Thus, for each drug pair, cell growth was measured under 64 different conditions: 49 different concentration combinations of the two drugs, 7 single-drug concentrations for each single-drug, and 1 condition with no drug. For each condition, a detailed time course of growth was obtained, with time points every 15 min for 24 h. Using this growth data, significant synergy was assessed according to the Loewe additivity model, where combinations of synergistic drug pairs are significantly more efficacious than the combination of a drug with itself. To assess confidence of growth measure-ments under individual drugs and drug combinations, 25“self− self combinations” (combinations of a drug with itself) were examined. The replicates had a very high correlation, indicating the reproducibility of growth measurements (r = 0.98, p < 10−10).
Synergistic Human Toxicity Network. This data set comprises of 1038 drug pairs that are reported in DrugBank.ca to have increased toxicity when combined (Supplementary Table 3). Of these 1038, 919 pairs among 428 compounds involved 2 drugs with known molecular weight and XLogP3. All drug interaction section data derived from Drugbank was manually identified as toxicity-related or not, in duplicate by
independent curators, until a consensus was reached. Network visualization was achieved with Cytoscape.34
Decision Tree Construction and Cross-Validation. We used Matlab’s ClassificationTree method to train decision trees, using default parameters: minimum node size of 10 and Gini’s diversity index criterion when choosing a split. We tried pruning the tree within the 5-fold CV framework by determining the optimal pruning level by nested cross validation. For each training set (i.e., defined by 5-fold CV), we used Matlab’s cvLoss method (with parameters subtrees = all, treesize = min) that considers 10-fold cross-validation performance to determine the optimal pruning level for the fitted decision tree, and predicted the held out interaction after pruning the tree. However, predictions of pruned tree resulted in decreased performance for both yeast and human data. Thus, we decided to keep the full tree when predicting drug synergy.
■
ASSOCIATED CONTENT*
S Supporting InformationSupplementary Figure 1: Relationship between synergicity and MW, XLogP3, H-don, or H-acc for each compound in the yeast drug interaction data set. Supplementary Figure 2: Statistical analysis of the simple rule “if two drugs have XLogP3 larger than t, they will be synergistic.” (A) The prediction results of this simple rule when t = 0. Synergistic and nonsynergistic drug pairs are shown with red and black dots, respectively. The XLogP3 values of drug pairs that show synergy are given as red dots below the diagonal. Similarly, XLogP3 values of drug pairs that do not show synergy are given as black dots above the diagonal. The area highlighted in green contains the drug pairs where both drugs have XLogP3 > 0 and, hence, is predicted to be synergistic. Similarly, the drug pairs that reside outside of this area are classified as nonsynergistic. (B) We conducted this analysis with threshold values varied from −8 to 8 with increments of 1. For each t, we first calculated several performance metrics such as TP, TN, FP, FN. Using these xlogpi specific values, we next computed the sensitivity (recall), specificity, and precision values for each xlogpi. Finally, we plotted ROC and PR curves and determined the area under each curve. Supplementary Figure 3: Synergistic human toxicity network. Nodes represent 428 drugs. Nodes are colored according to their XLogP3 values, using an identical color map with Figure 2. 919 magenta edges represent reports of increased toxicity in humans when two drugs are used together. Supplementary Figure 4: Distribution of the AU-ROC or AU-PR curves in a 5-fold cross validation using the synergistic human toxicity network (black) and 1000 edge-shuffled (blue) or node-shuffled (green) networks. Supplementary Table 1 (ci500276x_si_001.xlsx): Edge properties (antifungal synergy or no synergy) for 175 drug pairs. Supplementary Table 2 (ci500276x_si_002.xlsx): Node properties (molecular weight, lipophilicity, H-bond acceptor, and H-bond donor values) of the 33 drugs in Supplementary Table 1. Supplementary Table 3 (ci500276x_si_003.xlsx): 1038 drug pairs with synergistic human toxicity and associated sentences from DrugBank supporting interaction. Supplementary Table 4 (ci500276x_-si_004.xlsx): PubChem ID and XLogP3 values for the 428 drugs in Supplementary Table 3. This material is available free of charge via the Internet at http://pubs.acs.org.
■
AUTHOR INFORMATIONCorresponding Author
*Phone: +90 530 2820844. Fax: +90 216 4989550. E-mail: [email protected].
Author Contributions
K.Y., Z.B.W., and M.C. designed the study. K.Y., Z.B.W., C.M., A.A., I.T., A.D., I.I., H.K., F.P.R., and M.C. analyzed the data.. K.Y., Z.B.W., F.P.R., and M.C. wrote the paper.
Author Contributions
◆K.Y. and Z.B.W. contributed equally to this work.
Funding
F.P.R. was supported by NIH grants (HG001715 and HG004233), by the Krembil Foundation, the Avon Founda-tion, a Canadian Institute for Advanced Research Fellowship, and the Canada Excellence Research Chairs Program. M.C. was supported by the Turkish Academy of Sciences GEBIP Programme.
Notes
The authors declare no competingfinancial interest.
■
ACKNOWLEDGMENTSWe thank Albert Lazslo Barabasi, Anil Korkut, Timothy Mitchison, and Fatih Ozbay for insightful discussions on the manuscript and the following Sabanci University students for their help in curation of the DrugBank database: Ecem Agaoglu, Deniz Bayram, Dilay Cansever, Ogeday Celep, Neslihan Cevik, Melike Cokol, Peren Coskun, Aysegul Guvenek, Arda Inceoglu, Begum Kanat, Ozgun Kirker, Nirva Mumcuyan, Vedat Ozan, Zuhal Ozcan, Inanc Pastirmaci, Nil Sahin, Muge Segmen, Selim Senocak, Ebru Uysal, Oguzhan Yazgan, and Efe Yildirim.
■
REFERENCES(1) Greco, W. R.; Bravo, G.; Parsons, J. C. The Search for Synergy: a Critical Review From a Response Surface Perspective. Pharmacol. Rev. 1995, 47, 331−385.
(2) Chen, X.; Ren, B.; Chen, M.; Liu, M.-X.; Ren, W.; Wang, Q.-X.; Zhang, L.-X.; Yan, G.-Y. ASDCD: Antifungal Synergistic Drug Combination Database. PLoS One 2014, 9, e86499−e86499.
(3) Jansen, G.; Lee, A. Y.; Epp, E.; Fredette, A.; Surprenant, J.; Harcus, D.; Scott, M.; Tan, E.; Nishimura, T.; Whiteway, M.; Hallett, M.; Thomas, D. Y. Chemogenomic Profiling Predicts Antifungal Synergies. Mol. Syst. Biol. 2009, 5, 338.
(4) Nelander, S.; Wang, W.; Nilsson, B.; She, Q.-B.; Pratilas, C.; Rosen, N.; Gennemark, P.; Sander, C. Models From Experiments: Combinatorial Drug Perturbations of Cancer Cells. Mol. Syst. Biol. 2008, 4, 216.
(5) Gottlieb, A.; Stein, G. Y.; Oron, Y.; Ruppin, E.; Sharan, R. INDI: a Computational Framework for Inferring Drug Interactions and Their Associated Recommendations. Mol. Syst. Biol. 2012, 8, 592.
(6) Cokol, M.; Chua, H. N.; Tasan, M.; Mutlu, B.; Weinstein, Z. B.; Suzuki, Y.; Nergiz, M. E.; Costanzo, M.; Baryshnikova, A.; Giaever, G.; Nislow, C.; Myers, C. L.; Andrews, B. J.; Boone, C.; Roth, F. P. Systematic Exploration of Synergistic Drug Pairs. Mol. Syst. Biol. 2011, 7, 544.
(7) Zhao, X.-M.; Iskar, M.; Zeller, G.; Kuhn, M.; van Noort, V.; Bork, P. Prediction of Drug Combinations by Integrating Molecular and Pharmacological Data. PLoS Comput. Biol. 2011, 7, e1002323.
(8) Spitzer, M.; Griffiths, E.; Blakely, K. M.; Wildenhain, J.; Ejim, L.; Rossi, L.; De Pascale, G.; Curak, J.; Brown, E.; Tyers, M.; Wright, G. D. Cross-Species Discovery of Syncretic Drug Combinations That Potentiate the Antifungal Fluconazole. Mol. Syst. Biol. 2011, 7, 499.
(9) Zou, J.; Ji, P.; Zhao, Y.-L.; Li, L.-L.; Wei, Y.-Q.; Chen, Y. Z.; Yang, S.-Y. Neighbor Communities in Drug Combination Networks Characterize Synergistic Effect. Mol. Biosyst 2012, 8, 3185−3196.
(10) Poroikov, V. V.; Filimonov, D. A.; Ihlenfeldt, W.-D.; Gloriozova, T. A.; Lagunin, A. A.; Borodina, Y. V.; Stepanchikova, A. V.; Nicklaus, M. C. PASS Biological Activity Spectrum Predictions in the Enhanced Open NCI Database Browser. J. Chem. Inf. Comput. Sci. 2003, 43, 228−236.
(11) Poroikov, V. V.; Filimonov, D. A.; Borodina, Y. V.; Lagunin, A. A.; Kos, A. Robustness of Biological Activity Spectra Predicting by Computer Program PASS for Noncongeneric Sets of Chemical Compounds. J. Chem. Inf. Comput. Sci. 2000, 40, 1349−1355.
(12) González-Díaz, H.; Prado-Prado, F. J. Unified QSAR and Network-Based Computational Chemistry Approach to Antimicro-bials, Part 1: Multispecies Activity Models for Antifungals. J. Comput. Chem. 2008, 29, 656−667.
(13) Zou, X.-J.; Lai, L.-H.; Jin, G.-Y.; Zhang, Z.-X. Synthesis, Fungicidal Activity, and 3D-QSAR of Pyridazinone-Substituted 1,3,4-Oxadiazoles and 1,3,4-Thiadiazoles. J. Agric. Food Chem. 2002, 50, 3757−3760.
(14) Walters, W. P.; Ajay; Murcko, M. A. Recognizing Molecules with Drug-Like Properties. Curr. Opin Chem. Biol. 1999, 3, 384−387. (15) Lipinski, C. A. Lead-and Drug-Like Compounds: the Rule-of-Five Revolution. Drug Discovery Today: Technol. 2004, 1, 337−341.
(16) Mitchell, T.; Showell, G. A. Design Strategies for Building Drug-Like Chemical Libraries. Curr. Opin Drug Discov Devel 2001, 4, 314− 318.
(17) Matter, H.; Baringhaus, K. H.; Naumann, T.; Klabunde, T.; Pirard, B. Computational Approaches Towards the Rational Design of Drug-Like Compound Libraries. Comb. Chem. High Throughput Screen. 2001, 4, 453−475.
(18) Leo, A.; Hansch, C.; Elkins, D. Partition Coefficients and Their Uses. Chem. Rev. 1971, 71, 525−616.
(19) Hansch, C.; Clayton, J. M. Lipophilic Character and Biological Activity of Drugs. II. the Parabolic Case. J. Pharm. Sci. 1973, 62, 1−21. (20) Eros, D.; Kövesdi, I.; Orfi, L.; Takács-Novák, K.; Acsády, G.; Kéri, G. Reliability of logP Predictions Based on Calculated Molecular Descriptors: a Critical Review. Curr. Med. Chem. 2002, 9, 1819−1829. (21) Wang, R.; Fu, Y.; Lai, L. A New Atom-Additive Method for Calculating Partition Coefficients. J. Chem. Inf. Model. 1997, 37, 615− 621.
(22) Bolton, E. E.; Wang, Y.; Thiessen, P. A.; Bryant, S. H. Chapter 12 PubChem: Integrated Platform of Small Molecules and Biological Activities. In Annual Reports in Computational Chemistry; Elsevier, 2008; Vol. 4, pp 217−241.
(23) Farha, M. A.; Brown, E. D. Chemical Probes of Escherichia Coli Uncovered Through Chemical-Chemical Interaction Profiling with Compounds of Known Biological Activity. Chem. Biol. 2010, 17, 852− 862.
(24) Tarcsay, Á.; Keserű, G. M. Contributions of Molecular Properties to Drug Promiscuity. J. Med. Chem. 2013, 56, 1789−1795. (25) Sugano, K.; Kansy, M.; Artursson, P.; Avdeef, A.; Bendels, S.; Di, L.; Ecker, G. F.; Faller, B.; Fischer, H.; Gerebtzoff, G.; Lennernaes, H.; Senner, F. Coexistence of Passive and Carrier-Mediated Processes in Drug Transport. Nat. Rev. Drug Discov 2010, 9, 597−614.
(26) Jawetz, E.; Gunnison, J. B. Antibiotic Synergism and Antagonism; an Assessment of the Problem. Pharmacol. Rev. 1953, 5, 175−192.
(27) Zimmermann, G. R.; Lehár, J.; Keith, C. T. Multi-Target Therapeutics: When the Whole Is Greater Than the Sum of the Parts. Drug Discovery Today 2007, 12, 34−42.
(28) Percha, B.; Garten, Y.; Altman, R. B. Discovery and Explanation of Drug-Drug Interactions via Text Mining. Pac Symp. Biocomput 2012, 410−421.
(29) Dent, P.; Curiel, D. T.; Fisher, P. B.; Grant, S. Synergistic Combinations of Signaling Pathway Inhibitors: Mechanisms for Improved Cancer Therapy. Drug Resistance Updates 2009, 12, 65−73. (30) Yeh, P. J.; Hegreness, M. J.; Aiden, A. P.; Kishony, R. Drug Interactions and the Evolution of Antibiotic Resistance. Nat. Rev. Microbiol. 2009, 7, 460−466.
(31) Lehár, J.; Zimmermann, G. R.; Krueger, A. S.; Molnar, R. A.; Ledell, J. T.; Heilbut, A. M.; Short, G. F.; Giusti, L. C.; Nolan, G. P.;
Magid, O. A.; Lee, M. S.; Borisy, A. A.; Stockwell, B. R.; Keith, C. T. Chemical Combination Effects Predict Connectivity in Biological Systems. Mol. Syst. Biol. 2007, 3, 80.
(32) Pignatello, R.; Musumeci, T.; Basile, L.; Carbone, C.; Puglisi, G. Biomembrane Models and Drug-Biomembrane Interaction Studies: Involvement in Drug Design and Development. J. Pharm. Bioallied Sci. 2011, 3, 4−14.
(33) Feng, L. L.; De Dille, A. A.; Jameson, V. J. V.; Smith, L. L.; Dernell, W. S. W.; Manning, M. C. M. Improved Potency of Cisplatin by Hydrophobic Ion Pairing. Cancer Chemother Pharmacol 2004, 54, 441−448.
(34) Shannon, P.; Markiel, A.; Ozier, O.; Baliga, N. S.; Wang, J. T.; Ramage, D.; Amin, N.; Schwikowski, B.; Ideker, T. Cytoscape: a Software Environment for Integrated Models of Biomolecular Interaction Networks. Genome Res. 2003, 13, 2498−2504.