FOREST FIRE SUSCEPTIBILITY ANALYSIS
OF KAHRAMANMARAS PROVINCE
Fatma ESEN
1, Vedat AVCİ
2Geliş: 27.06.2018 / Kabul: 14.09.2018 DOI: 10.29029/busbed.437858
Abstract
Kahramanmaras province is located in an area where Mediterranean, Eastern Anatolia and Southeast Anatolia eco-regions are the nearest to each other. Southern regions of the province, in particular, are dominated by Mediterranean climate and correspond to high susceptible areas in terms of forest fires. In this study, the distribution of forest fires in Kahramanmaras province was analyzed based on the outbreak points of 376 forest fires (2012-2017) recorded by Kahramanmaras Regional Directorate of Forestry. This analysis was carried out considering the factors affecting forest fire risk (vegetation, altitude, slope, aspect, temperature, precipitation, distance to settlement, and distance to roads). By using GIS (Geog-raphical Information Systems) techniques and AHP (Analytical Hierarchy Process) method, fire-susceptible areas were mapped in Kahramanmaras province at the end of the analysis conducted based on the distribution of the number of forest fires by factors that affect fire. Accordingly, 46.2% of Kahramanmaras province are high susceptible to forest fire, 47.6% are very high and 4.1% are extremely susceptible. The moderate susceptible areas are 30.197 ha, accounting for only 2.1% of the province land. There is no low susceptible area. All these values indicate that the geographical conditions at the location where the province is located are high susceptible to forest fires.
Keywords: Forest Fire, Susceptibility, GIS, AHP, Kahramanmaras Province
1 Dr., Bingol University, Faculty of Arts and Science, Department of Geography, [email protected], ORCID: https://orcid.org/0000-0002-3740-1751. 2 Dr., Bingol University, Faculty of Arts and Science, Department of Geography
KAHRAMANMARAŞ İLİ’NİN ORMAN YANGINI DUYARLILIK ANALİZİ
Öz
Kahramanmaraş İli, Akdeniz, Doğu Anadolu ve Güneydoğu Anadolu ekolojik bölgelerinin birbirine en çok yaklaştığı yerde konumlanmıştır. İlde özellikle Akdeniz ikliminin egemen olduğu güney kesimler, orman yangınları açısından son derece hassas alanlara karşılık gelmektedir. Bu çalışmada Kahramanmaraş Orman Bölge Müdürlüğü kayıtlarındaki (2012-2017) 376 orman yangınının başlangıç noktaları esas alınarak, Kahramanmaraş İl’inde orman yangınlarının dağılımları analiz edilmiştir. Bu analiz, orman yangını riskini etkileyen faktörler (bitki örtüsü, yükselti, eğim, bakı, sıcaklık, yağış, yerleşmeye uzaklık, yollara uzaklık) göz önünde bulun-durularak yapılmıştır. CBS (Coğrafi Bilgi Sistemleri) teknikleri ile AHS (Analitik Hiyerarşi Süreci) yöntemi kullanarak, yangın sayısının yangını etkileyen faktörlere göre dağılımı esas alınmış, yapılan analizler sonucunda Kahramanmaraş İl’inde yangına duyarlı alanlar haritalanmıştır. Buna göre orman yangını için Kahraman-maraş İl topraklarının %46.2’si yüksek derecede, %47.6’sı çok yüksek derecede ve %4.1’i de ekstrem derecede duyarlıdır. Orta derecede duyarlı olan alanlar ise 30.197 ha olup il arazisinin sadece %2.1’ini oluşturmaktadır. Düşük derecede du-yarlı alan ise bulunmamaktadır. Tüm bu değerler ilin bulunduğu konumda coğrafi koşulların orman yangını için yüksek duyarlılık gösterdiğini ifade etmektedir.
Anahtar Kelimeler: Orman Yangını, Duyarlılık, CBS, AHP, Kahramanmaraş İli
Introduction
A significant part of the forests of Turkey, which is located in the Mediterra-nean Basin, is under fire threat. Especially the coastline of 1700 km starting from Kahramanmaras and extending to Istanbul from Mediterranean and Aegean, shows a great susceptibility in terms of forest fires (Doganay and Doganay 2004). The characteristic plant communities of this field and the climatic characteristics have greatly complied with the fire. For this reason, forest fires play an important role in ensuring ecological balance as well as being an indispensable part of forest ecosystems in the Mediterranean Basin (Bilgili et al. 2001, Saglam et al. 2008). However, human activities have increased the frequency and distribution area of fires day by day, affecting the natural course of forest fires that develop in forests’ own ecological cycle.
Forests are also important for the protection of the world’s ecosystem, as well as meeting the needs of sustainable development, such as water, food and housing. However, this precious natural resource is widely consumed by the forest fires that take place every year. This situation causes forests, being an important natural
resource, to rapidly disappear without allowing for the renewal. Forest fires cause great damages to natural resources and human life, either as natural or as a result of human activities (Dong et al. 2005).
Forest fire risk zones are the areas where fires can easily break out and spread easily to other areas (Jaiswal et al. 2002). Therefore, to identify the forest fire susceptible areas and the factors that increase the susceptibility of these areas will make the measures to be taken against forest fires more effective and successful.
Geographic Information Systems (GIS) makes it possible to obtain high accu-racy results especially in the environment analysis by ensuring that many variables that are effective in the same event or phenomenon are evaluated at the same time. GIS, which has been increasingly used in forest fire investigations in recent years, offers great advantages in achieving effective and feasible results (Sharma et al. 2009). GIS technologies provide core technology services, being particularly vital to forest fire management (Lymberopoulos 1996, George 1999, Goodrick et al. 1999, Keramitsoglou et al. 2004, Dong et al, 2005). Forest fire susceptibility maps created with GIS help to predict forest fires, helping teams to fight forest fires, and keep forest fires at a minimum level in these areas (Chuvieco and Sales 1996). In this study, susceptible areas for forest fires were identified in Kahramanmaras province using GIS (Geographical Information Systems) techniques and AHP (Analytical Hierarchy Process) method, and the factors that increase susceptibility in these areas were determined.
1. Materials and Methods 1.1. Study Areas
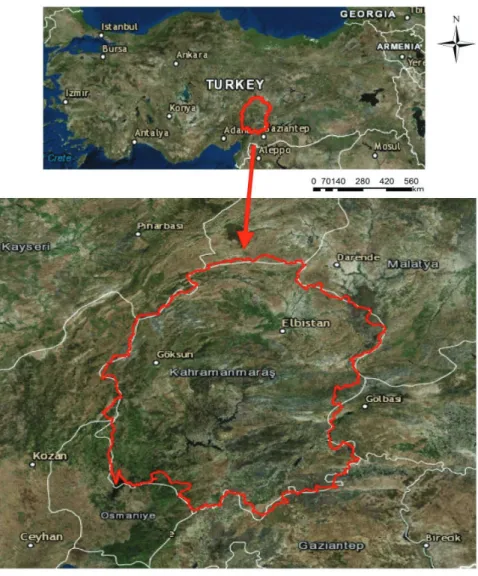
Kahramanmaras province is Turkey’s 18th biggest province with 14 468 km² area. The highest point of the province is 3084 m, the lowest point is 118 m, and the average altitude is 1324 m 59.7% of the province is covered with mountains, 24% with plateau and 16.3% with plains (Figure 1). The northern part of the province has a very mountainous structure; the higher parts of these mountainous areas are bare rocks and the lower parts are covered with forests. The province is located in an area where Mediterranean, Eastern Anatolia and Southeast Anatolia regions are the nearest to each other. This geographical location causes the effect of three different climatic types. This transitional area has a richly varied floristic composition.
Figure 1. Location map of Kahramanmaras province.
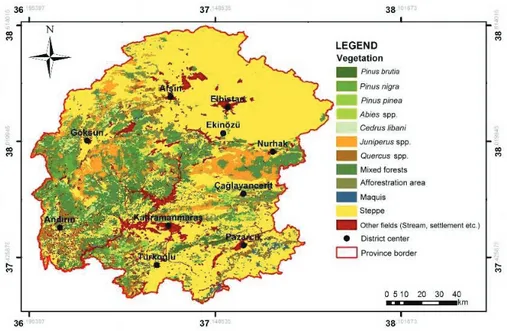
Total area of the province lands is 1 446 800 ha and 540.632 ha (37%) of the land is forest area. 12.8% of the forest areas are mixed forests, 6.5% are P. brutia, 4.9% are Abies spp., 5.3% are maquis, 3.1% are P. nigra, 2% Quercus spp. in 7%, afforestation areas in 0,9%, Juniperus spp. in 0,6%, C. libani in 0,4% and P.
pinea in 0,2%. The steppe areas show distribution in 58.6% of provinces (Table
Figure 2. Vegetation map of Kahramanmaras Province (Kahramanmaras Regional Directorate of Forestry was prepared in 2014, drawn from the Amenajman Plan)
Table 1. Area and rates of vegetation type in Kahramanmaraş province.
Vegetation Area Vegetation type km2 % Pinus brutia 947 6.5 Pinus nigra 442 3.1 Pinus pinea 32 0.2 Abies spp. 713 4.9 Cedrus libani 56 0.4 Juniperus spp. 89 0.6 Quercus spp. 389 2.7 Mixed Forests 1851 12.8 Maquis 760 5.3 Afforestration Area 127 0.9 Steppe 8473 58.6 Other Fields 589 4.0 Total 14468 100
The Mediterranean region is extremely susceptible to forests. Because the region has tree species that are easy to ignite and allow the fire to proceed easily. In addi-tion, the climate features that the region has, especially the long summer drought and winds, also increase the forest fire risk. Provincial forests with characteristics
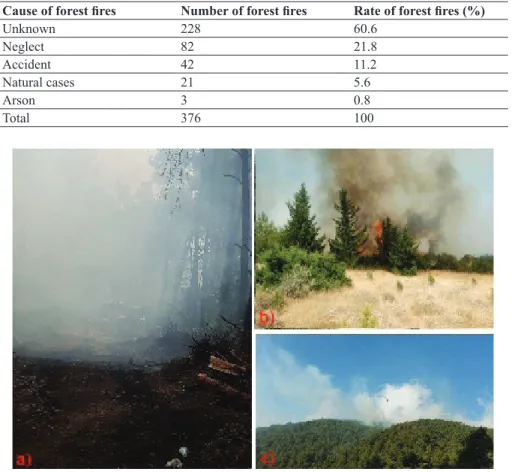
of the Mediterranean region are high susceptible to forest fires due to their location (Pic. 1). From the archives of Kahramanmaras Forest District Directorate, archive information of forest fires can be reached only between the years 2012 and 2017. Between 2012 and 2017, 376 forest fires in province were recorded. The reason for the exit of 60.6% of these forest fires is unknown. According to the reasons of forest fires, 21.8% are due to neglect, 11.2% are accidents, 5.6% are caused by natural cases and 0.8% are arson (Table 2).
Table 2. Distribution of the forest fires according to the reasons in Kahramanmaras Province 2012-2017).
Cause of forest fires Number of forest fires Rate of forest fires (%)
Unknown 228 60.6 Neglect 82 21.8 Accident 42 11.2 Natural cases 21 5.6 Arson 3 0.8 Total 376 100
Photo 1. Forest fire that has broken out in a) Çınarpınar, b) Pazarcık, and c) Suçatı.
1.2. Data
The factors used in this study aiming to determine the forest fire susceptibility of Kahramanmaras province were determined by using Kahramanmaras Forest
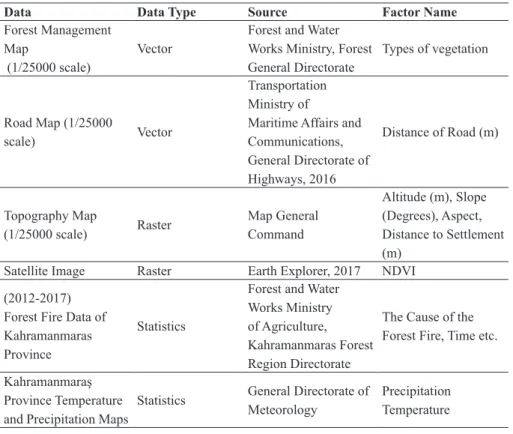
Mana-gement Directorate’s fire inventory and similar studies in the literature (Jaiswal et al. 2002, Dong et al. 2005, Sharma et al. 2009, Vadrevu et al. 2010, Caceres 2011, Mahdavi et al. 2012, Karabulut et al. 2013, Mohammadi et al. 2010, Ozsahin 2014, Eugenio et al 2016, Bingol 2017). In forest fire susceptibility analysis, four main criteria and their sub-criteria, which are directly effective in the initiation and spread of fire, namely, vegetation (vegetation, vegetation density), topography (alti-tude, slope, aspect), climate (temperature, precipitation, wind) and human activities (distance to settlement, distance to road) were evaluated. Data of the criteria used in the analysis were obtained from various sources (Table 3, Figure 3).
Table 3. The data used in the study and their sources.
Data Data Type Source Factor Name
Forest Management Map
(1/25000 scale)
Vector
Forest and Water Works Ministry, Forest General Directorate Types of vegetation Road Map (1/25000 scale) Vector Transportation Ministry of
Maritime Affairs and Communications, General Directorate of Highways, 2016 Distance of Road (m) Topography Map (1/25000 scale) Raster Map General Command Altitude (m), Slope (Degrees), Aspect, Distance to Settlement (m)
Satellite Image Raster Earth Explorer, 2017 NDVI (2012-2017)
Forest Fire Data of Kahramanmaras Province
Statistics
Forest and Water Works Ministry of Agriculture, Kahramanmaras Forest Region Directorate
The Cause of the Forest Fire, Time etc. Kahramanmaraş
Province Temperature and Precipitation Maps
Statistics General Directorate of Meteorology Precipitation Temperature
Digital Elevation Model (DEM) was created by digitizing 1 / 25000 scale to-pography maps obtained from the General Command of Cartography. The slope, aspect and altitude layers, which are important criteria of analysis, were obtained by using the created DEM. The maps of 1/25000 scaled digital management maps prepared by Kahramanmaras Regional Directorate of Forestry was used for prepa-ring the maps of vegetation and distance to settlements; road maps of the General Directorate of Highways were used to prepare map of distance to road. Temperature
and precipitation data for the period between 1929-2017 obtained from the General Directorate of Meteorology and the Kriging tool in the Interpolation menu of the Spatial Analyst Tools plug-in in the Arc-GIS GIS software were used to prepare the temperature and precipitation maps of the province. Landsat 8 OLI / TIRS satellite image of July (July 15, 2017), which is the month when forest fires are mostly seen in Kahramanmaras province, was used to create a vegetation density map. The satellite image was arranged and classified with ERDAS Image 2014 program. NDVI was formed with the following formula from Landsat 8 satellite image.
Here, NIR refers to the near infrared wavelength of the light spectrum, RED refers to the wavelength of the red region, and NDVI (unitless) refers to the vege-tation index value (Tucker 1979).
All layers obtained were converted to raster (grid) format with the same pixel size. Using the Weighted Overlay tool in the GIS environment, the efficiency rates of the layers were taken into account for overlapping and the areas susceptible to forest fire were identified. Arc-GIS 10.2 software was used when these transactions were carried out. When determining the efficiency ratings of the criteria, AHP, one of the most frequently used multi-criteria making methods in the decision-making process of the GIS-based applications, was used.
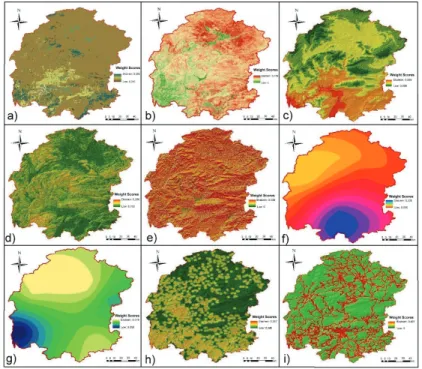
Figure 3. Variables affecting forest fire: a) vejatation, b) NDVI, c) altitude, d) slope, e) aspect, f) temperature, g) precipitation, h) settlement distance, i) road distance.
1.3. Method
First, the coordinates of the first outbreak point of 376 forest fires in Kahra-manmaras province between the years 2012-2017 were recorded. Afterwards, these fire outbreak points were overlapped with each criterion separately, and it was determined how the fires were distributed by the sub-criteria. Accordingly, the sub-criteria with high fire counts were considered as susceptible at high level and those with low fire counts were considered as susceptible at low level.
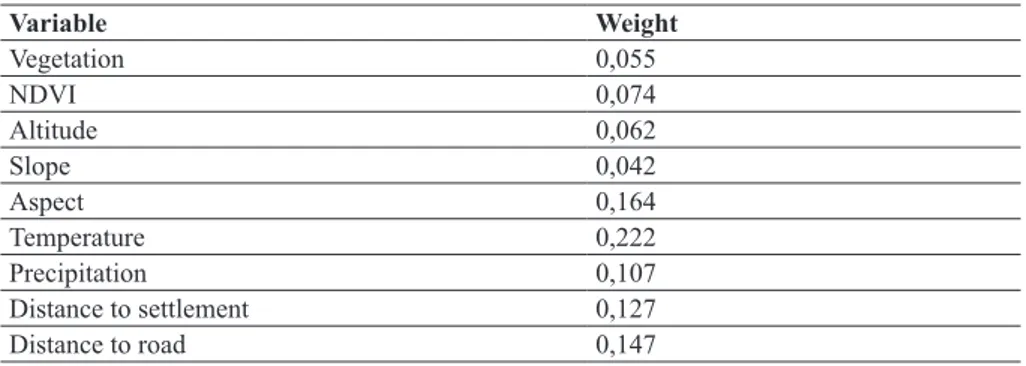
Table 4. Weight scores of variables affecting forest fire.
Variable Weight Vegetation 0,055 NDVI 0,074 Altitude 0,062 Slope 0,042 Aspect 0,164 Temperature 0,222 Precipitation 0,107 Distance to settlement 0,127 Distance to road 0,147
AHP was used to determine the degree of effectiveness of the main criteria that are effective in forest fire. Accordingly, each variable was compared with each other and a preference matrix was created. The variables were compared according to the importance scale set forth by Saaty (1994) and graded between 1 and 9 with this scale. Weights of each main criterion were determined in line with the generated matrix (Table 4).
The consistency ratio of the matrix was calculated and controlled in the second stage. The following formulas were used to calculate the consistency ratio of the «Fire Susceptibility» matrix.
CR= CI / RI
CI= (λmax-n) / (n–1)
Where; CR: Consistency Ratio, CI: Consistency Index, RI: Random Index. Accordingly, if the consistency factor (CR) is generally 10% or less, the matrix is assumed to be consistent (Saaty et al., 2003, Wind and Saaty 1980). As a result of the calculation, CI value was found 0.117 and CR value was 0.081. Therefore, in this study, the consistency rate of the forest fire susceptibility matrix was found within acceptable limits (less than 0.10).
In the last stage of the method, the grid maps of the variables were obtained with the Weighted Overlay tool in the Overlay menu of the Spatial Analyst Tools plugin in the GIS software to create susceptibility maps.
The results of the analysis of the study were automatically classified by the program and divided into five or six categories (Dong et al. 2005, Mohammadi et al. 2010, Ozshahin 2010, Eugenio et al. 2017), similar to the literature studies (Vadrevu et al. 2010, Caceres 2011, Ghobadi et al. 2012). These are; low, mode-rately, highly, very highly and extremely susceptible.
In the final stage, the fire susceptibility map was overlapped with the fire outb-reak points, so the accuracy of the result map was analysed.
2. Results 2.1. Vegetation
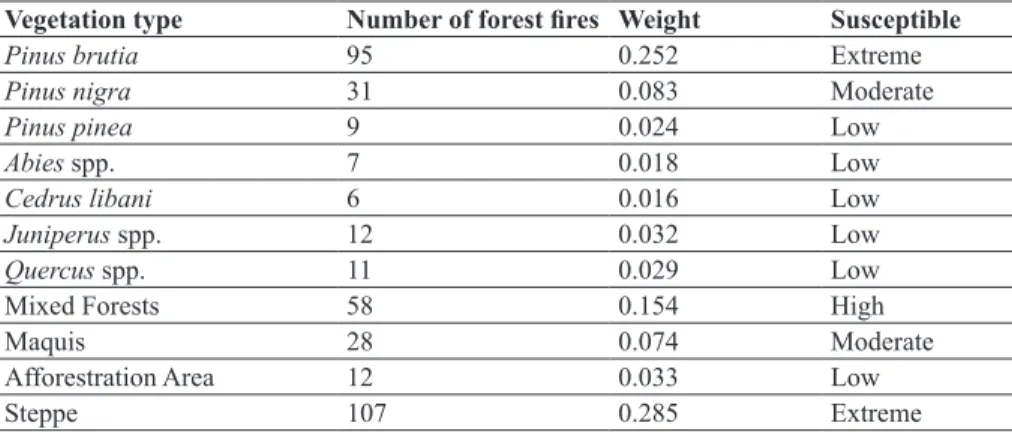
Vegetation types vary due to the location of Kahramanmaras province. The fire susceptibility of the vegetation types differ due to this diversity. The first outbreak point of 123 forest fires between 2012 and 2017 is the P. brutia forests and the maquis areas. This vegetation is very susceptible to forest fires. Other vegetation types with the most fire cases are the steppe fields (107), mixed forests (58) and the P. nigra forests (31) (Table 5). In the study area, P. pinea (9), Abies spp. (7),
C. libani (6), Juniperus spp. (12) and Quercus spp. (11) show low susceptibility
to forest fires as the vegetation types with few forest fire cases.
Table 5. Classification of vegetation type and the weight assigned to forest fire susceptible.
Vegetation type Number of forest fires Weight Susceptible
Pinus brutia 95 0.252 Extreme
Pinus nigra 31 0.083 Moderate
Pinus pinea 9 0.024 Low
Abies spp. 7 0.018 Low
Cedrus libani 6 0.016 Low
Juniperus spp. 12 0.032 Low
Quercus spp. 11 0.029 Low
Mixed Forests 58 0.154 High
Maquis 28 0.074 Moderate
Afforestration Area 12 0.033 Low
Steppe 107 0.285 Extreme
The texture of the vegetation is important in the start and spread of forest fires. For this reason, Normalized Difference Vegetation Index (NDVI) of Kahraman-maras province was determined by using satellite image.
95 (25.2%) of the forest fires in the study area between the years of 2012-2017 occurred in July. For the study area, July was considered the most susceptible month
in terms of forest fire. For this reason, a Landsat 8 OLI / TIRS satellite image da-ted July 15, 2017 was used while the NDVI was formed. According to this index indicating vegetation density, areas with medium and high cover are seen as high susceptible to forest fire (Table 6).
Table 6. Classification of NDVI and the weight assigned to forest fire susceptible.
NDVI Number of forest fires Weight Susceptible
Empty areas 0 0 Null
Low closed areas 7 0.019 Low
Medium closed areas 180 0.479 Extreme
High closed areas 157 0.417 Very High
Very high closed areas 32 0.085 Moderate
2.2. Topography
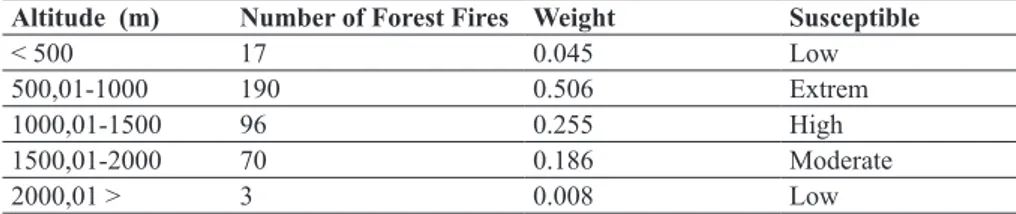
Altitude, slope and aspect are important topographical factors that are effective in the outbreak and spread of forest fires. In particular, altitude is a determining factor in the vertical distribution of vegetation types as it affects physical geography. The 500.01-1000 m altitude zone in the study area corresponds to the spreading area of P. brutia and the maquis, among the vegetation types of Mediterranean cli-mate. In this zone, which is high susceptible to forest fire, 190 forest fires occurred between 2012 and 2017. As the forest cover is weakened in areas over 2000 m, these areas are considered to be low susceptible to forest fires. In the areas above 2000 m, 3 fires occurred between 2012 and 2017 (Table 7).
Table 7. Classification of altitude and the weight assigned to forest fire susceptible.
Altitude (m) Number of Forest Fires Weight Susceptible
< 500 17 0.045 Low
500,01-1000 190 0.506 Extrem
1000,01-1500 96 0.255 High
1500,01-2000 70 0.186 Moderate
2000,01 > 3 0.008 Low
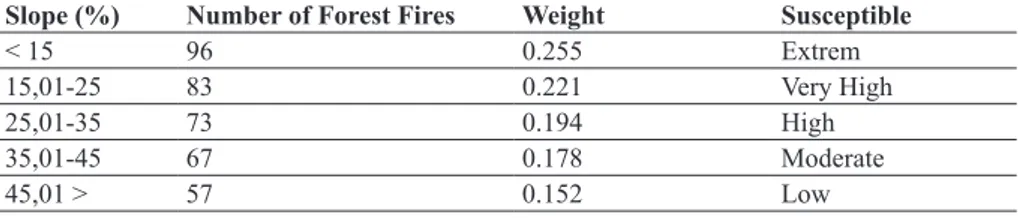
Slope values are particularly effective in the spread of fire. The fires in the sloping areas rapidly spread and the fighting with the fires is extremely difficult. As the areas with slope values below 25% in the study area are easily accessible to people, there are a lot of human-driven fires in these areas. 179 of the forest fires between the years of 2012-2017 occurred in areas with the slope value below 25 (Table 8). On the other hand, areas with slope values above 45% are difficult to reach and there is a limited number of trees in these areas, so areas with this slope value show relatively low susceptibility to forest fires.
Table 8. Classification of slope and the weight assigned to forest fire susceptible.
Slope (%) Number of Forest Fires Weight Susceptible
< 15 96 0.255 Extrem
15,01-25 83 0.221 Very High
25,01-35 73 0.194 High
35,01-45 67 0.178 Moderate
45,01 > 57 0.152 Low
Aspect conditions affect both the type of sunshine and the spreading area by influencing humidity conditions. Forest fire is considered as a variable frequently used in risk analysis (Jaiswal et al. 2002, Dong et al 2005, Joaquim et al. 2007, Eugenio 2016) since the aspect factor also influences the flammability factor. Plain areas in the study area are considered to be risk free areas in terms of fire since no fires have occurred in these areas. However, the most risky directions are S, SE and SW. 202 of the fires breaking out between 2012 and 2017 were in S, SE and SW directions. The lowest number of forest fires is the direction of E (Table 9).
Table 9: Classification of slope and the weight assigned to forest fire susceptible.
Aspect Number of forest fires Weight Susceptible
Flat 0 0 Null
N,NE, NW 125 0.332 Very High
E 17 0.045 Low
S, SE, SW 202 0.538 Extreme
W 32 0.085 Low
2.3. Climate
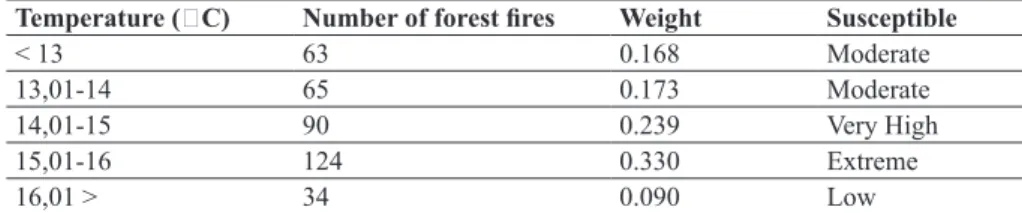
Climate characteristics in the Mediterranean Basin always keep the risk of fire high. Long summer drought in this area and temperature values above 30 °C, make Mediterranean climate susceptible to fire by reducing the humidity content of the characteristic vegetation. Particularly temperature, precipitation and wind speed among climate elements have significant influence on forest fires. While the num-ber of forest fires increases in the lower areas where the temperature values of the study area increase, it decreases in the higher areas where the temperature values decrease. Accordingly, 124 forest fires occurred in the areas where the average temperature is between 15.01-16 °C, 90 between 14.01 and 15 °C, 65 between 13.01 °C -14 °C and 63 in the areas where the average temperature is below 13 °C. On the other hand, since the areas with higher temperatures than 16.01 °C have very low spatial distribution, these areas also appear to be low susceptible to forest fires because they correspond to the areas where the forest cover is largely destroyed in the province (Table 10).
Table 10. Classification of temperature and the weight assigned to forest fire susceptible.
Temperature (⁰C) Number of forest fires Weight Susceptible
< 13 63 0.168 Moderate
13,01-14 65 0.173 Moderate
14,01-15 90 0.239 Very High
15,01-16 124 0.330 Extreme
16,01 > 34 0.090 Low
Considering the temperature values at the outbreak of the forest fires in Kahra-manmaras province between 2012 and 2017, it is seen that the temperature between 35.01-39 °C has high susceptibility for fire (Table 9). On the other hand, when the temperature is above 40 °C, the number of fire is 9 and this temperature value shows low susceptibility. The main reason for this is the unusual temperature values exceeding 40 °C. Periods when the temperature is less than 20 °C are considered to be moderate susceptible (Table 11).
Table 11. Classification of daily temperature and the weight assigned to forest fire susceptible.
Daily temperature (C⁰) Number of forest fires Weight Susceptible
< 20 22 0.059 Low 20,01-25 46 0.122 Moderate 25,01-30 72 0.191 High 30,01-35 113 0.301 Extreme 35,01-40 114 0.303 Extreme 40,01 > 9 0.024 Low
Precipitation affects the distribution of forest fires, especially by affecting the moisture holding capacity of the flammable material. While lack of rainfall inc-reases the risk of fire by reducing the moisture holding capacity of the flammable material, fire risk decreases as the moisture holding capacity of the flammable material increases in areas where the amount of rainfall is high. The precipitation values in the study area vary greatly depending on the altitude. As altitude incre-ases, temperature values decrease and precipitation values increase. Accordingly, the lower areas are the distribution area of xerophytic plants having low moisture holding capacity, while higher areas are regarded as the distribution area of moist plants resistant to low temperatures. As a consequence, while higher areas with increasing precipitation values show low susceptibility to forest fires, lower areas with low precipitation values are seen as high susceptible areas (Table 12).
Table 12. Classification of precipitation and the weight assigned to forest fire susceptible.
Precipitation (mm) Number of forest fires Weight Susceptible
< 700 22 0.059 Low
700,01-800 120 0.319 Extreme
800,01-900 93 0.247 Very High
900,01-1000 72 0.192 High
1000,01 > 69 0.183 High
Wind is an important factor in both the outbreak and spread of fire. Depending on the direction and speed, wind first reduces the relative humidity of the air and then decreases the moisture content of the flammable material, thereby increasing the risk of fire. While low and moderate force periods of wind (0-20 km/h) in the study area show high susceptibility for forest fire, periods when wind force is higher than 20.01 km/h show low susceptibility (Table 13). These periods have moderately and low susceptible to forest fires, since high-force winds are often accompanied by rainfall and there is a possibility of only natural-origin fires in stormy weather conditions.
Table 13. Classification of wind speed and the weight assigned to forest fire susceptible.
Wind speed (km/h) Number of forest fires Weight Susceptible
0-10 203 0.540 Extreme 10,01-20 114 0.303 High 20,01-30 41 0.109 Moderate 30,01-40 9 0.024 Low 40,01 + 9 0.024 Low 2.4. Human Factors
Forested areas near habitats/settlements are more prone to fire because the habitation/cultural practices of the inhabitants can lead to accidental fire (Jaswal et al. 2002). Human activities constitute a high risk for the outbreak of fires as a result of accidents or neglect (Joaquim et al. 2007). For this reason, distance to settlement in forest fire susceptibility analyses is also defined as an effective factor (Jaiswal et al. 2002, Dong et al. 2005, Joaquim et al. 2007, Eugenio 2016). Areas with less than 500 m proximity to settlements in the study area are seen as low susceptible areas for forest fires. Because, the forest cover has been destroyed to a great extent in this area. On the other hand, the areas with 500.01-1000 m and 1000.01-1500 m distance to the settlements have the highest number of fire (216) and they are seen as high susceptible areas (Table 14). After 1500.01 m distance, the number of fire gradually decrease. This result clearly demonstrates the impact of settlements on the forest fires in Kahramanmaras province.
Table 14. Classification of distance to settlement and the weight assigned to forest fire susceptible.
Distance to settlement (m) Number of forest fires Weight Susceptible
< 500 17 0,045 Low
500,01-1000 108 0,287 Extreme
1000,01-1500 108 0,287 Extreme
1500,01-2000 79 0,211 Very High
2000,01 > 64 0,170 High
The parts of the forests close to the road are defined as areas where fire suscep-tibility is high (Jaiswal et al. 2002, Dong et al. 2005, Joaquim et al. 2007, Eugenio 2016). When the distance of the first outbreak point of the fires in the study area is evaluated, the accuracy of this view is seen. 167 of the fires breaking out between 2012 and 2017 in Kahramanmaras province occurred in areas less than 250 m away from the road. From this distance, a gradual decrease is found the number of fires as the distance to the road increases. No forest fires are observed at distances longer than 1000 m to the road (Table 15).
Table 15. Classification of distance to road and the weight assigned to forest fire susceptible.
Distance to road (m) Number of forest fires Weight Susceptible
<250 167 0.451 Extrem
250,01-500 96 0.255 High
500,01-750 85 0.220 High
750,01-1000 28 0.074 Low
1000,01 > 0 0 Null
2.5. Outbreak Time of Forest Fires
When the distribution of forest fires within the year is taken into account, fires are generally seen to have occurred during summer months when temperatures are high. When the distribution of the forest fires in Kahramanmaras province between the years of 2012-2017 is analysed by month (Table 16), it is seen that most of the fires occurred in July, August and September. Forest fires are minimal in Febru-ary, March, April, May and December. However, 95% of the fires between 2012 and 2017 occurred in July, so this month is considered to be the month showing extreme susceptibility.
Table 16. Classification of months and the weight assigned to forest fire susceptible.
Months Number of forest fires Weight Susceptible
January 0 0 Null February 2 0.005 Low March 1 0.002 Low April 4 0.010 Low May 2 0.005 Low June 48 0.127 High July 95 0.252 Extreme August 86 0.228 Extreme September 89 0.236 Extreme October 32 0.085 Moderate November 17 0.045 Low December 2 0.005 Low
Considering the time of the outbreak of the forest fires in the study area, it is seen that the forest fires usually occur between 10:00-20:00. As a matter of fact, the outbreak time of 336 fires between 2012 and 2017 is in this range. However, it is observed that forest fires increase especially during the afternoon and evening hours and reach the highest level between 14:00-15:59 (Table 17). The main reason for this is that the temperature rise is at the maximum and the relative humidity is at the minimum level, depending on the duration of the sunshine during the day. In addition to natural causes, it is also likely that people cause fires as a result of accidents and neglect in forest areas due to touristic trips and picnics during the summer holidays. The early hours of the morning when the lowest number of forest fires occur show low susceptibility to forest fire.
Table 17. Distribution of forest fires according to exit times in Kahramanmaras province (2012-2017).
Times Number of forest fires Weight Risk
08:00-09:59 10 0.026 Low 10:00-11:59 58 0.154 High 12:00-13:59 84 0.223 Very High 14:00-15:59 109 0.290 Ekstrem 16:00-17:59 63 0.168 High 18:00-19:59 22 0.059 Low 20:00-07:59 30 0.080 Moderate
Conclusion
In this study, firstly the impact values of the variables affecting the forest fire susceptibility in Kahramanmaras province were analysed and a forest fire suscep-tibility map was created to this end. Accordingly, the risk factors for forest fire in the study area are as follows (highest to lowest): temperature (22%), aspect (16%), distance to road (15%), distance to settlement (13%), precipitation (11%), NDVI (0.7%), altitude (0.6%), vegetation (0.5%) and slope (0.4%). The most effective factors that cause fire in the study area are high temperatures, sunshine, distance to road and settlements. Slope and altitude are the least affective variables for fire outbreaks.
46.2% of Kahramanmaras lands are high susceptible to forest fire, 47.6% are very high and 4.1% are extremely susceptible. The moderate susceptible areas are 30.197 ha, accounting for only 2.1% of the province land. There is no low susceptible area. All these values indicate that the geographical conditions at the location where the province is located are significantly susceptible to forest fires (Table 18, Figure 4, 5).
Considering the first outbreaks of 376 forest fires between 2012 and 2017 based on the forest fire susceptibility map at the final stage of the study, it was found that 231 of these fires were in very high susceptible areas, 120 in high susceptible areas and 25 in extremely susceptible areas. No fires occurred in low and moderate susceptible areas. Considering this result as the accuracy analysis of the study, it can be said that the study gives 100% correct results (Table 18, Figure 4).
Areas located at 500,01-1000 m altitude step, with a slope lower than 15%, in the S, SE, SW directions, having 15.01-16 Cº annual average temperature and 700.01-800 mm annual total precipitation, in 700.01-1500 m distance to settle-ments and less than 250m to the road, being the spreading areas of Pinus brutia and macquis, with moderate and high cover in Kahramanmaras province are extremely susceptible areas to forest fires. In these areas, the risk of forest fires is highest in July when the temperature is between 35.01-39 °C and the wind speed is 0-10 km/hr between 14:00 and 16:00 hours in the afternoon. The areas with the least possibility of forest fire are higher than 2000 m altitude, with a slope more than 45%, in W direction, 13 °C annual average temperature and 1000 m annual total precipitation, in more than 2000 m distance to settlements and more than 1000 to road lines are Abies spp. and Cedrus libani forests with low cover.
Figure 5. Forest fire susceptibility map of Kahramanmaras Province. Table 18. Distribution of forest fire risk areas in Kahramanmaras Province.
Susceptibility to forest fires Area (ha) Rate (%) Number of forest fires Rate (%)
Low - - - -Moderate 30.197 2.1 - -High 668.887 46.2 120 31.9 Very High 688.291 47.6 231 61.4 Extreme 59.425 4.1 25 6.7 Total 1.446.800 100 376 100
Figure 5. Distribution of susceptibility class in Kahramanmaras Province.
On condition that the results obtained from this study are taken into conside-ration, it is predicted that more successful results can be obtained by means of the estimations of forest fires in the province in advance and forest fire fighting teams to be located in the right places.
It is necessary to plant trees resistant to fire in forest areas which are considered to be strengthened by afforestation in the Kahramanmaras province. However, it is necessary to plant tree species (walnut, almond etc.) that will provide economic benefits to the public in the zones of the study area that should be strengthened in order to reduce the pressure of settlements on the forest or in the areas planned to be transformed into forests. In addition, roads that have a significant importance in forest fires should be reviewed and unused unnecessary roads should be closed. The roads to be passed through the forest should be determined carefully.
References
BILGILI, E. SAGLAM, B., BASKENT, Z. E., (2001), Fire danger rating and geographical ınformation systems in fire management planning , Journal of Science and Engineering, 4(2), 88-97.
BINGOL, B., (2017), Determination of forest fire risk areas in Burdur province using geographic information systems, Turkish Journal Of Forest Science 1(2) 2017: 169-182.
CACERES, C. F., (2011), Using GIS in hotspots analysis and for forest fire risk zones mapping in the Yeguare Region, Southeastern Honduras, 13, Papers in Resource Analysis, 14 pp. Saint Mary’s University of Minnesota University Central Services Press. Winona, MN. Retrieved (date) http://www.gis.smumn.edu.
CHUVIECO, E.; CONGALTON, R.G., (1989), Application of remote sensing and geographic information systems to forest fire hazard mapping. Remote Sens. Environ. 29, 147-159. CHUVIECO, E., SALES, J., (1996), Mapping the spatial distribution of forest fire danger using
GIS. Int. J. Geogr. Inform. Systems 10, 333–345.
DOGANAY, H., DOGANAY, S., (2004), Forest fires and measures to be taken in Turkey, Eastern Geographical Journal, 11/29, 147-159.
DONG, X., LI-MIN, D., GUO-FAN, S., LEI, T., HUI, W., (2005), Forest fire risk zone mapping from satellite images and GIS for Baihe Forestry Bureau, Jilin, China, Journal of Forestry Research, 16 (3), 169-174.
EUGENIO, F.C., SANTOS, A.R., FIEDLER, N.C., RIBEIRO, G.A., SILVA, A.G., SANTOS, A.B., PANETO, G.G., SCHETTINO, V.R., (2016), Applying GIS to develop a model for forest fire risk: A case study in Espírito Santo, Brazil, J Environ Manage 173, 65-71 GEORGE, L.W., ASHLEY Perry, D., SPARROW L. F. O., (1999), A GIS-supported model for
the simulation of the spatial structure of wildland fire, Cass Basin, New Zeland, Journal of Applied Ecology, 36(4), 502-518.
GHOBADI, G. J., GHOLIZADEH, B., DASHLIBURUN, O. M., (2012), Forest fire risk zone mapping from geographic ınformation system in northern forests of Iran (Case study, Golestan province), International Journal of Agriculture and Crop Sciences, 4 (12), 818-824. GOODRICK, S., JIM, B., (1999), Florida’s fire management information system, In proceedings
from the joint fire science conference and workshop, Moscow, Idaho: University of Idaho, 1, 3-11.
JAISWAL, R., SAUMITRA, M., KUMARAN, D., RAJESH, S., (2002), Forest fire risk zone mapping from satellite imagery and GIS, International Journal of Applied Earth Observation and Geo-information, 4, 1-10.
JOAQUIM, G. S., BAHAAEDDIN, A. E., JOSEP, R. C., (2007), Remote Sensing Analysis to Detect Fire Risk Locations, GeoCongres-2007, Quebec, Canada.
KARABULUT, M., KARAKOC, A., GURBUZ, M., KIZILELMA, Y., (2013), Determination of forest fire risk areas using geographical ınformation systems in Baskonus Mountain (Kah-ramanmaras), The Journal of International Social Research, 6 (24), 171-179.
KERAMITSOGLOU, I., KIRANOUDIS, C.T., SARIMVEIS, H., at al., (2004), A multisplinary decision support for system for forest fire crisis management, Environmental Management, 33(2), 212-225.
LYMBEROPOULOS, N., PAPADOPOULOS, C., STEFANAKIS, L., et. al., (1996), A GIS-based forest fire management information system, EARSEL Advances in Romote Sensing, 4(4), 68-75.
MAHDAVI, A., FALLAH Shamsi, S. R., NAZARI, R., (2012), Forests and rangelands’ wildfire risk zoning using GIS and AHP techniques, Caspian Journal of Environmental Sciences, 10 (1), 43-52.
MOHAMMADI, F., SHABANIAN, N., POURHASHEMI, M., FATEHI, P., (2010), Risk zone mapping of forest fire using GIS and AHP in a part of Paveh forests, Iranian Journal of Forest and Poplar Research, 18 (4), 586.
OZSAHIN, E., (2014), Forest fire susceptibility analysis using GIS and AHP: the case of Antak-ya Forestry Operation Directorate, Route Educational and Social Science Journal Volume 1(3), 50-71.
SAGLAM, B., ERTUGRUL, B., DURMAZ, B. D., KADIOGULLARI, A. I., KUCUK, O., (2008), Spatio-temporal analysis of forest fire risk and danger using LANDSAT imagery, Sensors,8, 3970-3987.
SAATY, T. L., (1994), How to make a decision: the analytic hierarchy process, Interfaces, 24, 19–43.
SAATY, T. L., VARGAS, L. G., DELLMAN, K., (2003),The allocation of instangible resources: the analytic hierarchy process and linear programming, Socio-Economic Planning Sciences, 37, 169-189.
SHARMA, D., HOA, V., CUONG, V., TUYEN, T., SHARMA, N., (2009), Forest fire risk zo-nation for Jammu district forest division using remote sensing and GIS, 7th FIG Regional Conference-2009, Hanoi, Vietnam.
TUCKER, C. J., (1979), Red and Photographic Infrared Linear Combinations for Moni-toring Vegetation. Remote Sensing of Environment, 8, 127–150.
VADREVU, K. P., EATURU, A., BADARINATH, K. V. S., (2010), Fire risk evaluation using multicriteria analysis—a case study, Environmental Monitoring and Assessment, 166 (1-4), 223-239.
WIND, Y., SAATY, T. L., (1980), Marketing applications of the analytic hierarchy process, Management Science, 26 (7), 641- 658.