EXPERIMENTAL AND STATISTICAL INVESTIGATION OF DRILLING OF AISI 1040 STEEL AT DRY AND WET CONDITIONS
1Murat OZSOY , 2Neslihan OZSOY
Sakarya Üniversitesi, Mühendislik Fakültesi, Makine Mühendisliği Bölümü, Sakarya, TÜRKİYE 1[email protected], 2[email protected]
(Geliş/Received: 31.10.2019; Kabul/Accepted in Revised Form: 24.12.2019)
ABSTRACT: AISI 1040 steel is widely used in the machinery and manufacturing industries and is used in a variety of machine parts, automotive parts, molds, fixtures and many other areas. Technological developments in the field of machining in recent years have led to many problems affecting machining performance. Drilling is one of the most important machining operations. In this study effect of drilling parameters such as cutting speed (15, 20 m/min), feed rate (0.1, 0.15 mm/tooth), type of drill (E, HSS-E TiN coated), drilling type (standard, pecking) and cooling type (liquid, air) were examined on AISI 1040 steel. Parameters’ effects on surface roughness were investigated. Experiments were planned according to L8 orthogonal array. Optimum conditions were found via Taguchi’s Signal/Noise analysis. Probability analysis was performed to discover the distribution of the measured/calculated values of the results. Lastly, confirmation tests were conducted to control the success of the optimization. The optimal conditions for surface roughness were observed at A1B2C2D1E2 (i.e., cutting speed: 15m/min, feed rate: 0.15mm/tooth, cooling type: liquid, drilling type: standard, and type of drill: HSS-ETiN coated).
Key Words: Drilling, Taguchi method, AISI 1040 steel, Cutting parameters, Surface roughness
AISI 1040 Çeliğinin Kuru ve Islak Koşullarda Delinmesinin Deneysel ve İstatistiksel İncelenmesi ÖZ: AISI 1040 çeliği, makine ve imalat sanayinde yaygın olarak kullanılan ve çeşitli makine parçası, otomotiv parçası, kalıp ve diğer birçok alanda yer alan bir malzemedir. Son yıllarda işleme alanındaki teknolojik gelişmeler, işleme performansını etkileyen birçok soruna yol açmıştır. Delme en önemli işleme operasyonlarından biridir. Bu çalışmada kesme hızı (15, 20 m/dak), diş başı ilerleme (0.1, 0.15 mm/diş), matkap tipi (HSS-E, HSS-E TiN kaplı), delme stili (standart, gagalama) ve soğutma tipi (sıvı, hava) gibi delme parametrelerinin etkisi AISI 1040 çeliği üzerinde incelendi. Parametrelerin yüzey pürüzlülüğü üzerindeki etkileri araştırıldı. Deneyler L8 ortogonal dizisine göre planlandı. Taguchi’nin Sinyal/Gürültü analizi ile optimum koşullar bulundu. Sonuçların ölçülen/hesaplanan değerlerinin dağılımını belirlemek için olasılık analizi yapıldı. Son olarak, optimizasyonun başarısını kontrol etmek için doğrulama testleri yapıldı. Yüzey pürüzlülüğü için en uygun koşullar A1B2C2D1E2'de gözlenmiştir (yani, kesme hızı: 15m/dak, diş başı ilerleme: 0,15mm/diş, soğutma tipi: sıvı, delme tipi: standart ve matkap tipi: HSS-ETiN kaplı).
INTRODUCTION
Nowadays, the issue of cooling of cutting tools in milling, drilling and turning is examined in many different ways. Economic benefits and environmental policies are the most studied subjects. In terms of economic gains, tool life and surface roughness, and environmental impacts of the cooling conditions in terms of environmental policies are the areas where works concentrated. Many studies are carried out on cooling conditions such as minimum quantity lubrication, cryogenic and pressured air (dry) to increase the tool life.
The work in this area is focused on examining the cutting parameters (cutting speed, axial depth of cut, radial depth of cut and feed rate), cutting tool geometry/material and work piece material changes on surface roughness. In the 1960s, the Taguchi method proposed by Genichi Taguchi is widely used due to its proven success in improving industrial product quality. The relevance to the "Taguchi" method of researchers is increasing day by day, especially because of the low number of experiments, ease of application and easy evaluation of qualitative variables.
The goal of chip removal is to reduce cost and improve performance. For this, optimum processing conditions must be available. For best results, parameters affecting performance are identified and examined. In recent years, the use of the Taguchi method has been widespread. Because it is possible to save time and cost by reducing the number of experiments with Taguchi method. Some of the researches are reviewed from the literature and summarized below.
Balaji et al. optimized the factors used during drilling of titanium alloy material. They chose helix angle, feed rate, spindle speed as parameters and measured surface roughness, flank wear and acceleration of drill vibration velocity (Balaji et al., 2018). Cakiroglu and Acir studied drilling performance of Al2014 materials. They investigated effects of cutting speed, cutting tool and feed rate on interface temperature, and cutting force by using Taguchi method (Cakiroglu et al., 2013). Nasir et al. investigated effects of parameters like spindle speed, feed rate and drill point geometry on the residual tensile stress and delamination of drilled flax fibre composites. They used Taguchi method and made variance analysis (Nasir et al., 2015). Meral et al. studied optimization of drilling parameters by using two different drills. They planned experiments by Taguchi method and investigated geometric deviations to find optimum levels of parameters (Meral et al., 2011). There are lots of experimental works on optimization of drilling parameters for different materials (Ramesha et al., 2018, Heidary et al., 2018, Motorcu et al., 2014, Kaplan et al., 2015).
Many factors affect the surface roughness, such as the type of material, cutting tool, cutting speed and progress, cutting depth, coolant and machine construction. As seen from literature survey surface roughness changes with one of these factors. However, the effects of the factors causing change can be different and independent, or they may be related to each other. In this experimental study for the best surface quality, experiments were designed with Taguchi experiment design and Taguchi optimization was applied to the obtained results.
Experiments are used by researchers to identify and understand a system or a specific process. An experiment in the literature is also a test. Observing and analyzing the outputs of a process or system is the modification and analysis (Montgomery, 2007). Experimental studies in engineering, product and process development play an important role. Experimental design was first introduced in the 1920s by the famous British statistician R.A. Fisher and his friends.
Taguchi Method is an experiment design and optimization method based on parameter design. In its simplest sense, optimization can be defined as the optimal use of limited resources at hand. Optimization is very important in academic studies. Scientists use different optimization methods in their works (Filiz et al., 2017, Cetin et al., 2011, Yıldırım et al., 2019, Çiçek et al., 2015 and Kıvak, 2014).
In this study Taguchi method was chosen to optimize results. Most commonly used in statistical analysis of data collected within the scope of quality assurance systems. Taguchi's experimental design method is a very useful method to determine the optimum combination between different levels of different parameters. Moreover, Taguchi method is a method used to save time and cost.
The aim of this study to find optimum drilling conditions of AISI 1040 steel at dry and wet cooling conditions. In this study, used parameters and levels were not evaluated together in the literature before. EXPERIMENTAL WORK
The work piece material selected for investigation is AISI 1040 steel with the compositions as shown in table 1. The AISI 1040 steel used in the test is of the general production grade class and is widely used in the market. Since it is suitable for heat treatment, it is used in many mold sets, apparatus making, automotive sector, parts subjected to various difficulties, transferring miller and some gears. It has a tensile strength of 600 MPa, a modulus of elasticity of 210 GPa and a 24% elongation. The dimensions of the work piece used in experimentation are 15X150X80 mm3.
Table 1. Chemical composition of the work piece material
C % Si % Mn % Pmax% Smax %
0.40-0.50 0.25-0.35 0.60-0.90 0.04 0.05
Five different parameters were chosen in the experiment design: cutting speed (15, 20 m/min), feed rate (0.1, 0.15 mm/tooth), type of drill (HSS-E, HSS-E TiN coated), drilling type (standard, pecking) and cooling type (liquid, air). Selected parameters and levels are specified in Table 2. L8 orthogonal array was selected to determine optimum conditions and analyze the parameters.
Table 2. Parameters and levels
Symbol Parameters Level 1 Level 2
A Cutting speed (m/min) 15 20
B Feed rate (mm/tooth) 0.1 0.15
C Cooling type Air Liquid
D Drilling type Standard Pecking
E Type of drill HSS-E HSS-ETiN coated
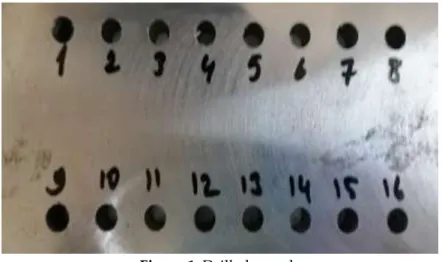
All statistical analyses were performed using the Minitab 18 statistical package program at 90% confidence level. Experimental samples were prepared at TAKSAN brand TMC 700V model CNC vertical machining center in Sakarya University Mechanical Engineering Department Laboratory. Experimental sample can be seen in Figure 1.
Figure 1. Drilled sample
MAHR-MARSURF PS1 model desktop roughness measurement instrument was used to measure surface roughness values and is shown in figure 2. Measurements were taken at room temperature. The
instrument measures according to DIN EN ISO 3274 standards. Measurements were taken from the work piece on the same axis at one point. The cutting length (Lc) was chosen as 0.8 mm and the sampling length (Lt) as 5.6 mm for the measurement of the surface roughness values which occurred during machining on the work piece.
Figure 2. MAHR-MARSURF PS1 model desktop roughness measurement
RESULTS AND DISCUSSIONS Signal/Noise Analysis
The average surface roughness (Ra) measurements made and their average values are given in Table 3. Optimization was done with the help of the results obtained. In this optimization process, there are three different convenient functions known as the Taguchi loss function, also referred to as the signal to noise ratio (S/N-Signal/Noise) function. These are “the higher the better”, “the nominal is the best”, “the lower the better”. We want to decrease surface roughness. So “the lower the better” approach was used and shown in equation (1) below.
η = S N⁄ = −10 log [1 𝑛∑ 𝑦𝑖
2 𝑛
𝑖=1 ] (1) where yi is the observed data at the ith experiment and n is the number of observations of the
experiment (Kıvak, 2014).
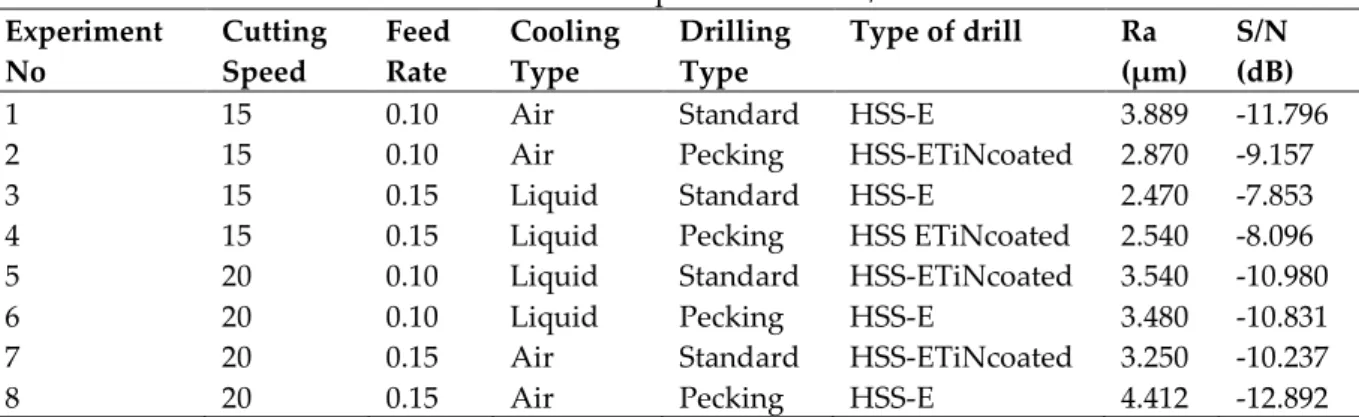
Table 3. The results of experiments and S/N ratios values Experiment No Cutting Speed Feed Rate Cooling Type Drilling Type Type of drill Ra (µm) S/N (dB)
1 15 0.10 Air Standard HSS-E 3.889 -11.796
2 15 0.10 Air Pecking HSS-ETiNcoated 2.870 -9.157
3 15 0.15 Liquid Standard HSS-E 2.470 -7.853
4 15 0.15 Liquid Pecking HSS ETiNcoated 2.540 -8.096
5 20 0.10 Liquid Standard HSS-ETiNcoated 3.540 -10.980
6 20 0.10 Liquid Pecking HSS-E 3.480 -10.831
7 20 0.15 Air Standard HSS-ETiNcoated 3.250 -10.237
8 20 0.15 Air Pecking HSS-E 4.412 -12.892
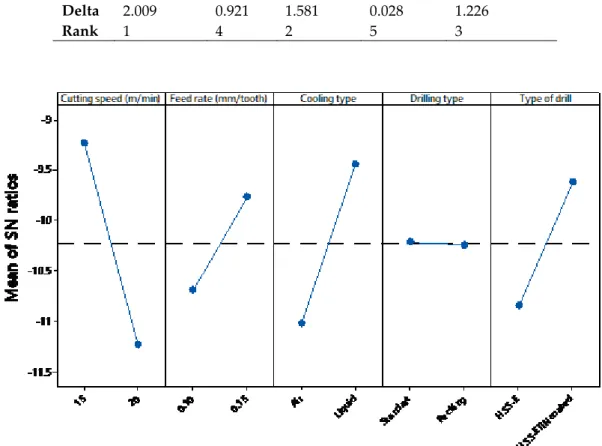
“S/N response table” shows the effect of each parameter on the surface roughness in Table 4. S/N analysis made by Taguchi method provides to find out optimal levels for the optimal surface roughness. The level values for control factors for Ra given in table 4 are shown in graph forms in figure 3. The optimum level of each parameter was determined according to the highest signal to noise ratio of these control factor levels. Hence, the levels for the parameters giving the best Ra value were detected as factor
A (Level 1, S/N=-9.226), factor B (Level 2, S/N=-9.770), factor C (Level 2, S/N=-9.441), factor D (Level 1,
S/N=-10.217) and factor E (Level 2, S/N=-9.618). That means an optimum Ra value can be obtained with these levels of factors.
Table 4. S/N response table for surface roughness Level Cutting Speed Feed Rate Cooling Type Drilling Type Type of drill 1 -9.226 -10.692 -11.021 -10.217 -10.844 2 -11.236 -9.770 -9.441 -10.245 -9.618 Delta 2.009 0.921 1.581 0.028 1.226 Rank 1 4 2 5 3
Figure 3. S/N graphs for surface roughness
As seen from table 4 cutting speed is the most effective parameter on surface roughness, second one is cooling type and after that type of drill, feed rate and drilling type follows respectively. Drilling type’s levels have very close S/N ratios in figure 3. Therefore, that parameter had the minimum effect over surface roughness.
If cutting speed increase, there is an increase in tool wear due to thermal loads. Therefore, surface roughness increased (Çiçek, 2015). On the other hand, type of drill results clearly shows the effects of coatings on cutting tools, on the surface quality in drilling of AISI 1040 steel.
Analysis of Variance
The analysis of variance (ANOVA), which is a statistical decision-making tool, was performed to reveal the differences between the performances of the factors affecting the process. Variance analysis is used to determine the effect of independent variable or different values of variables on dependent variable. With the help of ANOVA the effects of cutting speed, feed rate, cooling type, drilling type and type of drill on surface roughness were found. Table 5 shows the ANOVA results for the surface roughness. In the variance analysis performed in this study, the confidence interval was 95% and significance level was 5%. The effects of parameters in ANOVA is calculated by comparing the F ratio of each parameter. The last column of the table gives the contribution rate of each parameter, defining the degree of impact on measurements. The contribution rates of the A, B, C, D and E factors on the surface
roughness were found to be 34%, 5%, 23%, 0.1% and 17 % respectively. From these results effective parameter on the surface roughness were cutting speed (factor A, 34%). These results support S/N analysis. Cutting speed, cooling type and type of drill had the maximum effects like Kıvak’s study (Kıvak, 2012).
Table 5. Variance analysis of surface roughness
Source Degree of Freedom Sum of Squares Mean Square F ratio Contribution Rate (%) Cutting speed 1 1.06070 1.06070 3.17 34 Feed rate 1 0.15318 0.15318 0.46 5 Cooling type 1 0.71461 0.71461 2.13 23 Drilling type 1 0.00293 0.00293 0.01 0.1 Type of drill 1 0.52583 0.52583 1.57 17 Error 2 0.66980 0.33490 20.9 Total 7 3.12704 100 Probability Analysis
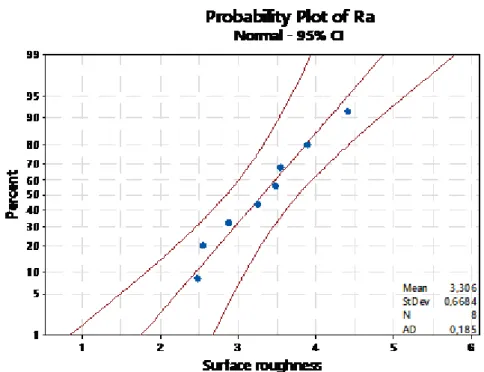
Probability analysis helps to check the distribution of the measured/calculated values of the results. Probability graph is given in Figure 4. The plots were drawn for a confidence interval (CI) of 95%. When the data points are roughly aligned with the middle straight line and P value is greater than 0.05 and AD statistics are low, we can say that, the drawn data is distributed normally (Babu et al., 2017). Therefore, these data can be used for optimization and experimental research.
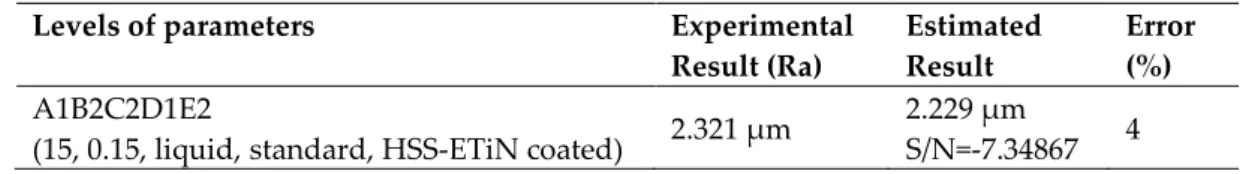
Confirmation Tests
The last step of Taguchi method is to control success of optimization by confirmation tests. When the optimum levels of the parameters are not in the experimental plan, confirmation tests are conducted. According to signal/noise analysis optimum levels are A1B2C2D1E2 as seen figure 3. Drilling process was evaluated with the optimized levels of factors and really the minimum surface roughness was found as 1.143 µm. Table 5 shows confirmation test results. Error between experimental and estimated result is 4%. So we can say that optimization is successful.
Table 6. Confirmation test results
Levels of parameters Experimental
Result (Ra) Estimated Result Error (%) A1B2C2D1E2
(15, 0.15, liquid, standard, HSS-ETiN coated) 2.321 µm
2.229 µm
S/N=-7.34867 4
CONCLUSIONS
In the present study, the effects of cutting speed, feed rate, type of drill, drilling type and cooling type process parameters on surface roughness in drilling of AISI1040 steel were evaluated by means of Taguchi experiment design method. Accordingly, the following results were obtained.
The optimum levels of the control factors for minimizing the surface roughness using S/N rates were determined. The optimal conditions for surface roughness were observed at A1B2C2D1E2 (i.e., cutting speed:15 m/min, feed rate:0.15 mm/tooth, cooling type: liquid, drilling type: standard and type of drill: HSS-ETiN coated).
According to ANOVA results cutting speed had the maximum effect over surface roughness with a rate of 34%. Second effective parameter was cooling type with 23%, third one was type of drill with 17%, fourth one was the feed rate with 5%. Drilling type had the smallest effect with 0.1 %. That can be negligible.
Probability analysis proved the success of optimization.
To confirm the S/N ratio results, experiments were conducted with the optimized levels of factors and minimum surface roughness was found as 2.321 µm. Error between experimental and estimated result is 4%.
In this study, it was found that the Taguchi method was applied successfully to save time and cost in drilling of AISI1040 steel. Obtained results can be used future academic researches and industrial applications.
REFERENCES
Balaji M., Venkata K., Mohan N., Murthy B.S.N. (2018). Optimization of drilling parameters for drilling of TI-6Al-4V based on surface roughness, flank wear and drill vibration. Measurement, 114, 332– 339.
Çakıroğlu R., Acır A. (2013). AI2014 malzemesinin delinmesinde takım talaş ara yüzey sıcaklıkları ve kesme kuvvetinin Taguchi metodu ile optimizasyonu. Makine Teknolojileri Elektronik Dergisi, 10:2, 73-86.
Nasir A.A., Azmi A.I., Khalil A.N.M. (2015). Measurement and optimization of residual tensile strength and delamination damage of drilled flax fibre reinforced composites. Measurement, 75, 298–307. Meral G., Sarıkaya M., Dilipak H. (2011). At the drilling applications optimization of quality of drill via
Ramesha B., Elayaperumal A., Satishkumar S., Kumar A. (2018). Drilling of pultruded and liquid composite moulded glass/epoxy thick composites: Experimental and statistical investigation. Measurement, 114, 109–121.
Heidary H., Karimi N.Z., Minak G. (2018). Investigation on delamination and flexural properties in drilling of carbon nanotube/polymer composites Composite Structures, 201, 112–120.
Motorcu A.R., Kuş A., Durgun İ. (2014). The evaluation of the effects of control factors on surface roughness in the drilling of waspaloy superalloy. Measurement, 58, 394–408.
Kaplan Y., Motorcu A.R., Nalbant M., Okay Ş. (2015). The effects of process parameters on acceleration amplitude in the drilling of cold work tool steels. Int. J. Adv. Manuf. Technol.,80, 1387-1401. Montgomery DC (2007). Design and Analysis of Experiments, Wiley, New York.
Filiz İ.H., Olguner S., Evyapan E. (2017). A study on optimization of planetary gear trains. ActaPhysicaPolonica A, 132, 728-733.
Cetin M. H., Ozcelik B., Kuram E., Demirbas E. (2011). Evaluation of vegetable based cutting fluids with extreme pressure and cutting parameters in turning of AISI 304L by Taguchi method. Journal of Cleaner Production, 19, 2049-2056.
Yıldırım Ç. V., Kıvak T., Erzincanlı F. (2019). Tool wear and surface roughness analysis in milling with ceramic tools of Waspaloy: a comparison of machining performance with different cooling methods. Journal of the Brazilian Society of Mechanical Sciences and Engineering, 41:83. Çiçek A., Kıvak T., Ekici E. (2015). Optimization of drilling parameters using Taguchi technique and
response surface methodology (RSM) in drilling of AISI 304 steel with cryogenically treated HSS drills. J IntellManuf, 26:295–305.
Kıvak T., Samtaş G.,Çiçek A. (2012). Taguchi method-based optimization of drilling parameters in drilling of AISI 316 steel with PVD monolayer and multilayer coated HSS drills. Measurement 45, 1547– 1557.
Kıvak T. (2014). Optimization of surface roughness and flank wear using the Taguchi method in milling of Hadfield steel with PVD and CVD coated inserts. Measurement, 50, 19-28.
G.H. V. Babu, K. Venkatarao, C.H. Ratnam (2017). Multi-response optimization in orthogonal turn milling by analyzing tool vibration and surface roughness using response surface methodology. ProcIMechE, Part B: J Engineering Manufacture, vol.231, no.12, 2084-2093.