WORKLOAD CHARACTERIZATION OF TELECOM SOFTWARE
1Osman Ferit ÜNLÜ, 2Pınar BÖLÜK
1 [email protected], 2 [email protected]
1Nokia Research and Development Center, Istanbul, TURKEY
2Computer Engineering, Graduate School of Natural and Applied Sciences, Bahçeşehir University,
Istanbul, TURKEY
(Geliş/Received: 01.03.2019; Kabul/Accepted in Revised Form: 30.07.2019)
ABSTRACT: Telecom software systems are a major aspect of telecommunications networks used for managing, administrating, auditing and monitoring purposes. One of the most significant features is the performance of the telecom software system, since there is a great variety of network elements in use within built systems through which the telecom software interacts. Workload characterization is an essential methodology for simulating load usage for a given infrastructure that is exposed to a production environment. Hence, exploring the characteristics of workloads well leads an increase on system efficiency and performance. Nevertheless, workload characterization has not been well examined yet for Telecom Software System. In this paper, a new workload characterization architecture is proposed and implemented to model the workload and simulate the behavior of the network element. This architecture provides information regarding the accuracy of the workload models for more precise performance testing. Additionally, we verify our workload characterization results obtained from our architecture in a real software system. Performance results show that proposed workload model-based simulation environment is promising to predict the performance of the software systems.
Key Words: workload, clustering, workload characterization, trace-based simulation
Telekom Yazılımı İş Yükü Karakterizasyonu
ÖZ: Telekom yazılım sistemleri, yönetim, denetim ve izleme amacıyla kullanılan telekomünikasyon ağlarının önemli bir parçasıdır. Telekom yazılım sistemlerinin en önemli özelliklerinden biri performansıdır. Bunun nedeni telekom yazılımının etkileşim içinde olduğu yerleşik sistemler içinde kullanılan çok farklı ağ elemanları vardır. İş yükü karakterizasyonu, üretim ortamına maruz kalan belirli bir altyapı için yük kullanımını simüle etmek için temel bir metodolojidir. Bu nedenle, iş yüklerinin özelliklerini iyi araştırmak, sistem verimliliği ve performansında artışa neden olmaktadır. Bununla birlikte, literatürde iş yükü karakterizasyonunun Telekom Yazılım Sistemlerinin performansına etkileri henüz iyi bir şekilde incelenmemiştir. Bu yazıda, iş yükünü modellemek ve ağ elemanının davranışını simüle etmek için yeni bir iş yükü karakterizasyon mimarisi önerilmiş ve uygulanmıştır. Bu mimari, daha yüksek doğrulukta performans testleri için iş yükü modellerinin doğruluğu hakkında bilgi sağlamaktadır. Ek olarak, çalışma da önerilen mimariden elde edilen iş yükü karakterizasyon sonuçları gerçek bir yazılım sistemi ile doğrulanmaktadır. Performans sonuçları, önerilen iş yükü modeline dayalı simülasyon ortamının yazılım sistemlerinin performansını öngörmeyi vaat ettiğini göstermektedir. Anahtar Kelimeler: İş yükü, kümeleme, iş yükü karakterizasyonu, iz tabanlı simülasyon
INTRODUCTION
A workload can be defined as a set of requests that a system receives as an input over a certain period of time (Shirasb, 1983). To detect the performance of any system-i.e., the requests processed by the system-its workload must be analyzed. The input requests arrive into the system from external sources. This generic unit of work is called a “workload component". Workload components include transactions, interactive commands, processes and http requests, depending on the nature of the service provided. The workload parameters that are required for workload characterization are obtained from the workload components. Workload parameters are the measured quantities, service requests, or resource demands, etc. Examples of workload parameters include instructions, transaction types, packet sizes, page reference patterns and source-destinations of a packet. Workload component and parameter selection plays a key role in workload characterization. The workload component must represent as homogeneous a group as possible, and parameters that have little effect must be excluded. The system domain is important to the workload component since the component itself can be selected according to the domain. Operating system-level parameters, such as CPU time, cannot be used; instead, parameters that depend on the workload itself are selected.
A major problem for performance testing is the use of unrealistic workloads, which lead to incorrect, inefficient performance results (Jain, 2008). Such badly measured or mis-measured performance results could lead to performance problems and failures with "production", or in other words, the "live" environment. Hence, an efficient workload characterization is a vital issue for regulating efficient resource provisioning, power management and energy conservation strategies within a technological infrastructure (Feitelson, 2014). The workload models that derive from the characterization process play also an important role in performance testing. The main fields in which workload characterization is practiced are the web, online social networks, video services, mobile devices and the cloud systems (Avritzer et al., 2002; Calzarossa et al., 2016).
In this study, we present a new workload characterization architecture which model the workload and then simulate the behavior of the network element for a Telecom software system. In the architecture, we utilize different clustering techniques to characterize workload. Then, the effect of clustering accuracy on the performance has been analyzed in terms of CPU usage, memory and Disc I/O. We adapt “measurement-based" technique which is given in (Franks et al., 2007) for performance modeling to predict future loads of a software system. This architecture also provides accuracy for the characterization of more precise workload models and the accuracy effect on the performance results is also studied. Furthermore, we have developed a new software system named PAS (Parameter Audit SmartApp) to explore the performance of the proposed workload characterization architecture in real test environment. The effect of clustering accuracy on performance testing has been shown for workload characterization. To the best of our knowledge, workload characterization methodologies have not yet been applied or studied in relation to software architectures that operate within the telecom domain.
The rest of the paper is organized as follows; Section 2 describes the existing literature relating to workload characterization techniques. In Section 3, we show how we characterized the telecom log data and outlines of the architecture is shown. Performance results of clustering techniques are given in Section 4. Section 5 presents the effect of workload characterization performance on resource utilization. Finally, Conclusion is given in Section 6.
RELATED WORK
Workload characterization analysis techniques vary from statistical, Markov models, Principal component analysis, histograms (single and multi-parameter) to clustering (Calzarossa et al., 2016). Statistical methods include median, mode and averaging operations to characterize workload in the system. The averaging method is used when the average value of a parameter can be considered its basic characterization. The median and mode formulations are used in addition to the arithmetic mean. This methodology functions well with good uniform distributions or gross studies (Feitelson and Rudolph,
1996). The specifying dispersion method is used when most of the parameters is non-uniform. Variance or standard deviation specifications can be a major improvement over the average. Both average and standard deviation allow workloads to be grouped into classes, but this still ignores the exact distribution (Tietjen, 1986). Markov models are used when distribution is not enough, meaning that requests can be received by a system in sequences and the sequencing affects performance. Markov models represent models as a state diagram and show probabilistic transitions between states. Request generation is based on these transitions. When creating a Markov model, a long string of activities is observed. A matrix is used to count pairs of states. The matrix rows must be normalized to sum to 1.0 (Neuts, 1989). Clustering technique has been used for workload characterization task (Saraswathi and Sheela, 2014; Menasce et al., 1996; Gruttner et al., 2015; Xu and Tian, 2015). The main objective when applying clustering algorithms is to classify requests into a smaller group of classes to create similar workloads to those on the production side. During the process of workload characterization of a system, log files are analyzed, and a clustering algorithm is applied. This classification is made based on a widely used clustering algorithm, such as the connectivity-based (hierarchical), centroid-based or density-based algorithms (Saraswathi and Sheela, 2014).
There are several workload characterization implementations are applied on different software domains such as mass storage systems (Menasce et al., 1996), embedded software (Gruttner et al., 2015), and parallel scientific programs (Helm and Malony, 2001).
WESSBAS (Hasselbring et al., 2008; Hasselbring et al., 2014) is a model-driven approach for automatically expositing and transforming workload models for the load testing and performance prediction of session-based applications. This approach is extended with WESSBASS-DSL, which can define the layered modeling of workload specifications for the Palladio component model (Hasselbring
et al., 2014). Casalicchio et al. (2015) has proposed a workload characterization based on three months of
the real traffic and resource usage of Desktop-as-a-Service. The cloud desktop service workload and the cloud storage service workload are defined as representative workloads. As reported in this study, workload characterizations such as session length could be modelled with exponential distribution, while CPU load and disk load (R/W) are longtail distributed. Feitelson and Zakay (2014) describe a workload characterization method based on real traces, which are divided into sub-traces to represent different users. The re-sampling is applied in various ways and collected over daily and weekly periods. Amrehn et al. (2015) presents an automated workload characterization approach for I/O-intensive software applications in virtualized environments. Storage request properties are extracted via monitoring tools, with a proposed algorithm defining the workload models. Workload migration and consolidation cases have also been studied in this work.
The customer behavior model graph (CBMG) technique has been applied as a workload characterization methodology in (Almeida et al., 1999). The CBMG technique is likewise implemented for automated workload characterization using system log analysis in (Daniel and Mahmoud, 2015). The authors have enhanced its implementation by using ELK as a technology stack, to achieve greater efficiency and generalness. This technique is also used in (Politi et al., 2004). Gruttner et al. (2015) has proposed a hybrid approach to defining automatic workload models for embedded software performance estimation. From CPU usage and memory access patterns, embedded software workload models are extracted and used for host-based simulation. Simulation results are obtained from WCET benchmarks. Curiel and Pont (2018) describe new innovations in the WWW that involve dealing with more complex workload models. This survey summarizes and provides guidelines for these challenges. Some recent studies have also applied these approaches on other software architectures, like microservices. Nakaike et al.'s (2016) study is the first empirical study on the performance analysis of microservices; it constitutes important research, as it shows that the microservice architecture consumes more resources due to its monolithic approach. ACME Air, a public benchmark, is used for the experimental results.
Although there are several workload characterization implementations in software domains, none of them has been dealt with the real telecom data. In this paper we propose a workload characterization
methodology on telecom data which uses several clustering techniques. We also utilize a software tool named PAS to verify of our performance results in a real log data.
PROPOSED ARCHITECTURE
In this section, we present our workload characterization architecture which is given in Figure 1. Our architecture includes Production Logs, Workload Simulation Tool, PAS (Parameter Audit SmartApp) and Trace based Simulation modules. PAS is a software tool that supports the automated auditing of network elements' configurable parameters. Using its network element-specific software modules, or “communicators", PAS collects data from network elements over secure connections (Goren
et al., 2017). The PAS tool logs both the data requested by a network element (NE) and the response
coming from it, along with the total audit completion time. Each audit for a specific network element has specific retrieval mechanisms, and for every retrieval request, the response output varies. Due to the characteristics of the PAS tool, the key parameters for workload component can be identified as:
• Network element type,
• Total number of retrieval commands per audit,
• Total data exchange volume (transmitted between NEs and PAS) per audit, • Total completion time per audit.
This modeling of the key parameters step is important for telecom software systems. The main duty of telecom software systems are to communicate with network elements for auditing, administration and monitoring purposes. Key values for PAS can be changed to request-based terminology to deal with generic definition. Once the identification step of key parameters is completed, data files (log files) are collected for a given period. Workload characterization and Generation is based on clustering algorithms applied to extracted key parameters. As every workload is characterized by a group of features (key parameters), clustering algorithms are appropriate methods to identify the number of clusters in the workload. The workloads placed in the same cluster are merged to obtain a core model of the workloads. Once the workloads have been defined based on clustering, the selected core models are given to PAS, and the network element simulations are initiated. Along with the cluster results, selected cluster member is used as a workload model for the trace-based simulated network elements. The simulation lists all the network elements, along with detailed information like network element name, network port, network element log file and assigned network element IP. The trace-based simulations are defined to PAS via a web service API. The trace-based network elements are initiated with their assigned IPs and ports. Performance tests can be started once this operation is complete. The trace-based simulator is a simulation tool developed by Nokia Turkey Research and Development Center to mimic the network element behavior for testing purposes (Celik et al., 2015). This simulator is integrated into the workload simulation to enable the creation of the network elements needed for workload testing without the need for actual NEs or NE configuration.
Figure 1. Workload characterization architecture
For user interactions, a graphical user interface (GUI) is implemented as a Java Swing application (Java).
For clustering algorithm implementation, the WEKA software API is used (WEKA). We used F-measure and accuracy metric to represent the performance of clustering. The F-F-measure is a metric of accuracy based on the calculated precision (P) and recall (R) values. The F-measure formulation is given Eq 1.:
(1)
CLUSTER RESULT ANALYSIS
The cluster result analysis is performed on a total of 500 network element audit log files. The log instances are labeled in the different cluster results according to certain predefined cluster number (K) parameters: K=3, 4 and 5. The result analysis is applied on the actual label set of the log files.
Table 1. Comparison for the number of clusters K=3
Algorithms Accuracy F-Measure Time Taken Instances
K-Means 49.4% 52.1% 0.085 0: 87 (17%) 1: 104 (21%) 2: 309 (62%) EM Clustering 47.8% 50.6% 0.12 0: 102 (20%) 1: 300 (60%) 2: 98 (20%) Hierarchical Clustering 43.4% 45.2% 0.14 0: 386 (77%) 1: 104 (21%) 2: 10 (2%) Density-Based Clustering 49.4% 52.1% 0.21 0: 89 (18%) 1: 104 (21%) 2: 307 (61%) Table 1 shows that K-means and density-based clustering algorithms has the higher accuracy and F-measure results when the number of clusters k is 3. It also shows that K-means has the lowest computational time among other algorithms. Density based clustering algorithm has the highest computational time despite having close accuracy and F-measure values to K-means. Hierarchical clustering algorithm has the lowest accuracy and F-measure values which is also can be seen by cluster instance member difference. Since the cluster instance number is limited with 3, there is no clear distinction between clustering algorithms.
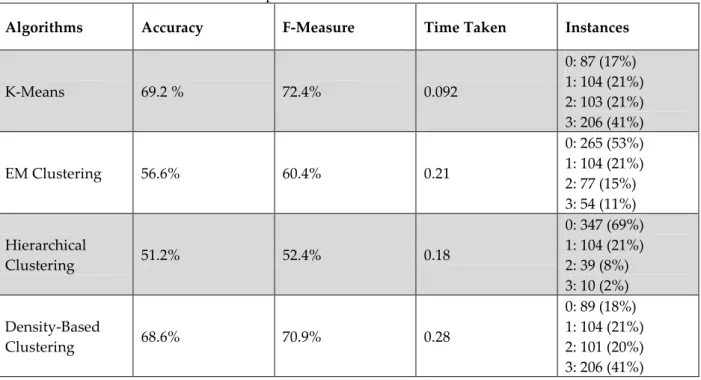
Table 2. Comparison for the number of clusters K=4
Algorithms Accuracy F-Measure Time Taken Instances
K-Means 69.2 % 72.4% 0.092 0: 87 (17%) 1: 104 (21%) 2: 103 (21%) 3: 206 (41%) EM Clustering 56.6% 60.4% 0.21 0: 265 (53%) 1: 104 (21%) 2: 77 (15%) 3: 54 (11%) Hierarchical Clustering 51.2% 52.4% 0.18 0: 347 (69%) 1: 104 (21%) 2: 39 (8%) 3: 10 (2%) Density-Based Clustering 68.6% 70.9% 0.28 0: 89 (18%) 1: 104 (21%) 2: 101 (20%) 3: 206 (41%)
Table 2 shows that all clustering algorithms shows higher accuracy and F-measure values with 4 cluster instances. K-means algorithm still shows the highest accuracy and F-measure values with lowest computational time. Density based clustering algorithm has the highest computational time as it was with 3 cluster instances. As the cluster instance number increases, F-measure and accuracy difference hierarchical clustering presents wors performance compared to the other algorithms.
Table 3. Comparison for the number of clusters K=5
Algorithms Accuracy F-Measure Time Taken Instances
K-Means 77% 82.2% 0.14 0: 77 (15%) 1: 104 (21%) 2: 103 (21%) 3: 167(33%) 4: 49(10%) EM Clustering 59.2% 61% 0.28 0: 269 (54%) 1: 39 (8%) 2: 104 (21%) 3: 78 (16%) 4: 10 (2%) Hierarchical Clustering 59.2% 61.1% 0.21 0: 270 (54%) 1: 77 (15%) 2: 104 (21%) 3: 39 (8%) 4: 10 (2%) Density-Based Clustering 76.6% 81.8% 0.36 0: 77 (15%) 1: 104 (21%) 2: 103 (21%) 3: 165 (33%) 4: 51 (10%)
Density-based clustering tended to show an increased rate of accuracy and F-measure values as the number of clusters increased. Hierarchical clustering had the disadvantage of not being able to undo cluster member changes, which resulted in worse performance results. As the number of clusters increases, the difference in accuracy performance and execution time increases between K-means and density-based algorithms versus EM and hierarchical clustering algorithm. Table 3 results also fits the previous table results which fulfills the overall cluster analysis. To characterize workload models accurately, accuracy and f-measure values are also taken into consideration while creating workload models and performance results.
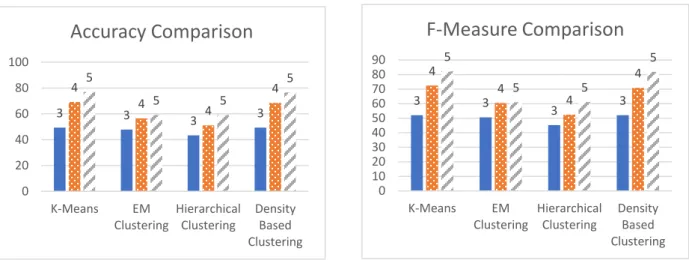
Figure 2 and Figure 3 also show accuracy and f-measure comparison of K-Means, EM, Hierarchical and Density based Clustering methods for varying number of clusters. The Figures also verify that, K-means algorithm shows higher accuracy performance with an increase in the number of clusters, the algorithms perform with higher accuracy performance and a higher execution time. The partitioning clustering algorithm (K-means) also demonstrated a more accurate performance and lower execution time when compared to the EM, density-based and hierarchical clustering algorithms.
Figure 2. Accuracy comparison Figure 3. F-Measure comparison RESOURCE UTILIZATION
In this Section, we present the effect of workload characterization performance on resource utilization. in terms of CPU and Memory and DISC I/O usage. Depending on the accuracy results, the best workload model is defined for our software system (PAS) and then trace-based network element simulators are configured by considering its performance.
CPU and Memory Usage
CPU and memory data are collected while an audit job employed in network elements is running for each cluster instance. These resource usage characteristics are depicted according to the standard deviation of the CPU and memory usages. As shown in Figure 4, as the accuracy of the cluster increases, the derivation of the graph decreases. This result can be interpreted as follows: a greater number of network elements having these characteristics results in the same usage patterns for CPU and memory.
3 3 3 3 4 4 4 4 5 5 5 5 0 20 40 60 80 100 K-Means EM Clustering Hierarchical Clustering Density Based Clustering
Accuracy Comparison
3 3 3 3 4 4 4 4 5 5 5 5 0 10 20 30 40 50 60 70 80 90 K-Means EM Clustering Hierarchical Clustering Density Based ClusteringF-Measure Comparison
(a)CPU Usage Standard Deviation for Three Cluster Instances (b)CPU Usage Standard Deviation for Four Cluster Instances
(c)CPU Usage Standard Deviation for Five Cluster Instances Figure 4. CPU usage standard deviation
Figure 4.a shows the three-instance cluster CPU result tests, based on density, K-means and hierarchical clustering result workloads, which tend to show lower standard deviation values compared to EM. As the accuracy of the clusters are close to each other, standard deviations of the resource usage for different clustering methods will be nearly same. Figure 4.b shows the four-instance cluster CPU test results. The K-means and density clustering result workloads show lower standard deviation values compared to EM and hierarchical clustering. The accuracy levels of the clusters are differentiated, which results in lower standard deviation values as well. Figure 4.c represents the five-instance cluster CPU test results. The accuracy difference being higher for both the three- and four-instance cluster results for K-means and density clustering as opposed to EM and hierarchical clustering has an adverse effect on the standard deviation values. Figure 5 shows standard deviation values of the memory usage. The results are calculated for workloads obtained from each cluster instance. Figure 5.a presents that the K-means and density clustering workloads produce lower memory standard deviation values when compared to EM and hierarchical. Figure 5.b shows the related results. As a relevant result for CPU usage, the memory usage standard deviation values are lower for the K-means and density clustering result workload models. As the accuracy of the cluster results become higher, characteristically close network elements are formed into cluster members. Figure 5.c shows the memory usage standard deviation results for five cluster instance results.
0 5 10 15 20 25 30 35 40 Sta n d ar t De viat ion 0 5 10 15 20 25 30 35 40 45 Sta n d ar t De viat ion 0 5 10 15 20 25 30 35 40 Sta n d ar t De viat ion
(a)Memory Usage Standard Deviation for (b)Memory Usage Standard Deviation for Four Cluster Instances
Three Cluster Instances
(c)Memory Usage Standard Deviation for Five Cluster Instances Figure 5. Memory usage standard deviation
The CPU and memory usage graphs were checked for standard deviations to compare the differences between cluster instances for each clustering algorithm. Our performance results show that, standard deviation values decrease as the accuracy of the clusters increase. This was an expected outcome as PAS software performance tests are run against network elements, which are members of a cluster instance. For CPU and memory usage, this means PAS audits are completed for network elements, which have the same kind of data to be processed. As an example, when a network element returns a bulk configuration data response for a retrieval, this requires more computing resources for the processed data. When a network element's response data type varies within a cluster instance, this results in a high standard deviation value for the CPU and memory usage. PAS software resource usage will differ between audit jobs for network elements with bulk configuration data and for network elements with key-value-type configuration data. These results are important for two reasons: firstly, if performance tests are completed against more accurate workloads, this will provide overall PAS software resource usage information when a group of network elements with bulk configuration data are compared with network elements with key-value configuration data. This information is essential to the analysis of software architects as it can contribute to the simulation of a [particular] production environment. Second, graphs representing resource usage change for both CPU and memory can provide more precise results to analyze. Software architects can further investigate aspects of the resource usage behavior of this performance output software, such as resource usage pick points, etc.
0 0,5 1 1,5 2 2,5 3 3,5 4 4,5 5 5,5 6 6,5 7 7,5 Sta n d ar t De viat ion 0 0,5 1 1,5 2 2,5 3 3,5 4 4,5 5 5,5 6 6,5 Sta n d ar t De viat ion 0 0,5 1 1,5 2 2,5 3 3,5 4 4,5 5 5,5 6 Sta n d ar t De viat ion
DISC I/O Usage
Disc I/O data-i.e., data transfer between the hard disc and RAM-are collected based on the total transactions for a selected cluster result of an audit. The correlation between the accuracy of a cluster and the disc I/O total transactions can be seen in the graphs below. As the cluster accuracy increases, the disc I/O usage difference between the clusters varies. The higher disc I/O usage difference situation occurs with the hierarchical clustering for three and four cluster instances. The disc I/O usage details are listed below.
(a)DISC I/O Transactions for Three Cluster Instances (b)DISC I/O Transactions for Four Cluster Instances
(c)DISC I/O Transactions for Five Cluster Instances Figure 6. Disc I/O transactions
The hierarchical clustering workload model results have the highest difference between cluster instances. When compared with accuracy levels, this cannot be explained by characteristically close network elements being in the same cluster; this is the result of a higher number of network elements being members of the same hierarchical cluster instance. Figure 6.a shows the total transactions for the three-instance cluster results. Figure 6.b shows the four-instance cluster results. Since the K-means and density clustering show better accuracy, the total transaction values difference becomes higher for each cluster instance. The EM clustering workload models have less differentiated disc I/O usage patterns. The hierarchical cluster workload model results show disc I/O usage difference decreases as the cluster instance number increases. This result shows that prior hierarchical results are misleading due to the number of cluster members for each hierarchical cluster instance. The K-means and density clustering workload model results show a higher disc I/O usage variance between cluster instances as the accuracy of the cluster increases. The EM clustering workload results show very similar disc I/O usages between cluster instances. Figure 6.c shows the total transactions for the five-instance cluster results. The results
0 10000 20000 30000 40000 50000 60000 To ta l T ra n sact ion s 0 10000 20000 30000 40000 50000 60000 To ta l T ra n sact ion s 0 5000 10000 15000 20000 25000 30000 35000 40000 45000 To ta l T ra n sact ion s
for total disc I/O transactions were related to the results seen for CPU and memory usages. The total transactions differed in relation to an increase in the accuracy of the cluster results value. When analyzing these performance outputs, the hierarchical clustering results seemed to constitute an exceptional case. The hierarchical clustering results showed a high level of differentiation between the total disc I/O transactions for the workload performance tests, despite low accuracy rates. This outcome can be interpreted in terms of a disadvantage of the hierarchical clustering method. In the hierarchical clustering method, previous steps cannot be undone, so once a network element has been assigned to a cluster member, it cannot be re-assigned. The degree/level of difference between the cluster members affects the total disc I/O transaction counts. These performance results show that, although there is a correlation between accuracy and performance, exceptional cases must be considered based on the performance metric.
CONCLUSION
In this study, we have described a workload characterization-based approach on telecom data for performance testing. To automate the process and create a simulation environment, a new workload-based simulation tool is implemented. Network element data is collected and downloaded over a selected period. The tool's workload characterization is done on this data based on clustering algorithms including K-means, EM clustering, hierarchical and density-based algorithm. Depending on the accuracy results, the best workload model is defined for the PAS software and then trace-based network element simulators are configured.
As shown in the case study, there is a high correlation between the performance characteristics and the accuracy of the cluster results. This outcome also shows accuracy of the workload models’ importance for predicting the performance of the system. The performance tests are also conducted on measured CPU usage, memory usage and total disc I/O transactions. The PAS software performance and resource consumption tests are reviewed, and results were obtained for the defined workload. Our performance results show that since the defined workload model-based simulation environment mimics the production behavior, the results can be used to predict the performance of the PAS software. As a future work, we plan to extend this study for other performance metrics such as network throughput, database-related metrics, etc. Additionally, the correlation of these performance characteristics may also be required to analyze with the accuracy of the cluster results. To the best of our knowledge, workload characterization methodologies have not yet been studied for software operating within the telecom domain.
REFERENCES
Almeida, V., Fonseca R., Menasce, D.A., Mendes M.A., 1999. A Methodology for Workload Characterization of E-commerce Sites. In ACM Conference on Electronic Commerce.
Amrehn, E., Busch A., Kounev S., Koziolek A., Noorshams Q., Reussner R., Jan. 2015. Automated work-load characterization for i/o performance analysis in virtualized environments. In Proc. of the 6th ACM/SPEC International Conference on Performance Engineering, pp. 265-276.
Avritzer, A., Kondek J., D. Liu., July 2002. Software performance testing based on workload characterization.Proceedings of the 3rd international workshop on Software and performance. Calzarossa M.C., Luisa M., Tessera D. 2016. Workload Characterization: A Survey Revisited. ACM
Computing Surveys, Vol. 48, No. 3, Article 48.
Casalicchio E., Iannucci S., Silvestri L., Mar. 2015. Cloud desktop workload: A characterization study. In IEEE International Conference on Cloud Engineering (IC2E). IEEE, pp. 66-75.
Celik, I., Gunaydın M., Resber C., Sonmez O., Tasdemir B., Unlu O.F. 2015.Network Element Simulation Based On Log Files. ICCIT Conference.
Curiel, M., Pont A., January 2018. Workload Generators for Web-Based Systems: Characteristics, Current Status and Challenges. In IEEE Communication Surveys & Tutorials.
Daniel, V., Mahmoud A., November 3-5 2015. Automated Workload Characterization Using System Log Analysis. In Computer Measurement Group Conf., San Antonio.
Feitelson, D. G., Rudolph L., May 1996. Evaluation of design choices for gang scheduling using distributed hierarchical control. J. Parallel & Distributed Comput. 35(1), pp. 18-34, DOI:10.1006/jpdc.1996.0064.
Feitelson, D. G., 21 Oct 2014. Workload Modeling for Computer Systems Performance Evaluation. Cambridge University Press.
Feitelson, D. G., Zakay N., 2014. Workload resampling for performance evaluation of parallel job schedulers. Concurrency and Computation: Practice and Experience, Vol. 26, No. 12, pp. 2079-2105.
Franks, G., Woodside M., Petriu D.C., 2007. Future software performance engineering. Washington: IEEE Computer Society, pp. 171-187.
Goren, H., Gorgun O., Yigit M., February 2017. IMS Automated Audit and Configuration: Parameters Audit SmartApp (PAS). International Journal of Electronics and Electrical Engineering, Vol. 5, No. 1.
Gruttner, K., Hartmann P. A., Ittershagen P., Nebel W., 2015. A Workload Extraction Framework for Software Performance Model Generation. RAPIDO '15 Proceedings of the 2015 Workshop on Rapid Simulation and Performance Evaluation: Methods and Tools, Article No. 3.
Hasselbring, W., Rohr M., Van Hoorn A., 2008. Generating probabilistic and intensity-varying workload for Web-based software systems. In Proc. SIPEW '08, pp. 124-143.
Hasselbring, W., Krcmar H., Schulz E., Van Hoorn A., Vogele C., 2014. Automatic extraction of probabilistic workload specifications for load testing session-based application systems. In Proc. Valuetools.
Helm, B. R., Malony A. D., September 2001. A theory and architecture for automating performance diagnosis. Future Generation Computer Systems - I. High Performance Numerical Methods and Applications. II. Performance Data Mining: Automated Diagnosis, Adaption, and Optimization archive, Volume 18, Issue 1, pp. 189-200.
Jain, R., 2008. The art of computer systems performance analysis. John Wiley & Sons. Java Swing Framework - https://en.wikipedia.orgnwikinSwing (Java)
Menasce, D. A., Pentakalos O. I., Yesha Y., 1996. Automated Clustering-Based Workload Characterization. In Proceedings of the 5th NASA Goddard Mass Storage Systems and Technologies Conference.
Nakaike, T., Ohara M., Ueda T., Sept. 2016. Workload Characterization for Microservices. In IEEE Workload Characterization (IISWC), pp. 25-27.
Neuts, M. F., 17 July 1989. Structured stochastic matrices of M/G/1 type and their applications. CRC Press.
Politi, R., Ruffo G., Schifanella R., Sereno M., 2004. WALTy (Web application load-based testing tool): A User Behavior Tailored Tool for Evaluating Web Application Performance. In: Proceedings of the third IEEE International Symposium on Network Computing and Applications (NCA04). Saraswathi, S., Sheela M. I., November 2014. A Comparative Study of Various Clustering Algorithms in
DataMining. IJCSMC, Vol. 3 Issue 11, pp.422-428.
Shirasb, S., 1983. Workload Modeling and Characterization in Computer Systems Performance Evaluation. North Dakota State University Press.
Tietjen, G.L., 1986. The analysis and detection of outliers. In Goodness-of-Fit Techniques, R. B. D'Agostino and M. A. Stephens (eds.), pp. 497-522, Marcel Dekker, Inc.
WEKA Java API - http://weka.sourceforge.netndoc.stablen
Xu D., Tian Y., June 2015. A Comprehensive Survey of Clustering Algorithms. Volume 2 Issue 2 pp 165-193.