T.C.
SELÇUK UNIVERSITY
THE GRADUATE SCHOOL OF NATURAL AND APPLIED SCIENCE
DETERMINATION OF SOME PROPERTIES OF YOGHURT ADDED CORNELIAN
CHERRY AND ROSE HIP FRUITS MARMALADE WITH HIGHER
ANTIOXIDANT CONTENT
Rola ALZAMARA MASTER'S THESIS
The Department of Food Engineering
April-2015 KONYA All Right Reserved
TEZ BİLDİRİMİ
Bu tezdeki bütün bilgilerin etik davranış ve akademik kurallar çerçevesinde elde edildiğini ve tez yazım kurallarına uygun olarak hazırlanan bu çalışmada bana ait olmayan her türlü ifade ve bilginin kaynağına eksiksiz atıf yapıldığını bildiririm.
DECLARATION PAGE
I hereby declare that all information in this document has been obtained and presented in accordance with academic rules and ethical conduct. I also declare that, as required by these rules and conduct, I have fully cited and referenced all material and results that are not original to this work.
Rola ALZAMARA 03.04.2015
iv ÖZET
YÜKSEK LİSANS TEZİ
ANTİOKSİDANCA ZENGİN KUŞBURNU VE KIZILCIK MEYVELERİNDEN YAPILAN MARMELATLAR İLAVE EDİLEREK ÜRETİLEN MEYVELİ
YOĞURTLARIN BAZI ÖZELLİKLERİNİN BELİRLENMESİ Rola ALZAMARA
Selçuk Üniversitesi Fen Bilimleri Enstitüsü Gıda Mühendisliği Anabilim Dalı Danışman: Prof. Dr. Nihat AKIN
2015, 72 Jüri
Prof. Dr. Nihat AKIN Doç. Dr. Cemalettin SARIÇOBAN
Yrd. Doç. Dr. Durmuş SERT
Bu çalışmada kuşburnu ve kızılcık marmelatları % 5, 10 ve 15 oranında fermentasyon öncesi ve sonrası set ve stirred tip yoğurtlara ilave edilmiştir. Antioksidan aktivite ve fenolik içerik analizlerinin yanında yoğurtların fizikokimyasal ve mikrobiyolojik özellikleri de belirlenmiştir ve 21 günlük soğuk depolama süresince kontrol yoğurtla kıyaslanmıştır. Kuşburnu ve kızılcık marmelatlı yoğurtların antioksidan aktivitesini ve su tutma kapasitesini geliştirmiştir. Antioksidan aktivite ve fenolik içerikte depolama boyunca istatistiksel olarak öenmli bir azalma gözlenirken, yine de yoğurtlar bu süre sonunda kontrol yoğurtla kıyaslanırsa daha yüksek antioksidan ve fenolik içeriğinde kalmıştır.
Anahtar Kelimeler: Antioksidan aktivitesi, Kızılcık, Zenginleştirilmiş yoğurt, Fenolik bileşikler, Kuşburnu.
v ABSTRACT MS THESIS
DETERMINATION OF SOME PROPERTIES OF YOGHURT ADDED CORNELIAN CHERRY AND ROSE HIP FRUITS MARMALADE WITH
HIGHER ANTIOXIDANT CONTENT Rola ALZAMARA
THE GRADUATE SCHOOL OF NATURAL AND APPLIED SCIENCE OF SELÇUK UNIVERSITY
THE DEGREE OF MASTER OF SCIENCE IN FOOD ENGINEERING
Advisor: Prof.Dr.Nihat AKIN 2015, 72
Jury
Prof. Dr.Nihat AKIN
Assoc. Prof. Dr. Cemalettin SARIÇOBAN Assist. Prof. Dr. Durmuş SERT
In this study, the highest antioxidant Rose hip and Cornelian cherry marmalade added pre or post fermentation in different concentrations (5, 10 and 15%) to yoghurt (set and stirred; Rose hip and Cornelian cherry marmalade yoghurt). In addition to the antioxidant activity and the phenolic compounds content, physicochemical and microbiological properties of Rose hip and Cornelian cherry marmalade yoghurt determined in comparing with plain yoghurt during 21 days of cold storage. The Rose hip and Cornelian cherry marmalade enhanced the radical scavenging activity and water holding capacity of yoghurt. While the significant decreases of antioxidant activity and phenolic compounds content occurred during cold storage period, the Rose hip and Cornelian cherry marmalade yoghurt remained richer in antioxidant and phenolic compounds compared to plain yoghurt.
Keywords: Antioxidant activity, Cornelian cherry, Fortified yoghurt, Phenolic compounds, Rose hip.
vi ACKNOWLEDGEMENTS
I would like to acknowledge many people sincerely for helping and supporting me during my research. My thanks and appreciations go to my advisor and mentor, Prof.Dr.Nihat AKIN. I am very grateful for the opportunity given to me to do my master’s degree under his tutelage.
I would also like to thank Assoc. Prof. Dr. Ismail KESKİN, who has helped me so much in data analysis. And I would like to show appreciations to Prof. Dr. Mustafa KARAKAYA and Assoc. Prof. Dr. Cemalettin SARIÇOBAN for given me the opportunity to use your lab equipments. My many thanks goes to Res. Assist. Talha DEMIRCI, who has helped me so much during my research and thesis preparations. I don’t know if I could have been able to continue this research without his assistants. And also I would like to thanks Res. Assist. Hasan İbrahim KOZAN and Res. Assist. Kübra AKTAŞ.
I am very much thankful to the departments of Food Engineering at the University of selçuk for providing laboratory facilities and resources needed for this research. I would also like to thank the Scientific Research Projects (SU-BAP-Konya, Turkey) of Selcuk University Coordinating Office for supporting me financialy during my research.
I am hardly indebted to my parents for their unconditional and endless love that they have showing and still continues to show me throughout my life. I am so grateful to all my friends who helped me along the way, a especial thanks goes to Sadat, Osman, Mohammad, Busra, Kubra, Serife and Hulya. Without their encouragements, I don’t know if I could go further in my master’s program.
Rola ALZAMARA KONYA-2015
vii CONTENTS ÖZET ... iv ABSTRACT ... v ACKNOWLEDGEMENTS,,,,,,,,,,,,,,,,,,,,,,,,,,,,,,,,,,,,,,,,,,,,,,,,,,,,,,,,,,,,,,,,,,,,,,,,,,,,,,,,,,,,,,,,,,,vi CONTENTS ... vii 2. LITERATURE REVIEW ... 3
3. MATERIALS AND METHODS ... 10
3.1. Materials ... 10
3.2.Methods ... 10
3.2.1.Cornelian cherry and rosehip marmalade preparation ... 10
3.2.2.Yoghurt preparation ... 10
3.2.3.Yoghurt analysis ... 11
3.2.4.Total phenolic content assay (TPCs) ... 11
3.2.5.Antioxidant activity (AOC) assay ... 11
3.2.5.1. Extraction of yoghurt samples ... 11
3.2.5.2. DPPH assay ... 12
3.2.5.3. ABTS assay ... 12
3.2.6.Physicochemical analysis ... 12
3.2.6.1. Moisture analysis ... 12
3.2.6.2. Total solids analysis ... 13
3.2.6.3. Solids not fat analysis ... 13
3.2.6.4. Determination of ash content ... 13
3.2.6.5. Fat analysis ... 13
3.2.6.6. Protein analysis ... 13
3.2.6.7. Water activity analysis ... 13
3.2.6.8. pH ... 13
3.2.6.9. Determination of titratable acidity ... 14
3.2.6.10. Syneresis analysis ... 14
3.2.6.11. Water holding capacity analysis ... 14
3.2.6.12. Viscosity analysis ... 14
3.2.6.13. Color measurement ... 15
3.2.6.14. Sensory analysis ... 15
3.2.7.Microbiological analysis ... 15
3.2.8.Statistical analysis ... 15
4. RESULTS AND DISCUSSIONS ... 16
4.1. The results and discussions of physicochemical properties of Cornelian cherry and Rosehip marmalade yoghurt. ... 16
viii
4.1.1. The results of fat, protein, moisture, ash, total solid and solid not fat analysis 16
4.1.2. The results of pH measurement ... 17
4.1.3. The results of titratable acidity measurement ... 21
4.1.4. The results of syneresis and water holding capacity (WHC) ... 24
4.1.5. The results of Viscosity ... 27
4.1.6. The results of water activity (aw) ... 28
4.1.7. The results of color measurement ... 30
4.2. The result of total phenolic compounds (TPCs) ... 34
4.3. The result of antioxidant activity (AOA) ... 38
4.3.1. DPPH scavenging activitiy ... 38
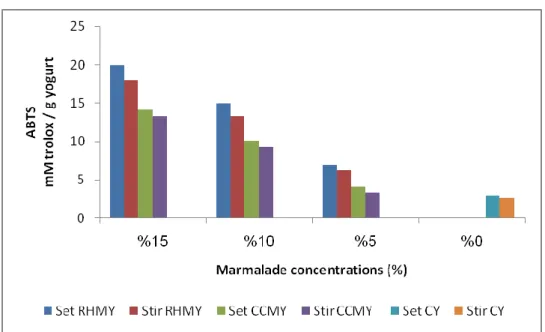
4.3.2. ABTS scavenging activity ... 42
4.4. The results of sensory evaluation ... 45
4.5. The results of microbiological enumeration ... 48
5. CONCLUSIONS AND RECOMMENDATIONS... 51
5.1. Conclusions ... 51
5.2. Recommendations ... 51
ix SYMBOLS AND ABBREVIATIONS
Symbols and Abbreviations Explanation
ROS Reactive oxygen species
RNS Reactive nitrogen species
FDA Food and drug administration
BHA Butylated hydroxyanisol
BHT Butylated hydroxytoluene
TBHQ Tertiary butyl hydroquinone
O2-. Superoxide anion
SOD superoxide dismutase
.
OH Hydroxyl radical
HOCL Hypochlorous acid
ROO. Peroxyl radicals
HOO. Hydroperoxyl radical
H2O2 Hydrogen peroxide
FC Folin ciocalteu
TEAC Trolox equivalent antioxidant activity
FRAP Ferric ion reducing antioxidant power
CUPRAC Cupric reducing antioxidant capacity
ORAC Oxygen radical absorbance capacity
TRAP Telomeric repeat amplification protocol
TPCs Total phenolic compounds
DNA Deoxyribonucleic acid
CVD Cardiovascular disease
MRS Man Rogosa Sharpe Agar
PDA Potato Dextrose Agar
rpm Rotations Per Minute
L* Lightness
a* Redness
b* Yellowness
CCMY Cornelian cherry marmalade yoghurt
RHMY Rose hip marmalade yoghurt
CCM Cornelian cherry marmalade
RHM Rose hip marmalade
CY Control yoghurt
cP CentiPoises
aw Water activity
1. INTRODUCTION
The reactive oxygen species (ROS) such as singlet oxygen, hydroxyl radicals, hydrogen peroxide and superoxide anion, known to cause oxidative damage not only to macromolecules namely lipids, proteins and DNA but also to food systems. The reactive oxygen species plays an important roles in many degenerative diseases such as cancer, cardiovascular disease and age-related diseases (Rahman, 2003). In food systems the ROS can be formed by lipid oxidation and photosensitizers exposed to light (Boff and Min, 2002).
The oxidative stress or nitrosative stress caused by imbalance occurred between ROS or RNS and antioxidant. This imbalance occurred during antioxidant deficient diets or increased production of ROS or RNS by environmental toxins such as those caused by smoking or by inappropriate activation of phagocytes with chronic inflammatory disease (Halliwell, 1997).
Biologically antioxidant defined as any molecule capable of deactivation or stabilizing free radicals to protecting the body against oxidative damage and diseases. While The Food and Drug Administration (FDA) defined antioxidants only as dietary supplements to be taken in addition to normal food consumption in an effort to prevent diseases. Antioxidants can also be used as a form of preservatives to maintain freshness and extends shelf lives. Generally antioxidants divided into natural and synthetic antioxidants.
Natural antioxidants are present in natural sources such as fruits and vegetables. Where the Vitamin C, vitamin E, Vitamin A and the various of polyphenolic compounds such as flavonoids, anthocyanins and lycopene, they are considered as the most common natural antioxidants found in daily foods. While the synthetic antioxidants do not occur in nature they are synthesized chemically and added to food as preservatives to help prevent lipid oxidation (Shahidi et al., 1992) such as butylated hydroxyanisol (BHA), butylated hydroxytoluene (BHT), tertiary butyl hydroquinone (TBHQ). These compounds shown to have carcinogenic side effects by causing oxidative damage to DNA (Gould, 1995; Chun et al., 2006).
In recent years several researchers have attempted to fortify the poor food sources of antioxidants with rich natural sources antioxidants such as fortified yoghurt with rich natural sources antioxidants. Combination the original nutrients of yoghurt
and the beneficial effects of starter cultures with rich natural sources antioxidants makes it more convenient food format to satisfy consumers (Chouchouli, 2013). The fortified yoghurt with different type of fruits such as peach, orange, lemons, purple plum, boysenberry, strawberry, raspberry, blueberry, cherry (Chandan et al., 1993, 2006) in different forms such as jams, marmalade, fruit jellies, fruits drinks, fruit syrups and concentrated fruit as the good sources of antioxidants, represents an example of fortified poor sources with rich natural sources antioxidants in recent times. Where several study decides the secondary metabolites synthesised by plants such as polyphenols during normal development or as a responses to environmental stress, posses antioxidants activities acting as free radical scavengers, electron or hydrogen donors and strong metal chelators, prevent oxidations and thereby conceders as preventing agents against several degenerative diseases (Pezzuto, 2008; Williamson and Manach, 2005).
Turkey is considered to be an important producer of Cornelian cherries (Cornus mas L.). Approximately 12,800 tons of Cornelian cherries are produce annumly in Turkey (Kalyoncu et al., 2009; Çelik et al., 2006). According to many studies the Cornelian cherry fruit considered as a good source of anthocyanins and total phenols. The anthocyanins, flavonoids and especially tannins contribute to the total phenol content.
The genus Rosa contains over 100 species that are widely distributed mostly in Europe, Asia, the Middle East and North America (Nilsson, 1997). Rose hip (Cynosbati fructus) comprise of several biological active compounds, such as: sugars, organic acids, pectins, flavonoids, tannins, carotenoids, fatty acids, vitamins (particularly vitamin C and also vitamins B1, B2, K, PP, E), macro- and microelements (Pârvu, 2000; Demir and Ozcan, 2001; Tiţă, 2003; Stănescu et al., 2004; Arsenescu, 2008; Orhan et al., 2009). The nutrients and technological properties were determined in Rose hip fruits (rosehips) in order to investigate potential uses (Demir and Özcan, 2001 ). Rose fruits have long been used in Turkey for food, medicinal, and many other purposes and for several special traditional products such as Rose hip fruit juice, Rose hip jam, Rose hip marmalade, Rose hip pestil and Rose hip syrup (Ercisli and Guleryuz, 2005).
The present study was designed to prepared Rose hip and Cornelian cherry marmalade yoghurt by fortified yoghurt with different amount of marmalade (5, 10 and 15%) pre or post fermentation and determines their effects on yoghurt properties during 21 days, due to high antioxidant and nutritive resources.
2. LITERATURE REVIEW
The history of yoghurt goes back over six thousand years 6,000 BC when humans began milking domesticated animals. And put the excess milk in goatskin bags made from stomachs. During this method the milk coagulated to yoghurt when left in a warm place due to the activity of bacteria it has. By this way the milk was preserved longer and the taste and flavor impressed consumers. People continued the practice and spread yoghurt from Central Asia to the Middle East and Europe, as well as to America when Turkish immigrants brought yoghurt to North America in 1700s. The term of yoghurt refer to the Turkish verb, “jugurt” that means “to be curdled or coagulated” (Dairy Goodness, 2013; Tamime and Robinson, 1999).
Yoghurt is made by inoculating certain bacteria (starter culture), usually Streptococcus thermophilus and Lactobacillus bulgaricus, into milk. After inoculation, the milk is incubated at approximately 45°C until firm; the milk is coagulated by bacteria-produced lactic acid. Yoghurts may have additional cultures, sweetness, flavors, color additives, stabilizers, emulsifiers and preservative. Yoghurts may be heat-treated after culturing to extend the shelf life of the food.
The Food and Drug Administration (FDA) describes yoghurt as a food produced by culturing one or more of the basic ingredients (cream, milk, partially skimmed milk, skim milk, or the reconstituted versions of these ingredients may be used along or in combination) and any of the optional dairy ingredients with a characterizing bacteria (live and active) culture that contains the lactic acid-producing bacteria (Lactobacillus bulgaricus and Streptococcus thermophilus).
There are different varieties of yoghurt that can be categorized according to the physical and chemical nature, added flavors and post incubational processes.
Based on the chemical composition, yoghurt can be categorized into three major varieties namely, regular yoghurt, low-fat yoghurt and non-fat yoghurt. The regular yoghurt is produced from the whole fat milk which should contain at least 3.25% of milk fat (FDA, 2013). While the low-fat yoghurt and non-fat yoghurt are produced from low fat milk or partially-skim milk, and skim milk respectively.
Based on the physical nature of the product, yoghurt can be categorized into solid, semi-solid or fluid. Solid yoghurt or set yoghurt is a term given to the yoghurt incubated and cooled in the final packaging. On the other hand, the term of stirred yoghurt and fluid/drinking yoghurt given to semi-solid state and fluid nature yoghurt,
respectively. Stirred yoghurts are produced by incubating the mix in a tank followed by breaking by stirring prior to cooling and packaging (Dairy Consultant, 2013).
Based on the flavor of the product, Yoghurts can be categorized into plain-, fruit- and flavored yoghurt. Plain yoghurt, defined as the unsweetened fermented milk product containing no added color or any other additives (Dairy UK, 2009). Whereas the flavored yoghurt including vast array of flavors such as fruit (apple, apricot, black cherry, black currant, blue berry, lemon, mandarin, raspberry, strawberry, peach), cereal, vegetables, chocolate, vanilla, caramel, ginger (Goodness Direct, 2013).
On the other hand, the bio- or probiotic yoghurt refers to those made culturing beneficial microorganisms that claim to have numerous health benefits once ingested, typically the probiotic strains of Bifidobacteria and L. acidophilus. These probiotic strains are said to claim more specific health benefits and represent the types of friendly microflora present in the gut (Dowden, 2013).
Yoghurt is made with live and active cultures, so it has become a healthy lifestyle and plays an important role in health by promoting:
Help people who have lactose intolerant
Enhance the immune system
Reduce the osteoporosis risk
Help in reducing hypertension
Reduce the risk of cancer
In the world about 80% of adult population suffer maldigestion lactose. Many lactose maldigesters avoid milk and dairy products because of intestinal discomfort. The consumption of yoghurt allows them to benefit from a nutritionally dense food rich in calcium, proteins and vitamins, with fewer symptoms. Savaiano et al. (1984); Kolars et al. (1984); Martini et al. (1987) and many others have recorded that lactose maldigesters can digest lactose in yoghurt better than lactose in milk (Vitini et al., 2000).
The S. thermophilus and L. bulgaricus of yoghurt bacteria showed the capacity to modulate the immune system in animals (Perdigon et al., 1998; Vitini et al., 2000) and humans (Van de Water et al., 1999; Aldinucci et al., 2002).
The higher calcium bioavailability of yoghurt contributed in reducing the risk of hypertension, osteoporosis and cancer disease. The calcium bioavailability of yoghurt is higher than the milk itself. This attributed to the acidic pH of yoghurt that ionizes calcium and facilitates intestinal calcium absorption (Bronner and Pansu, 1999; Unal et
al., 2005). Which reduce the inhibitory effect of dietary phytic acid on calcium bioavailability (Adolfsson et al., 2004).
Cancer is a complex genetic disease that is caused primarily by environmental factors. The cancer-causing agents (carcinogens) can be present in food and water, in the air, and in chemicals and sunlight that people are exposed to. In 1996 there were 10 million new cancer cases worldwide and six million deaths attributed to cancer. There have been predictions that by the year 2020 there will be 20 million new cases and 12 million deaths.
Recently there are a lot off terms used by chemists, physicists, biologists, and researchers in a variety of scientific issues and discussions such as reactive oxygen species (ROS), reactive nitrogen species (RNS), oxidative stress, oxidative damage, free radical, and antioxidant.
Both of reactive oxygen species and reactive nitrogen species playing a dual role as deleterious and beneficial species, since they can be either harmful or beneficial to living systems (Valko et al., 2006).
Reactive oxygen species defined as the crucial product where produce from molecular oxygen by living organisms as a result of normal cellular metabolism. They play important roles in biological function at normal concentrations, but at high concentrations, they produce adverse effects to biological cell components, such as lipids, proteins, and DNA (Valko, 2006; Wang, 1996).
There are two sources of oxidants, endogenous oxidants sources and exogenous oxidants sources. The endogenous oxidants sources including mitochondria, endoplasmic reticulum, peroxisomes, phagocytes and cell membranes. While the exogenous oxidants sources include cigarette smoke, ozone exposure, hyperoxia, ionizing radiation and heavy metal ions. The oxidant sources compounds may be described as free radicals or unradicals sources.
The free radicals sources defined as any molecules containing one or more unpaired electrons and giving reactivity to the molecule such as superoxide anion (O2-.),
hydroxyl radical (.OH), Hypochlorous acid (HOCL), Peroxyl radicals (ROO.), Hydroperoxyl radical (HOO.) and hydrogen peroxide (H2O2). While the unradicals
molecule defined as any two free radicals share their unpaired electrons (Halliwell et al., 1995).
The endogenous factors contribute in produce ROS by many way. In addition to original cigarette content from free radicals and organic compounds, the smoke
cigarette activates some endogenous ROS mechanisms, Church et al. (1985) as well as the higher oxygen levels than normal pressure of oxygen in the body tissues and lungs cause increased production of reactive oxygen so called Hyperoxia (Comhair et al., 2000; Matthay et al., 1999). The ionizing radiation and heavy metal ions in the presence oxygen can induce generation of reactive radicals.
Under normal conditions, there are a balance between the oxidant species and the intracellular levels of the antioxidants. This balance is essential for the survival of organisms and their health. While the overproduction of reactive nitrogen(RNS) species (nitrosative stress) and reactive oxygen species (oxidative stress) up to the system’s ability to neutralise and eliminate them lead to reactions that can alter the structure of proteins, lipids and nucleic acids, thereby causeing the carcinogenesis, aging and atherosclerosis disease (Yagi, 1987; Cutler, 1984-1992).
The mechanisms defences against oxidative stress in biological system including:
preventative mechanisms
repair mechanisms
physical defences
and antioxidant defences
The antioxidant defences divided into two categories, the enzymatic antioxidant defence and the non-enzymatic antioxidants defence (low – molecular-weight antioxidants).
The enzymatic antioxidant defences include superoxide dismutase (SOD), glutathione peroxidase and catalase. But the non-enzymatic antioxidants are represented by waste products (e.g., uric acid), synthesized by the cell (e.g., histidine di-peptides: carnosine, homocarnosine, glutathione) and dietary sources (e.g., ascorbic acid, tocopherol, carotenoids, polyphenols, flavonoids).
In food system the oxidation affects in all quality of food characteristics such as flavour, color, odor, texture causing impaired in nutritive value and safety of foods. All the components of foods exposed to oxidizing. But the lipid oxidation is a major cause of deterioration foods, where unsaturated fatty acids reacting with molecular oxygen via a free radical chain mechanism, form fatty acyl hydroperoxides, generally called peroxides or primary products of the oxidation (Gray, 1978). The primary auto-oxidation is followed by a series of secondary reactions which lead to the degradation of the lipid and the development of oxidative rancidity.
Many researchers have been trying to identify how dietary antioxidants sources promote animal and human health. The researchers decided that the plants defends themselves from environmental extremes, deter pest attacks or the injure leaf or fruit produces several compounds, such as pigments and antioxidants. In addition to the secondary metabolites such as enzymes, are produced by plants to regulate physiology and patterns of plants growth (Daniel et al., 1999). Where many but not all secondary plant metabolites are antioxidants. These compounds play a protective role at pre and post harvested and so extends the shelf lives (Daniel et al., 1999).
The balance of the antioxidants in the human body comes from food. All dietary sources of antioxidants come from secondary plant metabolites. Some are polyphenols; other important ones are not, like alpha- and beta-carotene and lycopene.
These important carotenoid antioxidants lack the phenolic ring structures that characterize polyphenols. In another way the grass, forage, and grains consumed by cattle contributed in antioxidants in milk as well as in dairy products. Where the amount of antioxidants in milk and dairy products considered as the trace amount. For example the yoghurt considered as the most important source of nutrition in the world due to high content of fat, protein, carbohydrate, calcium, phosphorus, vitamins and minerals (McKinley, 2005). But not considered as the rich source in phenolic and antioxidant compounds. The researchers has begun to introduce some types of fruit to yoghurt, to enhancing the antioxidant activity of yoghurt as well as flavouring yoghurt, health promotion, increase demand of consumers and fulfill nutritional needs. These strategy investigated by a number of researchers in different parts of the world (Desai et al., 1994; Shukla et al., 1987). For instance, yoghurt with fruit, yoghurt with fruit on bottom and blended yoghurt with fruit were introduced in 1937, 1947 and 1963 respectively (Danone, 2013; Dairy Goodness, 2013).
Introduce many types of fruit to yoghurt improve the nutritive value by increase the antioxidant activity, bioactive compounds or edible fibers, minerals and vitamins. These compounds improve health conditions and reduced risks of various types of diseases such as cancer, CVD, hypertension and possibly delayed onset of age related indicators. But some types of fruits at certain concentrations appeared not acceptable when combined to yoghurt, other types appeared more antioxidant activity from another, as well as some antioxidant content types affected with stage added to yoghurt, for these reasons there are many studies that appeared to be about the fruit fortified yoghurt and their effects on physicochemical, microbiological and antioxidant activity.
By the used of different methods for antioxidant activity analysis based on spectrophotometric, such as the determination of total phenolic content with the folin ciocalteu (FC) assay, the trolox equivalent antioxidant activity (TEAC), scavenging activity toward stable free radicals (DPPHand ABTS.), reduction of metal ions (FRAP and CUPRAC assays) and competitive methods (ORAC and TRAP) (Magalhâes, 2008; Vasilescu, et al., 2012). Where Açıkgözoğlu (2008) compared between pomegranate and sour cherry and mentioned that yoghurt fortified with pomegranate juice concentrate was higher antioxidant capacity than that fortified with cherry juice concentrate.
Dongxiao sun et al. (2012-2013) studied the effects of stage fermentation on the yoghurt fortified with berry and apple polyphenols before and after fermentation with high or low methoxy pectin, result shows that the type of polyphenols and pectin affect on the total extractable PP content (TEPC), polyphenols (PP) profiles, viscosity, storage modulus of yoghurt, colony number and morphology of the starter cultures but adding fruits polyphenols before fermentation produced yoghurts with great TEPC and more polar PPs than adding post-fermentation.
Desai SR et al. (1994) concluded the 20% of mango pulp and pineapple juice may be added satisfactorily to yoghurt. While the sapota pulp, papaya pulp and kokum juice shows no satisfactorily effect on yoghurt.
Çelik et al. (2006) examined the physicochemical and organoleptic properties of yoghurt fortified with different ratio from Cornelian paste and sugar and suggested yoghurt with 10 kg/100 kg fruit paste and 10kg/100 kg sugar was more acceptable than other ratio. Öztürk and Öner (1999), suggested that sweetness and consistency of yoghurt developed when addition 10% of grape juice (CGJ) to yoghurt. While the addition 2.5, 5.0, 7.5 and 10.0% mulberry pekmez (MP) into milk by Çelik and Bakirci (2003) led to an increase in the fermentation time and a decrease in the viscosity of the yoghurts.
Çon et al. (1996) reported the addition of fruit had no significant effect on the total bacteria and coliform counts.
Tarakçı (2010) studied the influence of kiwi marmalade on the rheology characteristics, color values and sensorial acceptability of fruit yoghurt and proved that yoghurt containing kiwi marmalade was acceptable with respect to overall acceptability. Küçüköner and Tarakçi (2003) fortified yoghurt with different fruit-flavors (Cornelian, Morello Chery and Rose hip marmalade, grape molasses and date pulp) at 7% w/w and
reported that yoghurt containing Grape molasses and Morello had higher flavour scores than using other flavours.
In Turkey approximately 12,800 tons of Cornelian cherries is produce annumly (Kalyoncu et al., 2009; Çelik et al., 2006). Twenty-five rose species has been reported in different region of Turkey (Ercisli, 2005). The fruits are commonly used to make jam, marmalade, fruit juice. (Uggla and Nybom, 1999); while the dried fruits and roots are excellent for making tea (Sen and Gunes, 1996).
In recent years the researchers attention have been drawn to lesser known fruits which is combine with yoghurt product, such as Cornelian and Rose hip fruits. Which possess the nutritive, antibacterial, anti-allergic, antimicrobial and antioxidants properties. The Cornelian cherry posses unusual flavour, rich in anthocyanins, as well as used for treatment of gastrointestinal disorder and diarrhoea (Celik et al., 2006).
Several Cornus spp. have been used to improve liver and kidney functions, and to feature antibacterial, antihistamine, antiallergic, antimicrobial, antimalarial and antidiabetic properties (Tural and Koca, 2008; vareed et al., 2006). According to several investigations of physical and chemical properties of Cornelian fruits (Pawlowska et al., 2010) the main anthocyanins were cyaniding and pelargonidin 3-O-glycosides and among flavonoids quercetin, kaempferol and aeomadendrin 3-O-glycosides (Bijelić et al., 2011).
In the scientific literature, the vitamin C content in Rose hips is reported to far exceed the one found in citrus fruits (Ercisli and Esitken, 2004).
Rose hips are known to have the highest vitamin C content (30–1300 mg/100 g) among fruits and vegetables (Ziegler et al., 1986). In addition, Rose hips contain other vitamins and minerals, carotenoids, tocopherols, flavonoids, fruit acids, tannins, pectin, sugars, organic acids, amino acids and essential oils (Chai, 1995; Ercisli, 2007 ).
Indigenous traditional knowledge and western science have revealed its potential for significant nutritional and therapeutic benefits among natural antioxidants (Yi, 2007). Rosa hips, is well-known for its high phenolic contents. These compounds are known to have antioxidant, antimutagenic and anticarcinogenic effects.
For this reason the use of Cornelian Cherry and Rose hip in yoghurt manufacture has been increasingly attempted. To utilize these fruits in developing antioxidant yoghurt content.
3. MATERIALS AND METHODS
3.1. Materials
The standardized (total solid and fat) and pasteurized milk (85°C for 30min) taken from ENKA Dairy Factory in Konya/Turkey. The commercial freeze-dried yoghurts starter cultures (S. thermophilus and L. d. bulgaricus) taken from Chr's Hansen-Peyma Factory in Istanbul/Turkey. Cornelian Cherry and Rosehip fruits was collected from Konya regain in Turkey. The chemical materials and resources needed such as Folin-Ciocalteu (FCR), 2,2-diphenyl -1-picrylhydrazyl (DPPH), 2,2'-azino-bis(3-ethylbenzothiazoline-6-sulphonic acid) (ABTS), phosphate buffer saline, Sodium carbonate (Na2CO3), culture M-17 Agar (7.2±0.2, Merck KGaA, Darmstadt, Germany),
culture de Man Rogosa Sharpe Agar (MRS) (5.7 ±0.2, Merck KGaA, Darmstadt, Germany) and culture acidified Potato Dextrose Agar (PDA) (Merck KGaA, Darmstadt, Germany) providing by laboratory of selçuk University.
3.2. Methods
3.2.1. Cornelian cherry and rosehip marmalade preparation
The Cornelian Cherry and Rosehip fruits was collected from Konya regain in Turkey. After that the fruits washed and the inedible parts were removed manually. To prepared marmalade 50% fruit mixed with 50% sugar, the mix boiled for 5 minutes and filled directly into clean glass jars. Marmalade was stored in a room temperature until use in yoghurt production.
3.2.2. Yoghurt preparation
Yoghurt was prepared according to Tamime and Robinson (1985). The standardized (total solid and fat) and pasteurized milk (85°C for 30min) taken from ENKA Dairy Factory in Konya/Turkey. The milk was heated at 44±1°C and inoculated with 2% commercial freeze-dried yoghurts starter cultures (S. thermophilus and L. delbrueckii ssp. bulgaricus) (Chr's Hansen-Peyma Istanbul). After that for set yoghurt type the inoculated yoghurt milk divided into four portions one of them take control and
the others fortified with different percentage of marmalade 5, 10 and 15%. All yoghurt portions are incubated at 43±1 °C until pH 4.6, while for stirred yoghurt type the marmalade added after cooling yoghurt to 10°C. All yoghurt type stored at 4°C for further analysis.
3.2.3. Yoghurt analysis
The phenolic compounds and antioxidant activity (AOC) assay are used to determine the effects of Cornelian cherry and Rose hip marmalade added to yoghurt. Whereas the physicochemical and microbiological analysis were used to determined the physicochemical and microbiological properties of marmalade yoghurt during 21 days of storage period.
3.2.4. Total phenolic content assay (TPCs)
The total phenolic compounds in yoghurt were determined by using the modified method of Shetty et al. (2005). One ml of yoghurt sample (1ml) mixed with 1.0 ml of 95% ethanol and 5ml of distilled water. After that 0.5ml Folin-Ciocalteu diluted reagent (1:1, Folin-Ciocalteu: distilled water) were mixed and left to stand for 5 minutes in room temperature. 1ml of 5% Sodium carbonate (Na2CO3) was added to the reaction
mixture and the reaction mixture was incubated for 1 hour in room temperature. After that the absorbance was read at 725nm, the values were converted to total phenolics and expressed as (mg gallic acid equivalent/ ml yoghurt).
3.2.5. Antioxidant activity (AOC) assay
3.2.5.1. Extraction of yoghurt samples
The samples were measured after water had been extracted from yoghurt. For this purpose, 3 g yoghurt mixed with suitable amount (30ml) of methanol dilution (80:20, methanol: distilled water). After that the mix homogenized by ultra-turrax
homogenizer and centrifuged to 7200 rpm for 10 min at 24°C. The filtered liquid portion through (Whatman No.1) stored at 4˚C for antioxidant activity analysis.
3.2.5.2. DPPH assay
The measurement of the DPPH radical scavenging activity was determined by using the modified method of Shetty et al. (1995). By a mixed 100μl of extraction sample with 2ml of dilute DPPH radicals. The mix was kept for 30 minutes in a dark room temperature. After that the absorbance was monitored at 517 nm. The reading was used to calculate the inhibition % of DPPH oxidation as (Apostolidis et al., 2007).
Inhibition % = ( A Control(517) – A Extract(517)/ A Control(517)х 100.
3.2.5.3. ABTS assay
The measurement of the ABTS radical scavenging activity were determined by using the modified method from the original method of Re et al. (1999). This assay made by mixed 7mM ABTS (2,2 '-azino-bis 3-ethylbenzothiazol-6-sulfonic acid) with 2.45 mmol Lˉ1 of potassium persulfate and put it in the dark for about 12-16h. And the resultant solution was diluted with phosphate buffer saline (PBS) to obtain absorbance (0.700±2). After that the ABTS dilution mixed with different concentrations of yoghurt extraction samples, where the reaction was monitored over 6 min and the reading measured at 734nm. The reading converted to trolox equivalent antioxidant capacity (TEAC) and the results expresses as mM trolox equivalent /g yoghurt.
3.2.6. Physicochemical analysis
3.2.6.1. Moisture analysis
Moisture content of yoghurt determined by taken 10g from yoghurt samples and placed it in oven at 105˚C for 3h. After that take reading at constant weight. The moisture content expressed as the percentage (%) of the dry weight of sample (AOAC, 1995).
3.2.6.2. Total solids analysis
The weight of the residue obtained from moisture content analysis expressed as percentage total solids by using this formula:
Total solids (%) = (Weight of dish + dry yoghurt) - (weight of dish)/(weight of sample ) х100.
3.2.6.3. Solids not fat analysis
This parameter was calculated by arithmetic difference between the values of total solids and the value of fat.
3.2.6.4. Determination of ash content
The ash content of each yoghurt samples was determined at 550˚C according to AOAC (1995). The ash content is expressed as the inorganic residue left as a percentage of the total weight of yoghurt incinerated.
3.2.6.5. Fat analysis
The Gerber method analysis was used to determine the fat content in yoghurt (AOAC, 1984).
3.2.6.6. Protein analysis
The kjeldahl method analysis was used to determine the total protein content of yoghurt (AOAC, 1990).
3.2.6.7. Water activity analysis
AQUALAB (Model Series 3TE, DECAGON) apparatus was used to determine the water activity of the samples (AOAC, 1984).
The pH was determined after calibrating the pH meter (WTW 315i Set brand) with buffer standards of pH 4.01 and pH 7.0. 20ml taken from diluted sample (1:1, yoghurt: distilled water) and stirred uniformly about 2-3 minutes, after that the sample measured by insert probe of the pH meter into sample. The probe rinsed thoroughly with distilled water before use on sample (Metin, 2008).
3.2.6.9. Determination of titratable acidity
The titratable acidity was measured by titrating 10ml of yoghurt dilution (10g yoghurt mix with 10ml distil water) with 0.1 M sodium hydroxide, until the substance reach a pH value 8.2. The spend NaOH volume recorded and the titratable acidity was expressed in the terms of % lactic acid AOAC procedure (Helrich, 1990).
3.2.6.10. Syneresis analysis
Syneresis of analyzed yoghurt determined by putting filter paper on the top of a funnel, after that spread approximately 100g from the samples on the paper. The drainage time and temperature degree was 2h at 4˚C. The percentage of syneresis calculated as (liquid weight/initial sample weight) х 100 (Farooq and Haque, 1992).
3.2.6.11. Water holding capacity analysis
Approximately 10g of yoghurt placed in test tube and centrifuged at 5000rpm for 20 minutes at 4˚C, the WHC expressed as (clear supernatant/ initial weight) х 100. Each treatment replicated 3 times (Çelik and Bakırcı, 2003).
3.2.6.12. Viscosity analysis
Viscosity evaluated just during 1st and 21st day at 25˚C with Brookfield model rotational viscometer (Lab Line, Model no. 4535, Lab Line Instruments, Inc., Melrose Park, ILL., UK, Appropriate spindle no. 7). Each result recorded in centipoise (cP) after 1min rotation.
3.2.6.13. Color measurement
Chroma meter CR-400 (Konica Minolta, Inc., Osaka, Japan) was used to measure the color of yoghurt samples. Chroma meter was calibrated by a use of white tile reference standard. The yoghurt put into optically flat glass dish for measure. Three readings was taken from each sample of yoghurt. Where L* (lightness; 100 = white, 0 = black), a*(redness; ±, red; green), and b*(yellowness; ±, yellow; blue) (Pinho et al., 2004) .
3.2.6.14. Sensory analysis
The common flavor, appearance, color, body and texture of all yoghurt samples evaluated sensorial by a trained panel of seven members using nine-point score system (1. Very bad, 2. Bad, 3.imperfect, 4. Sufficient, 5. Mediocre, 6.satisfactory, 7. Good, 8. Very good, 9. Excellent) (Obi et al., 2010).
3.2.7. Microbiological analysis
Microbiological enumeration of yoghurts were carried out at 1, 7, 14 and 21 days. The count of S. thermophilus were determined by aerobic incubated of culture M-17 Agar (7.2±0.2, Merck KGaA, Darmstadt, Germany) at 37°C. While the L. delbrueckii ssp. bulgaricus were estimated by anaerobic incubated of culture de Man Rogosa Sharpe Agar (MRS) (5.7 ±0.2, Merck KGaA, Darmstadt, Germany) at 37°C for 48h (Dave and Shah, 1996). Testing for Yeast and moulds make according to standard methods by using acidified Potato Dextrose Agar (PDA) (Merck KGaA, Darmstadt, Germany) (Marth, 1978). Each medium freshly prepared before each trial. Serial dilutions of the samples made in sterile peptone water then transferred into plates.
3.2.8. Statistical analysis
4. RESULTS AND DISCUSSIONS
4.1. The results and discussions of physicochemical properties of Cornelian cherry and Rosehip marmalade yoghurt.
4.1.1. The results of fat, protein, moisture, ash, total solid and solid not fat analysis The fat, protein, moisture, ash, total solid and solid not fat (%) of Cornelian cherry marmalade yoghurt (CCMY) and Rose hip marmalade yoghurt (RHMY) were determined and compared to plain yoghurt in the first day of storage period as shown in Tables 1.1. and 1.2.
The fat and moisture decreased with increased in the concentration of Cornelian cherry (CCM) and Rose hip marmalade (RHM), due to the lowest fat content of CCM and RHM. The CCM and RHM richer in the total solid and the solid not fat compared to milk. That way the solid not fat increased gradually by increased in marmalade concentrations as shown in Tables 1.1. and 1.2. Similar results reported by Vernam and Sutherland (1994).
The protein and ash contents of CCMY and RHM increased by adding CCM and RHM. The increased of protein and ash contents of CCMY and RHMY due to increased in CCM and RHM, maybe attributed to the activity of microorganisms that is present in yoghurt in degraded fermentable sugars present in CCM and RHM into amino acids (Mahmood et al., 2008).
Table 1.1. The effect of CCM concentrations on chemical composition of CCMY.
CCMY: Cornelian cherry marmalade yoghurt, CY: control yoghurt, MC: marmalade concentrations, SNF: solids not fat, TS: total solids.
Yoghurt type CY CCMY Parameter Stir Set Stir Set 0 0 15 10 5 15 10 5 MC(%) 3.19 3.20 2.22 2.44 2.87 1.87 1.95 2.80 Fat (%) 3.79 3.78 3.92 3.85 3.80 3.94 3. 90 3.87 Protein (%) 0.84 0.86 1.10 0.88 0.85 1.11 0.90 0.89 Ash(%) 85.72 85.93 80.19 82.94 82.47 79.97 81.66 82.21 Moisture (%) 11.09 10.87 18.06 15.9 14.66 18.16 16.1 14.99 SNF(%) 14.28 14.07 19.81 18.05 17.53 20.03 18.34 17.79 TS(%)
Table 1.2. The effect of RHM concentrations on chemical composition of RHMY.
RHMY: Rose hip marmalade yoghurt, CY: control yoghurt, MC: marmalade concentrations, SNF: solids not fat, TS: Total solids.
4.1.2. The results of pH measurement
pH values were determined during 21 days of storage period. CCMY and RHMY shown significant decreased (P<0.01) in pH value during storage period. While the stirred and set type of CCMY and RHMY shows no significant difference in pH value as shown in Table 2.1.
Yoghurt type CY RHMY Parameter Stir Set Stir Set 0 0 15 10 5 15 10 5 MC(%) 3.19 3.20 1.9 2.5 3.02 2.2 2.7 3.05 Fat (%) 3.70 3.69 3.88 3.75 3.72 3.80 3. 77 3.74 Protein (%) 0.85 0.83 1.07 0.90 0.89 1.05 1.03 1.01 Ash(%) 85.72 85.93 81.44 81.99 82.94 80.79 81.75 82.78 Moisture (%) 11.09 10.87 16.66 15.51 14.04 17.01 15.55 14.17 SNF(%) 14.28 14.07 18.56 18.01 17.06 19.21 18.25 17.22 TS(%)
Table 2.1. The effect of storage period on the pH values of CCMY
and RHMY.
The(A,B,C,D) letters in the data have statistical significant difference (p< 0.01) between storage period of each yoghurt type (set&stirred). CCMY: Cornelian Cherry Marmalade Yoghurt, RHMY: Rose Hip
Marmalade yoghurt.
The decreased of pH values of marmalade yoghurt during storage period as shown in Figure 1.1. occurred gradually up to 21 days for all yoghurt samples. Similar results reported by Öztürk and Öner (1999); Moon et al. (1993). When observed that the pH value decreased during storage period at 4°C for 21 days. This decreased of pH value attributed to the consequence of fermentation of lactose by bacteria to lactic acid and galactose. In addition to the use sugar and organic acids of yeasts (Kailasapathy et al., 2008; Vargas et al., 2008). The stirred yoghurt type shows more decreased in pH value compare to set yoghurt type but this decreased is not significant.
pH Storage period (days) Yoghurt type 4.00±0.01A 1 CCMY ( Set) 3.97±0.02B 7 3.92±0.12C 14 3.89±0.05D 21 3.99±0.04A 1 CCMY (Stirred) 3.95±0.10B 7 3.91±0.05C 14 3.88±0.01D 21 4.05±0.02A 1 RHMY (Set) 4.03±0.11B 7 3.97±0.10C 14 3.95±0.09C 21 4.04±0.02A 1 RHMY (Stirred) 4.01±0.02B 7 3.95±0.00C 14 3.93±0.08D 21
Figure 1.1. The changes in pH values of CCMY and RHMY during storage period.
Stir: stirred, CCMY: Cornelian Cherry Marmalade Yoghurt, RHMY: Rose Hip Marmalade Yoghurt.
The CCM and RHM added ratios affected the pH values significantly as shown in Table 2.2.
Table 2.2. The effect of CCM and RHM concentrations on pH values of CCMY
and RHMY.
A,B,C,D: The letters in the data have statistical significant difference (p< 0.01) between storage period of each yoghurt type (set&stirred).
CCMY: Cornelian Cherry Marmalade Yoghurt, RHMY: Rose Hip Marmalade yoghurt, CY:control yoghurt.
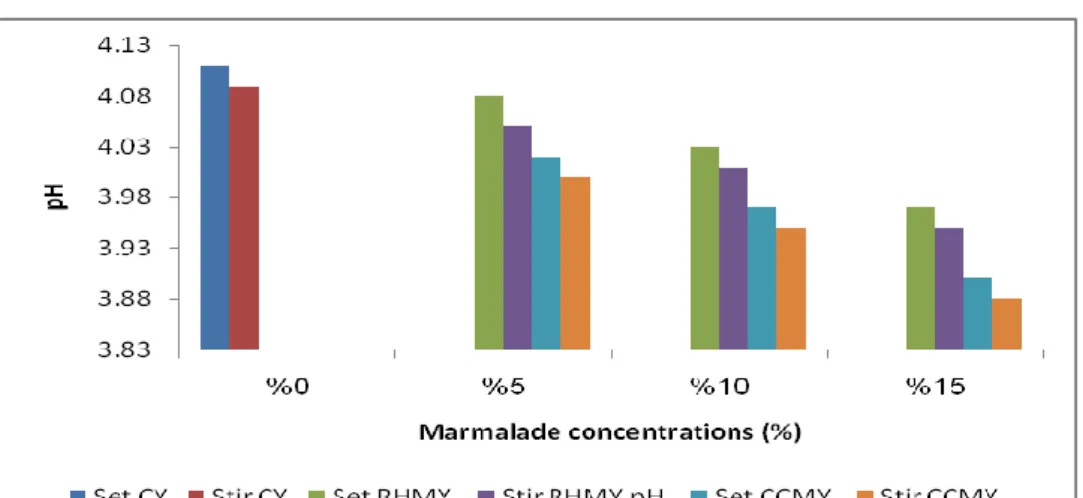
pH pH Concentrations (%) Yoghurt type RHMY CCMY 4.11±0.03A 4.11±0.02A 0 Set 4.08±0.05B 4.02±0.01B 5 4.03±0.20C 3.97±0.01C 10 3.97±0.07D 3.90±0.02D 15 4.11±0.04A 4.09±0.05A 0 Stirred 4.05±0.01B 4.00±0.1B 5 4.01±0.1C 3.95±0.08C 10 3.95±0.09D 3.88±0.05D 15
The decreased in pH ocurred in all yoghurt samples as shown in Figure 1.2. Where the decreased of pH in yoghurt fortified with 5, 10 and 15% CCM and RHM occurred respectively. Where the 15% marmalade yoghurt showed lowest pH value and the plain yoghurt shown the highest value compared to others treatment samples. Similar results reported by Tarakçı (2010) when yoghurt is fortified with different ratios of kiwi marmalade.
Figure 1.2. The changes in pH values of CCMY and RHMY due to different marmalade concentrations.
Stir: stirred, CCMY: Cornelian Cherry Marmalade Yoghurt, RHMY: Rose Hip Marmalade Yoghurt, CY: Control Yoghurt.
4.1.3. The results of titratable acidity measurement
The CCMY and RHMY show significant increased in acidity (P<0.05) with progress storage period as shown in Table 3.1.
Table 3.1. The effect of storage period on the acidity of CCMY and
RHMY.
The (a,b,c,d) letters in the data have statistical significant difference (p< 0.05) between storage period of each yoghurt type (set&stirred).
CCMY: Cornelian Cherry Marmalade Yoghurt, RHMY: Rose Hip Marmalade yoghurt.
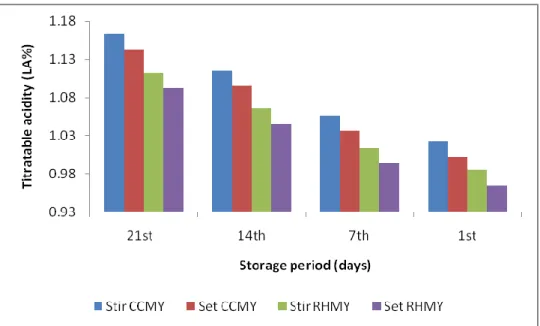
The increased of RHMY and CCMY acidity during storage period as illustrated in Figure 2.1. Maybe attributed to the activity of Lactobacillus delbrueckii subsp. bulgaricus and Streptococcus subsp. thermophilus during the post-acidification period, which produces lactic acid up to the availability of nutrients present in yoghurt. These results are compatible with Salji and Ismail (1983); Tarakçı and Küçüköner (2004); Çelik et al. (2006) results as reported significant increase in acidity along with storage.
Acidity Storage period (days) Yoghurt type 1.00±0.002d 1 CCMY ( Set) 1.03±0.020c 7 1.09±0.005b 14 1.14±0.001a 21 1.02±0.020d 1 CCMY (Stirred) 1.05±0.002c 7 1.11±0.010b 14 1.16±0.000a 21 0.96±0.100d 1 RHMY (Set) 0.99±0.015c 7 1.04±0.020b 14 1.09±0.003a 21 0.98±0.025d 1 RHMY (Stirred) 1.01±0.120c 7 1.06±1.02b 14 1.11±0.900a 21
Figure 2.1. The changes in titratable acidity of CCMY and RHMY during storage
period.
Stir: stirred, CCMY: Cornelian Cherry Marmalade Yoghurt, RHMY: Rose Hip Marmalade Yoghurt, CY: Control Yoghurt.
According to the marmalade added ratio there are significant increased acidity (P<0.05) in CCMY and RHMY as shown in Table 3.2.
Table 3.2. The effect of CCM and RHM concentrations on acidity of CCMY and RHMY.
The (a,b,c,d) letters in the data have statistical significant difference (p< 0.05) between storage period of each yoghurt type (set&stirred).
CCMY: Cornelian Cherry Marmalade Yoghurt, RHMY: Rose Hip Marmalade yoghurt.
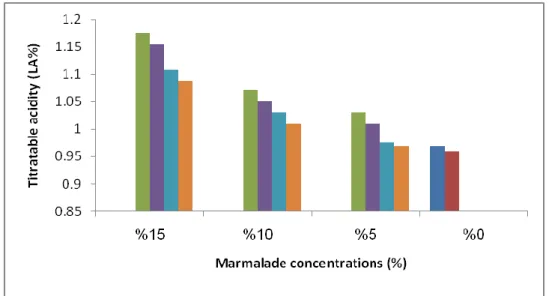
These results are compatible with Khalid Khan et al. (2008) results when fortified yoghurt with fruit pulp the acidity increased. As well as the stirred CCMY and RHMY show no significant difference in increased compared with set CCMY and RHMY as shown in Figure 2.2. While the CCMY show more increase in acidity than
Acidity Acidity Concentrations (%) Yoghurt type RHMY CCMY 0.95±0.006f 0.95±0.090h 0 Set 0.96±0.021f 1.03±0.005e 5 1.01±0.025d 1.07±0.010c 10 1.08±0.021b 1.17±0.020a 15 0.96±0.100f 0.96±0.002g 0 Stirred 0.97±0.050e 1.01±0.004f 5 1.03±0.002c 1.05±0.012d 10 1.10±0.001a 1.15±0.005b 15
RHMY. This maybe attributed to the highest acidity of CCM compared to RHM, the same result confirmed by Tarakçı and Küçüköner (2003) where the CCMY showed the lowest pH compared to other fruit yoghurt types.
Figure 2.2. The changes in titratable acidity values of CCMY and RHMY due to
different marmalade concentrations.
Stir: stirred, CCMY: Cornelian Cherry Marmalade Yoghurt, RHMY: Rose Hip Marmalade Yoghurt, CY: Control Yoghurt.
4.1.4. The results of syneresis and water holding capacity (WHC)
There were significant differences (P<0.05) in syneresis and WHC over 1, 7, 14 and 21 days as shown in Table 4.1.
Table 4.1. The effect of storage period on the syneresis and WHC of CCMY and RHMY.
The (A,B,C,D) letters in the data have statistical significant difference (p< 0.01) between storage period of each yoghurt type (set&stirred).
CCMY: Cornelian Cherry Marmalade Yoghurt, RHMY: Rose Hip Marmalade yoghurt.
The syneresis value of CCMY and RHMY increased gradually up to 14 days then decrease gradually as shown in Table 4.1. The decreased of WHC or increased whey separation(syneresis) maybe related to an unstable gel network and excessive re-arangements of a weak gel network (Lucey, 2001). Similar results were reported by Farooq and Haque (1992) and Küçüköner and Tarakçi (2003). The increased of whey separation in stirred yoghurt type more than in set yoghurt type. Maybe attributed to stirring yoghurt after cooling to 10°C.
WHC (%) Syneresis Storage period (days) Yoghurt type 83.91±0.52A 19.84±1.02G 1 CCMY ( Set) 82.57±0.25C 20.05±0.92F 7 81.54±0.47E 20.68±0.01D 14 81.75±0.62E 20.28±1.25E 21 82.99±0.58B 20.77±0.07D 1 CCMY (Stirred) 81.97±1.20D 20.98±0.58C 7 80.82±0.07F 21.59±1.02A 14 80.97±0.75F 21.13±1.20B 21 85.88±0.92A 14.70±1.12G 1 RHMY (Set) 84.87±0.25C 14.94±0.55F 7 83.85±0.52E 15.32±0.56D 14 83.97±0.55E 15.11±1.15E 21 85.57±0.21B 15.32±0.04D 1 RHMY (Stirred) 84.58±0.25D 15.81±1.02C 7 83.47±0.24F 16.21±0.30B 14 83.50±1.07F 16.00±0.25A 21
Fig 3.1. The changes in WHC (%) of CCMY and RHMY during storage period.
Stir: stirred, CCMY: Cornelian Cherry Marmalade Yoghurt, RHMY: Rose Hip Marmalade Yoghurt.
The addition of CCM or RHM to yoghurt caused a significant decreased (P<0.05) of syneresis values compared with CY as shown in Table 4.2.
Table 4.2. The effect of CCM and RHM concentrations on WHC of CCMY
and RHMY.
The (A,B,C,D) letters in the data have statistical significant difference (p< 0.01) between storage periodof each yoghurt type (set&stirred).
CCMY: Cornelian Cherry Marmalade Yoghurt, RHMY: Rose Hip Marmalade yoghurt.
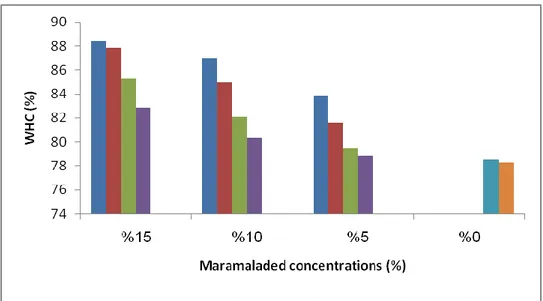
Yoghurt formulated with 5% showed the lower WHC, while the yoghurt formulated with 15% showed the higher WHC, even higher than the control yoghurt as
WHC (%) WHC (%) Concentrations (%) Yoghurt type RHMY CCMY 78.55±0.52G 78.55±0.85G 0 Set 83.80±0.25E 79.51±0.92E 5 86.97±0.32C 82.07±0.75C 10 88.44±0.48A 85.26±0.65A 15 78.30±0.74H 78.30±0.52H 0 Stirred 81.61±0.82F 78.85±0.64F 5 84.98±0.94D 80.35±0.85D 10 87.86±0.24B 82.86±1.02B 15
shown in Figure 3.2. This could be attributed to the capacity to absorb water by the solid and fiber of RHM and CCM, which has higher water-holding capacity (Garcίa-Pérez et al., 2005). The result agreement with Tarakci and Kücüköner (2003) and Şengül et al. (2014). As well as the stirring of yoghurts with CCM or RHM may have also contributed to greater syneresis in stirred type yoghurt compared with set type yoghurt.
Figure 3.2. The changes in WHC (%) of CCMY and RHMY due to different marmalade
concentrations.
Stir: stirred, CCMY: Cornelian Cherry Marmalade Yoghurt, RHMY: Rose Hip Marmalade Yoghurt, CY: Control Yoghurt.
4.1.5. The results of Viscosity
The viscosity of yoghurt was affected significantly (P<0.05) by both of the CCM or RHM ratios and the time of storage as shown in Table 5.1.
Table 5.1. The effects of CCM and RHM concentrations and storage period on the
viscosity of CCMY and RHMY.
The (A,B,C,D) letters in the data have statistical significant difference (p< 0.01) between storage periodof each yoghurt type (set&stirred).
CCMY: Cornelian Cherry Marmalade Yoghurt, RHMY: Rose Hip Marmalade yoghurt.
The viscosity of yoghurt samples decreased due to storage periodand marmalade added concentrations as shown in Figure 4.1. This maybe attributed to the decreased of water-holding capacity of protein (Calvo et al., 2001; Aryana et al., 2007; Öztürk and Öner, 1999). Yoghurt formulated with CCM and RHM show lower viscosity compared with control samples, in 1and 21 days of storage period. Similar results were reported by Çelik et al. (2006). Reduction in viscosity during storage are evaluated as common for fruit yoghurts by Akyuz and Coskun (1995) and similar results were found for yoghurt with concentrated grape juice by Öztürk and Öner (1999)
Viscosity cP Storage period (days) Viscosity cP Storage period (days) Yoghurt type 3526±1.25A 21&0% 6427±1.52A 1&0% CCMY ( Set) 2780±1.02C 1&5% 2 4650±1.64C 1&5% 1650±1.45E 1&10% 2 3070±1.45E 1&10% 1200±1.95G 21&15% 1890±1.94G 1&15% 3489±1.03B 21&0% 6326±1.52B 1&0% CCMY (Stirred) 2699±1.42D 21&5% 4450±0.98D 1&5% 1478±1.00F 1&10% 2 2980±1.02F 1&10% 1000±1.02H 21&15% 1650±1.57H 1&15% 3525±1.00A 21&0% 6425±0.87A 1&0% RHMY (Set) 2950±1.52C 21&5% 5001±0.85C 1&5% 1987±1.45E 21&10% 3450±0.95E 1&10% 1292±1.62G 21&15% 2250±1.05G 1&15% 3482±1.75B 21&0% 6324±1.00B 1&0% RHMY (Stirred) 2879±1.20D 21&5% 4950±0.54D 1&5% 1872±1.22F 21&10% 3250±0.85F 1&10% 1250±1.04H 1&15% 2 2100±1.00H 1&15%
and strawberry added yoghurt by Şengül et al. (2014). Consequently, the structures of CCMY and RHM can be improved by using stabilizing agents such as starches, gelatin or pectin.
Figure 4.1. The effects of CCM and RHM concentrations and storage period on
the viscosity of CCMY and RHMY.
Stir: stirred, CCMY: Cornelian Cherry Marmalade Yoghurt, RHMY: Rose Hip Marmalade Yoghurt.
4.1.6. The results of water activity (aw)
The significant decreased of water activity in CCMY and RHMY with increased the ratio of addition marmalade as well as the progress of storage period as shown in Tables 6.1. and 6.2. and Figures 5.1 and 5.2 maybe attributed to the increased the total solids level of marmalade yoghurt.
Table 6.1. The effect of storage period on the water activity ( aw) of CCMY
and RHMY.
The (A,B,C,D) letters in the data have statistical significant difference (p< 0.01) between storage period of each yoghurt type (set&stirred). CCMY: Cornelian Cherry Marmalade Yoghurt, RHMY:
Rose Hip Marmalade yoghurt.
Fig 5.1. The changes in water activity (aw) of CCMY and RHMY during storage period. water activity ( aw) Storage period (days) Yoghurt type 0.9758±0.23B 1 CCMY ( Set) 0.9723±0.00C 7 0.9673±0.02E 14 0.9633±0.05H 21 0.9765±0.01A 1 CCMY (Stirred) 0.9654±0.32F 7 0.9710±0.05D 14 0.9640±0.12G 21 0.9662±0.08B 1 RHMY (Set) 0.9648±1.20D 7 0.9626±1.02F 14 0.9612±0.98H 21 0.9681±1.08A 1 RHMY (Stirred) 0.9656±1.07C 7 0.9641±1.02E 14 0.9625±0.85G 21
Table 6.2. The effects of CCM and RHM concentrations on the water
activity (aw) of CCMY and RHMY.
The (A,B,C,D) letters in the data have statistical significant difference (p<0.01) between storage period of each yoghurt type (set&stirred).
CCMY: Cornelian Cherry Marmalade Yoghurt, RHMY: Rose Hip Marmalade yoghurt.
Figure 5.2. The changes in water activity (aw) of CCMY and RHMY due to different marmalade concentrations.
Where stir: stirred, CCMY: Cornelian Cherry Marmalade Yoghurt, RHMY: Rose Hip Marmalade Yoghurt, CY: Control Yoghurt.
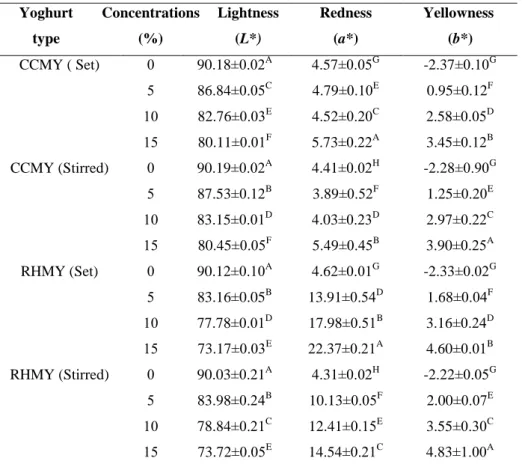
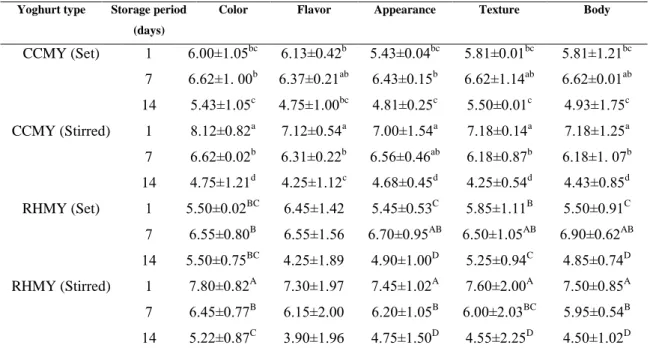
4.1.7. The results of color measurement
The L* (whiteness/darkness) and a* (greenness/redness) color values of all yoghurt samples decreased significantly (P<0.01) during 21 days of storage period. While the b* (yellowness/blueness) color values increased significantly (P<0.01) during storage period as shown at Table 7.1.
Table 7.1. The effect of storage period on the color of CCMY and RHMY. water activity ( aw) water activity ( aw) Concentrations (%) Yoghurt type RHMY CCMY 0.9805±0.85B 0.9805±0.05B 0 Set 0.9756±1.02D 0.9767±0.08D 5 0.9728±0.95F 0.9737±0.02F 10 0.9669±1.52H 0.9669±0.04H 15 0.9808±1.91A 0.9808±0.01A 0 Stirred 0.9763±1.00C 0.9772±0.34C 5 0.9733±1.02E 0.9742±0.05E 10 0.9672±1.00G 0.9680±0.12G 15
The (A,B,C,D) letters in the data have statistical significant difference (p< 0.01) between storage period of each yoghurt type (set&stirred).
CCMY: Cornelian Cherry Marmalade Yoghurt, RHMY: Rose Hip Marmalade yoghurt.
The stirred type marmalade yoghurt shown the highest lightness, redness and yellowness than the set type marmalade yoghurt as shown in Figures 6.1. and 6.2. and 6.3.
This maybe attributed to the affect of heat fermentation on the characteristics of phenolic compounds and pegiments.
Yellowness (b*) Redness (a*) Lightness (L*) storage period (days) Yoghurt type 1.03±0.01G 5.35±0.03A 85.37±0.05C 1 CCMY ( Set) 1. 08±0.02G 5.23±0.00A 84.97±0.02D 7 2.13±0.05D 5.11±0.21A 83.59±0.01F 14 2.58±0.01B 4.09±0.12B 83.49±0.02F 21 1.46±0.06F 4.31±0.52B 85.96±0.00A 1 CCMY (Stirred) 1.59±0.10E 4.18±0.22B 85.72±0.50B 7 2.25±0.11C 3.45±0.12C 85.02±0.04D 14 2.83±0.20A 3.40±0.21C 84.88±0.25CD 21 2.08±0.21G 14.68±0.11A 80.961±0.02C 1 RHMY (Set) 2.36±0.12F 14.54±0.01A 80.87±0.32C 7 2.99±0.91D 14.27±0.12A 81.21±0.25D 14 3.14±0.85C 13.29±0.01B 81.21±0.03D 21 2.43±0.83F 11.00±0.91C 81.86±0.04A 1 RHMY (Stirred) 2.79±0.80E 10.88±0.07D 81.71±0.05A 7 3.32±0.02B 10.83±0.05D 81.63±0.03A 14 3.77±0.04A 10.28±0.02E 81.54±0.01B 21
Figure 6.1. The changes in lightness of CCMY and RHMY during storage period.
Stir: stirred, CCMY: Cornelian Cherry Marmalade Yoghurt, RHMY: Rose Hip Marmalade Yoghurt, CY: Control Yoghurt.
Figure 6.2. The changes in redness of CCMY and RHMY during storage period.
Stir: stirred, CCMY: Cornelian Cherry Marmalade Yoghurt, RHMY: Rose Hip Marmalade Yoghurt, CY: Control Yoghurt.
Figure 6.3. The changes in yellowness of CCMY and RHMY during storage period. Stir: stirred, CCMY: Cornelian Cherry Marmalade Yoghurt, RHMY: Rose Hip Marmalade Yoghurt, CY: Control Yoghurt.
The b* (yellowness/blueness) and a* (greenness/redness) color values of all yoghurt samples increased significantly (P<0.01) by the increased of marmalade concentrations. While L* (whiteness/darkness) color values decreased significantly (P<0.01) by increased marmalade concentrations as shown in Table 7.2.
Table 7.2. The effect of CCM and RHM concentrations on the color of CCMY and RHMY.
The letters in the data have statistical significant difference (A,B,C,D): (p< 0.01) between storage period of each yoghurt type (set&stirred).
Where CCMY: Cornelian Cherry Marmalade Yoghurt, RHMY: Rose Hip Marmalade yoghurt, CY:control yoghurt.
The a* and b* changes during storage period observed in our study are consistent with Needs et al. (2000) and Scibisz et al. (2012). The conversion of the flavyliumcation of anthocyanin into colourless or yellowish forms maybe contributed to the increased in b* value at the last time of storage period (Scibisz et al., 2012). The CCMY and RHMY shows higher darker yellow and redness color with high degree of luminosity compared with plain yoghurt. Similar results were reported by Calvo et al. (2001).Where the difference in colors increased with increase in the marmalade concentrations as shown in Table 7.2.
4.2. The result of total phenolic compounds (TPCs)
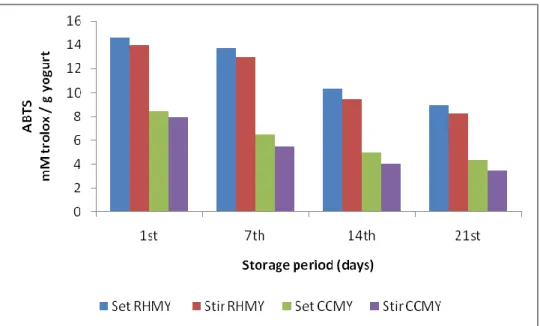
The phenolic content of CCMY and RHMY affected by the storage period. Where the phenolic compounds decreased significantly (P<0.01) in CCMY and RHMY during 21 days of storage periodas shown in Table 8.1.
Yellowness (b*) Redness (a*) Lightness (L*) Concentrations (%) Yoghurt type -2.37±0.10G 4.57±0.05G 90.18±0.02A 0 CCMY ( Set) 0.95±0.12F 4.79±0.10E 86.84±0.05C 5 2.58±0.05D 4.52±0.20C 82.76±0.03E 10 3.45±0.12B 5.73±0.22A 80.11±0.01F 15 -2.28±0.90G 4.41±0.02H 90.19±0.02A 0 CCMY (Stirred) 1.25±0.20E 3.89±0.52F 87.53±0.12B 5 2.97±0.22C 4.03±0.23D 83.15±0.01D 10 3.90±0.25A 5.49±0.45B 80.45±0.05F 15 -2.33±0.02G 4.62±0.01G 90.12±0.10A 0 RHMY (Set) 1.68±0.04F 13.91±0.54D 83.16±0.05B 5 3.16±0.24D 17.98±0.51B 77.78±0.01D 10 4.60±0.01B 22.37±0.21A 73.17±0.03E 15 -2.22±0.05G 4.31±0.02H 90.03±0.21A 0 RHMY (Stirred) 2.00±0.07E 10.13±0.05F 83.98±0.24B 5 3.55±0.30C 12.41±0.15E 78.84±0.21C 10 4.83±1.00A 14.54±0.21C 73.72±0.05E 15
Table 8.1. The effect of storage period on the TPC of CCMY and RHMY.
The (a,b,c,d) letters in the data have statistical significant difference (p < 0.05) between storage period of each yoghurt type (set&stirred).
CCMY: Cornelian Cherry Marmalade Yoghurt, RHMY: Rose Hip Marmalade yoghurt.
The decreased of phenolic compound during storage period as shown in Figure 7.1 maybe attributed to increasing milk protein-polyphenol interaction (Yuksel et al., 2010).
Figure 7.1. The changes in TPC contents of CCMY and RHMY during storage period.
Stir: stirred, CCMY: Cornelian Cherry Marmalade Yoghurt, RHMY: Rose Hip Marmalade Yoghurt, CY: Control Yoghurt.
Total phenolic compounds (TPC) Storage period (days) Yoghurt type 0.35±0.07a 1 CCMY ( Set) 0.29±0.05c 7 0.23±1.02e 14 0.21±1.21g 21 0.32±1.09b 1 CCMY (Stirred) 0.27±0.08d 7 0.21±0.05g 14 0.18±0.03h 21 0.47±0.10a 1 RHMY (Set) 0.40±0.02c 7 0.34±0.10e 14 0.30±0.10f 21 0.44±0.05b 1 RHMY (Stirred) 0.32±0.01d 7 0.28±1.25e 14 0.22±1.32g 21
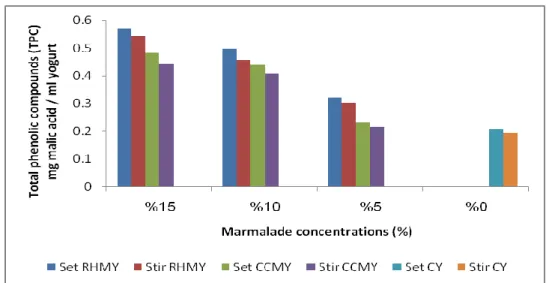
The phenolic compounds are increase significantly (P<0.01) by increased in the concentrations of marmalade ratios as shown in Table 8.2.
Table 8.2. The effects of marmamlade concentrations on the TPC of CCMY and RHMY.
The (A,B,C,D) letters in the data have statistical significant difference (p< 0.01) between storage periodof each yoghurt type (set&stirred).
CCMY: Cornelian Cherry Marmalade Yoghurt, RHMY:Rose Hip Marmalade yoghurt.
Similar results were reported by Karaaslan et al. (2011) when fortified yoghurt with grape and callus extracts; and Şengül et al. (2012) when added sour cherry to yoghurt. The highest amount of phenolic compounds shown in pre-fermentation of CCMY and RHMY (set type) as shown in Figure 5.1. The highest score of phenolic compounds were observed in set type yoghurt, this maybe attributed to the broken down or conjugated small molecules such as phenolic acids to a non-phenolic compounds of yoghurt content to make them more extractable or stable during fermentation (Sun-Waterhouse et al., 2011). While the phenolic compounds in post-fermentation of
Total phenolic compounds (TPC) Storage period (days) Yoghurt type 0.20±0.06G 0 CCMY ( Set) 0.22±0.02E 5 0.43±1.02C 10 0.48±0.85A 15 0.19±0.55H 0 CCMY (Stirred) 0.21±0.04F 5 0.40±0.42D 10 0.44±0.03B 15 0.20±0.01G 0 RHMY (Set) 0.31±0.74E 5 0.49±0.90C 10 0.57±0.01A 15 0.19±0.24H 0 RHMY (Stirred) 0.30±0.44E 5 0.45±0.82D 10 0.54±0.08B 15
CCMY and RHMY (stirred type) maybe not have broken down and still unstable. Although fortified yoghurt gradually decreasesduring the storage period, the phenolic compounds remained more than the plain yoghurt.
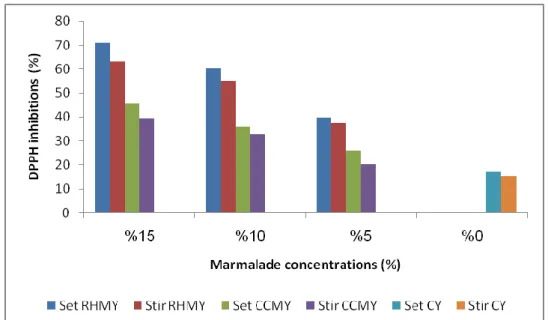
Figure 5.2. shows the phenolic compounds increased significantly by increased in the amount of marmalade added, where the highest score were observed in 15% marmalade addition compared with plain sample. Similar results reported by Zainoldin and Baba (2009) when fortified yoghurt with dragon fruit and by Şengül et al. (2012) when fortified yoghurt with sour cherry pulp.
Figure 7.2. The changes in TPC contents of CCMY and RHMY due to different marmalade
concentrations.
Stir: stirred, CCMY: Cornelian Cherry Marmalade Yoghurt, RHMY: Rose Hip Marmalade Yoghurt, CY: Control Yoghurt.