Selçuk J. Appl. Math. Selçuk Journal of Vol. 8. No.. pp. 83 - 99, 2007 Applied Mathematics
Design and Optimization of a Strategic Production-Distribution Model for Supply Chain Management: Case study of a plastic profile man-ufacturer in Turkey
Turan Pakoy1 , Hasan Kürsat Gules2 and Demet Bayraktar3
1Department of Industrial Engineering, Selçuk University, Konya, Turkey.
e-mail: tpaksoy@ yahoo.com
2Department of Production and Operations Management, Selçuk University, Konya,
Turkey.
e-mail: hkgules@ selcuk.edu.tr
3Department of Management Engineering, Istanbul Technical University, Istanbul,
Turkey.
e-mail: dem et.bayraktar@ itu.edu.tr
Received : September 11, 2007
Summary. Supply chain management concerns with the optimal flow of ma-terials and knowledge through overall production and distribution system from raw material suppliers to the last customers. In this paper, supply chain system of a plastic profile manufacturer in Turkey is modeled as a multi-echelon mixed integer linear programming model. The model lets decision maker reflect his supply policy and also includes the choice of the facilities (plants or distribution centers (DCs)) to be opened and design of network configuration with minimum total cost. The total cost involves supply cost (combination of purchasing cost and shipping cost from suppliers); transportation costs between plants and DCs; distribution cost between DCs and customer zones; fixed operating costs; and opportunity cost not have the material at the right time. The developed model is solved by a professional software package and the computational results are discussed.
Key words:Supply Chain Management; Production/Distribution System; Net-work Design and Optimization; Supply Chain Modeling; Mixed Integer Linear Programming.
1. Introduction
Supply Chain Management (SCM) has received considerable attention from academicians and practitioners during the last several decades. Design and op-timization of strategic production-distribution models for SCM is one of the
most popular problems in this research field. Generally, the problem is defined with following entities: (i) location of facilities (plants, distribution centers, etc.) to be opened; (ii) design of the network configuration; (iii) satisfy customer’s demand with minimization of the total cost including purchasing cost, trans-portation cost, fixed operating cost, etc. (Syarif et al., 2002; Yan et al., 2003; Min and Zhou, 2002).
In their pioneering paper, Cohen and Lee (1989) developed a deterministic, mixed integer, non-linear mathematical programming model. Objective func-tion of the model maximizes the total after-tax profit under resource, producfunc-tion and demand constraints. Output of the model determines global resource de-ployment policy for the manufacturing plants, distribution centers and customer regions.
Pyke and Cohen (1993) present a stochastic mathematical programming model for a tree-stage supply chain consisting of one manufacturing plant, one ware-house and one retailer. The model minimizes the total cost under a service level constraint and determines the economic reorder interval, replenishment batch sizes and the order-up-to levels. The model, however, does not consider multiple products and has only one manufacturing plant, one warehouse and one retailer, so failed to represent the complicated supply chain networks of the real world. Petrovic et al. (1999) consider a serial supply chain including inventories and production facilities between them in fuzzy environment. For each inventory, proposed fuzzy model determines the order quantities giving an acceptable ser-vice level of the supply chain at reasonable total cost. They use simulation techniques to examine the dynamics and performance of all the parts of the supply chain. As a result, it is claimed that uncertain customer demand and uncertain supply delivery along the supply chain have great impact on the be-havior of the supply chain. Although, the model deals multi-stage supply chain, it is confined to single-period, single-product problems.
Ganeshan et al. (2001) examine the sensitivity of supply chain performance to three inventory planning parameters: i) the forecast error, ii ) the mode of communication between echelons, and iii ) the planning frequency, by develop-ing a simulation model based on a case study. They show that all the three parameters have a significant effect on performance. Increasing forecasting er-rors and the re-planning frequency (for example, planning every quarter instead of every month) decreases service, return on investment, and increases cycle time. Using a mode of communication that facilitates exchange of information between echelons in the supply chain yields a higher level of service when com-pared to the scenario where the entities in different echelons plan material flows independently.
Sakawa et al. (2002), deal with a decentralized two-level integer programming problem in a housing material manufacturer having two kinds of third party logistic providers (3PLPs) to transport of products from its factory or warehouse to customers. There are two objectives in the housing material manufacturer; i) minimization of the transportation cost, ii ) minimization of the opportunity loss with respect to transportation time. The objectives of 3PLPs are to maximize their profits. The proposed interactive fuzzy programming approach derives a
satisfactory solution to the problem by taking into account not only the degree of satisfaction with respect to the objectives of the housing material manufacturer but also those of the 3PLPs. However, the model does not consider production constraints and failed to capture most of the entities (supplier, retailer, etc.) inherent in a global SCM.
Syarif et al. (2002) propose a minimum spanning tree based genetic algorithm approach for a multi-stage supply chain problem formulated by 0-1 mixed in-teger linear programming model. The efficacy and the efficiency of the method are analyzed by comparing its numerical experimental results with those of tra-ditional matrix-based genetic algorithm and a professional software package. Although experimental results show that the proposed algorithm can give bet-ter heuristic solutions than traditional genetic algorithm, the comparison with the performances of other meta-heuristic techniques (tabu search, simulated annealing etc.) are remained unanswered.
Yan et al. (2003) propose a mixed-integer programming model for supply chain design with consideration of bills of materials. They use logical constraints to represent bills of material and the associated relationships among the main entities of a supply chain such as suppliers, producers and distribution centers. Sundarraj and Talluri (2003) present a multi-period integer programming model to assist decision makers in the procurement of component based enterprise information technologies.
Jayaraman and Ross (2003) consider a mixed integer linear programming model to determine locations (for distribution centers and cross-docks) and distribution strategies in supply chain management. They propose a simulated annealing approach for the model which is characterized by multiple product families, a central manufacturing plant site, multiple distribution center and cross-docking sites, retail outlets, and evaluate the computational performance of the proposed approach under a variety of problem scenarios.
In this paper, supply chain system of a plastic profile manufacturer in Turkey is modeled by a multi-echelon mixed integer linear programming model. The model lets decision maker reflect his supply policy and also includes the choice of the facilities (plants or distribution centers (DCs)) to be opened and design of network configuration with minimum total cost. The total cost involves supply cost (combination of purchasing cost and shipping cost from suppliers); transportation costs between plants and DCs; distribution cost between DCs and customer zones; fixed operating costs; and opportunity cost not have the material at the right time.
The paper is organized in five sections. After the introduction where in some supply chain models are analyzed, the rest of the paper is structured as follows. The supply chain system of the plastic profile manufacturer is introduced in Section 2. Section 3 illustrates the supply chain model formulation. The model is solved by a professional software package and the results of the implementation are discussed in Section 4. Conclusions are presented in Section 5.
2. Buyer-supplier relationships in Turkey and supply chain system of the plastic profile manufacturer: The case study
Relationships between transacting partners in a supply chain network are often characterized as lying on a scale from traditional which is based upon adversarial features to collaborative partnership. Gules et al. (1997) mapped out a life cycle of the way the relationship changes between the buyers and suppliers based on the automotive industry one of the locomotive industries in Turkey.
The supportive type or phase of relationship represents the term before 1980, when the Turkish government opens the economy to international markets and ends its policy of import substitution. In the supportive phase, parts were mainly single sourced, but this was due to the limited number of suppliers rather than the reasons underlying today’s drive to single or dual source. The competitive phase (1981-1990) includes several structural reforms aimed at liberalizing the economy and integrating it into the global economy. As a result of these reforms, strong economic growth and success in reducing inflation have been observed. During this period, price/cost and quality of parts were the most important factors in sourcing decisions. Buyers tried to reduce costs by playing their suppliers off against each other. Thus, competition between suppliers was high and suppliers also have to compete with international suppliers.
In the quasi-collaborative phase (1991-1997), macroeconomic stability of the country has been spoilt by some political (weak coalition governments, etc.) and social (terror, corruption etc.) factors. In addition to these factors, it can be claimed that Turkey has been involved in globalization process without prepar-ing domestic macroeconomic stability appropriately. Thus, the effectiveness of the reforms was disappeared by interest rates of over %100, chronic inflation and a huge public debt. In this economic environment, nature of sourcing decisions has continued to evolve. Although quality has become the most important factor in choosing suppliers, price/cost was still critical. As a result of increasing local and international competition buyers started to form collaborative relationships mainly to improve quality and reduce cost.
In the collaborative phase (1998- ), Turkish government was intended to stabilize the economy while sustaining economic growth and thus implemented a three-year structural adjustment and stabilization program in 1998 devised by the International Monetary Fund (IMF). The program has been revised periodically during the last five years and now Turkey has been applying to IMF reforms and the program has been being conducted successfully. During the last few years, the integration of the country with the globalization process has created a high level environment of competition.
In the collaborative phase, cooperation between buyers and suppliers has been increasing as a result of reducing supplier base rapidly. As seen in Table 1, evolu-tion of strategies adopted for buyer-supplier relaevolu-tionships over time has shifted from price-based strategy towards joint value generation strategy in Turkey (Ulusoy, 2003).
The scale based on more economic developments rather than sector features can be used to determine the relationship between buyers-suppliers for most
of the sectors in Turkey. But generalization must be limited with some areas which are not developed healthy and liberalized enough such as plastic profile sector. While Turkey lives in the collaborative phase with most of its sectors, petrochemical industry can not match the requirements of this phase.
The petrochemical industry, which is sensitive to fluctuations in the price of feedstock and energy, experiences cycles in prices and profitability parallel to the developments in world economy and in conjunction with the movements in supply and demand. The rate of demand increase for petrochemical products is highly above that of the world’s average in Turkey. On the other hand, domestic supply does not increase at the same rate as the rapid domestic demand increase. Although important capacity increases were realized by expansion and modernization investments at the various plants of Petkim Holding which is the most significant producer in Turkey, domestic supply is still insufficient to meet the rapidly growing demand. Petkim can only meet the 37% of the domestic demand (Petkim, 2003).
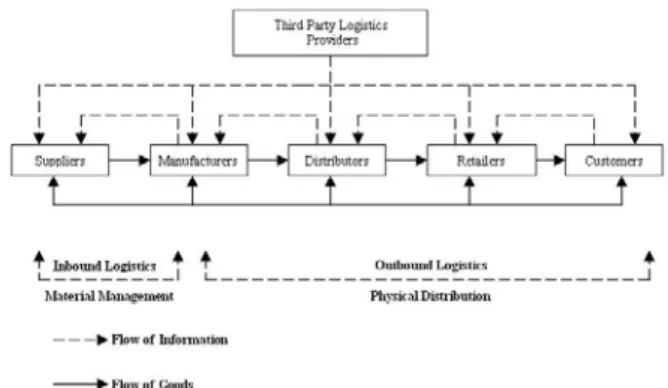
The plastic profile manufacturer supplies PVC (polyvinyl chloride) which is ap-proximately 80% of the compound prepared for plastic profile manufacturing from domestic supplier Petkim Holding in Turkey. But the supply is so far from compensate for the firm’s demand. Thus, the firm has to import from four foreign suppliers which are located in Belgium, France, Japan and U.S.A. The multi-echelon supply chain system in this study is illustrated in Figure 1. Raw materials are supplied by a third party logistics provider/outsourcing agent (OA1) in the first stage (from suppliers to plants). Materials imported from abroad can be shipped by seaway, highway and railway. The most significant and characteristic factor in the firm’s supply policy is logistics potentials of suppliers. Thus, capacities, distances of suppliers to plants and shipping times play an important role in selection of suppliers.
The firm uses only distribution centers and not employs depots. Products ufactured in plants are directly dispatched to distribution centers and the man-ufacturer has paid transportation cost. Similar to the first stage, in the second stage the firm works with an outsourcing agent (OA2). OA2 decides the type (age) of trucks according to the preferences of the firm and routes. There are three options for trucks: young (0-5 ages), middle (6-10 ages) and old (11 and over). OA2 assigns trucks with respect to the capacities of truck options and transports the products from plants to distribution centers.
In the third stage, from distribution centers to customers products are distrib-uted by the firm’s own pick-up fleet.
3. Supply chain modeling 3.1 Nomenclature
Before formulating the model, basic parameters and notations are introduced. Indices used in the model are: ∈ , a set of suppliers; ∈ , a set of po-tential plants; ∈ , a set of popo-tential distribution centers; ∈ , a set of customer zones; ∈ , a set of options for shipping; ∈ , a set of options for
transportation. The problem parameters and decision variables are defined as follows:
=Amount shipped from supplier i to plant j using option
=Amount transported from plant j to DC k using option .
=Amount distributed from DC k to customer zone l.
=Unit cost of shipping from supplier to plant using option .
=Unit cost of transportation from plant to DC using option .
=Unit cost of distribution from DC k to customer zone l.
=Unit cost of purchasing from supplier .
=Unit cost of supply from supplier for plant using option .
= + (unit cost of supply)
=Opportunity lost of shipping from supplier i to plant j using option t. =Opportunity lost of transportation from plant j to DC k using option u. =Unit opportunity cost of shipping from suppliers to plants.
=Unit opportunity cost of transportation from plants to DCs. =Shipping time from supplier i to plant j using option t.
=Transportation time from plant to DC using option . = − min {}
= − min©ª
=Amount of raw material required to produce one unit of product (raw material/product).
=Parameter of supply policy.
=Fixed cost for operating plant .
Φ =
½
1, if production takes place at plant ,
0, otherwise.
=Fixed cost for operating DC .
∆=
½
1, if distribution center is opened,
0, otherwise.
= An upper limit on total number of DCs that can be opened. = An upper limit on total number of plants that can be opened. =Capacity limit of supplier .
=Capacity limit of plant .
=Capacity limit of DC .
=Demand of customer zone .
=Capacity of option in Stage 1.
=Capacity of option in Stage 2.
3.2 Mathematical model
A mathematical model that is based on the supply chain system of a plastic pro-file manufacturer firm in Turkey is presented here. Although there are multiple products with little differences such as color, style etc., the model developed in this study is a single product model and aggregate production planning is employed. For the decision problem treated here, the multiple products are pro-duced from the same material (PVC profile) and so it is considered as adequate to plan only their aggregated form rather than specifying them individually. 3.2.1 Objective Function
In this study, a multi-echelon mixed integer model with the objective of minimiz-ing the total cost is developed. The total cost includes the logistics cost through the whole chain; fixed operating costs of plants and DCs; and opportunity costs. The formulation of objective function is given as follows:
min[X X X + X X X + X X ] + [X Φ+ X ∆] + [ X X X + X X X ] (1)
The term of logistics cost is a combination of supply cost including purchasing cost and shipping cost in the first stage; transportation cost in the second stage; and distribution cost in the third stage.
The term of fixed operating cost defines the cost to open and operate a plant or DC. Fixed operating cost does not depend on the production/distribution rate at plant/DC and includes fixed costs such as rents of facilities, amortizations, salaries of guards and managers, annual insurance payments.
The term of opportunity cost means the cost not to choose the option having the shortest shipping or transportation time. Therefore, there exists a penalty for relative tardiness with respect to the fastest option and opportunity cost is the total penalty of relative tardiness. The model trades off between the cost of shipping/transportation and opportunity cost (namely, cost to not have the material at the right time).
3.2.2 Constraints
3.2.2.1 Capacity constraints of suppliers
These constraints restrict the capacity of suppliers to a certain annual amount. (ton/year, unit/year etc.)
(2) X
X
3.2.2.2 Capacity constraints of plants
These constraints restrict the production capacity of plants to a certain annual amount. (package/year, unit/year etc.) and ensure that the number of units produced by a plant cannot exceed its existent capacity. If the plant is not opened, existent capacity is equal to zero.
(3) X X ≤ Φ ∀ 3.2.2.3 Capacity constraints of DCs
These constraints restrict the capacity of DCs to a certain annual amount (pack-age/year, unit/year etc.) and ensure that the number of units distributed by a DC cannot exceed its existent capacity. If the DC is not opened, existent capacity is equal to zero.
(4) X
≤ ∆ ∀
3.2.2.4 Capacity constraints on number of plants
Constraint set (5) restricts the number of plants to be opened to a certain number ( ).
(5) X
Φ≤
3.2.2.5 Capacity constraints on number of DCs
Constraint set (6) restricts the number of DCs to be opened to a certain number (D).
(6) X
∆≤
3.2.2.6 Capacity constraints of shipping options
Constraint set (7) states that the amounts of materials (or components) shipped from all suppliers using option can not exceed that option’s capacity.
(7) X
X
≤ ∀
3.2.2.7 Capacity constraints of transportation options
Constraint set (8) states that the sum of units transported from all opened plants using option can not exceed that option’s capacity.
(8) X
X
≤ ∀
3.2.2.8 Distribution capacity limits of DCs
Constraint set (9) states that the sum of units distributed from all opened DCs can not exceed the chain’s distribution capacity (which directly depends on trucks in the case study).
(9) X
≤ Γ ∀
3.2.2.9 Balance constraints of Stage 1
Balance constraints of Stage 1, ensures that the amount of materials required to produce the sum of products transported from all plants should be equal to the amount shipped from suppliers to opened plants.
(10) X X − X X = 0 ∀
3.2.2.10 Balance constraints of Stage 2
The second balance constraint represents the harmony of production-distribution flows between plants and DCs. The number of units distributed by plant should be equivalent to the sum of units transported from all plants to that DC. (11) X X − X = 0 ∀
3.2.2.11 Balance constraints of Stage 3
The third balance constraint states that the sum of units distributed from all opened DCs to customer zone should be equal to that customer zone’s demand.
(12) X
X
≥ ∀
3.2.2.12 Constraints of supply policy
Supply policy indicates that at least a fraction of the total supply should be shipped from one or more distinguished (VIP ) supplier. The constraint is use-ful especially when there is a quota regime in the sector or markets where in the control over the supply of a materials is in the hands of a small number of producers/suppliers, like in the case study. With the help of the supply policy parameter (), the ratio of material that is acquired from a supplier is
guaran-teed. So, the value of is determined by decision maker according to his supply
chain management strategy which is based on the condition of the competition in the supply market and the sector structure mostly.
(13) X X − ( X X X
) ≥ 0, for all distinguished suppliers
3.2.2.13 Logical consistency constraints
Logical consistency constraints ensure that the total of supply policy parameters cannot exceed one. Namely, the amount of supply shipped from VIP suppliers who are given priority by decision maker cannot exceed the total supply.
(14) X
≤ 1, for all distinguished suppliers
3.2.2.14 Sign Restrictions
Sign restrictions assure that all variables to take non-negative values, with the exception of binary variables.
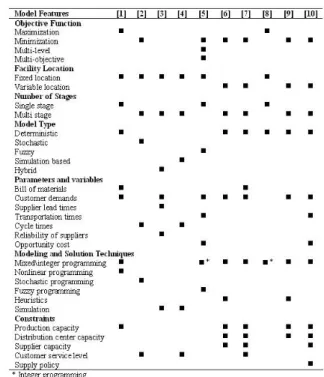
3.3 A Comparative analysis of supply chain models
In order to clarify the differences between the current model and the others proposed before, a comparative table is presented below (Table 2).
4. Model application and results
The supply chain network of the plastic profile manufacturer has consists of three echelons as shown in Figure 2. At the first echelon, there are five suppliers and three possible plant locations. The second stage contains these plants and six possible distribution centers. The third echelon consists of distribution centers and 63 customer zones that spread wide over all Turkey geographically. 4.1 Data of the model
The firm supplies the PVC main raw material of the plastic profile from the domestic supplier Petkim located in ˙Izmir. Nevertheless, domestic supply is not enough to acquire the demand of the country. Thus, the firm imports from four foreign countries; USA, Belgium, France, and Japan. These foreign supplies have been made by using three shipping options; railway, highway and seaway. Unit costs of these shipping options from suppliers to potential plants are given in Table 3 in the author’s data website (www.geo cities.com /tpaksoy/data.htm). In the
website, Tables 3-17 are presented.
In the first stage, for unavailable shipping options a great number as M is assigned. For example, it is not feasible geographically to ship from Izmir to Konya by using seaway. Similarly, from USA to Europe, it is not possible to travel by railway and highway. Thus, for infeasible options shipping times are considered as 10000 hours (Table 6) and unit shipping costs are used as 10000 USD (Table 3).
The raw material PVC has different prices in global market (Table 4). Exporter firms utilize the insufficient competition environment in Turkey and adjust their price policy with respect to prices of Petkim. This results in an unfavorable situation for manufacturer in Turkish plastic profile sector.
Supply costs of PVC can be evaluated simply as the sum of purchasing cost and shipping cost (Table 5).
Shipping times from foreign suppliers (USA, Belgium, France, and Japan) and domestic supplier (Petkim) to potential plants (Konya, ˙Istanbul, ˙Izmir) by three options (railway, highway and seaway) are listed in Table 6.
In the first stage, the firm aims to minimize the total supply cost that contains shipping cost and can use three shipping options. However, at the same time, the firm must consider opportunity times that arises from not to choose the least shipping time (Table 7).
In the second stage, the plastic profile manufacturer uses outsourcing service from a third party logistic provider called “OA2” in this paper. OA2 is a logistic firm and performs its core competencies on transportation. His fleet contains
three type of vehicles that is classified according to theirs ages; young, middle, old. Unit transportation costs per package are given in Table 8.
Transportation times from potential plants (Konya, ˙Istanbul, ˙Izmir) to distrib-ution centers (Konya, Istanbul, Izmir, Ankara, Trabzon, Adana) by three truck options (young, middle and old) are listed in (Table 9).
In the second stage, the firm aims to minimize the total transportation cost and has three truck options such as; young, middle and old. Older trucks can be rented cheaper than younger ones. Despite of this explicit cost advantage, at the same time, the firm must consider opportunity times that arises from not to choose the least shipping time and cost of this decision. Opportunity lost times in second stage is given in Table 10.
In the third stage, the firm aims to minimize the total distribution cost between six possible distribution centers and 63 customer zones. Unit distribution costs are given through Table 11.a-11.h.
In the monopoly market, domestic supplier Petkim shares his production to customers all over the Turkey within a quota program. The annual share of the plastic profile manufacturer company is 7200 ton PVC. Capacities of foreign suppliers are 10000 ton/year as seen in Table 12. Capacities and fixed costs of potential plants are given in Table 13.
Fixed costs of plants consist of expenditures which is independent of production quantities such as hiring costs of buildings and facilities; amortizations of ma-chines and tools; salaries of managers and guardians; and insurance premiums. Although the last three items (amortizations, fixed man-power and insurance cost) are about similar all over the Turkey, land and building costs are varying depending on the developing and industrialization level of cities. Thus, there are differences between fixed costs of plant/DC alternatives (Table 14, Table 15).
Distribution centers of the firm distribute products 63 different customer zones that spread wide over all Turkey geographically. Customer zone concept con-tains all retailers and customers in that city. So, demand of a customer zone, for example 20.000 package/year demand of Bursa refers the total demand of all retailers in Bursa city and neighbor inhabited locations that dependent to Bursa zone. Annual average demand all over Turkey is 479.200 package/year. In the first stage, it is assumed that there is no capacity limit for shipping op-tions. For this reason, capacities are taken a great number as 1 million ton/year (Table 16). In this stage that contains rail way, high way and sea way options, the assumption is based on i) the positive effect and new opportunities on inter-national transportation sector created by globalization process emerging the last decade; ii) high developing performance and strong infrastructure of the sector; iii) and not being exist capacity problem for most of international routes today. In the second stage, the plastic profile manufacturer firm outsources from OA2. Trucks of OA2 are assigned to routes from plants to distribution centers ac-cording to preference of the profile manufacturer and capacity of fleet. The capacities of trucks, which categorized within three groups; young (0-5 age), middle (6-10 age) and old (11 and over) are as follows (Table 17).
4.2 Solution of the model
For the solution of the model, XPRESS Solver Engine is used. Objective func-tion is found as: 18 262 651,13 USD and one plant and four distribufunc-tion centers are evaluated to be opened; Φ1 = 1 (Konya, open), Φ2 = 0 (Istanbul, closed),
Φ3 = 0 (Izmir, closed). ∆1 = 1 (Konya, open), ∆2 = 0 (Istanbul, closed),
∆3 = 1 (Izmir, open), ∆4 = 1 (Ankara, open), ∆5 = 0 (Trabzon, closed),
∆6= 1 (Adana, open).
Supply plan of the plastic profile manufacturer has characterized as follows; 113 = 5801 6 ton (from USA to Konya by seaway and highway), 213 =
10000 ton (from Belgium to Konya by seaway and highway), 511= 7200 from
PETKIM to Konya by railway) and totally 23001, 6 ton/year PVC.
In the second stage, 112= 159200 packages (from Konya to Konya by middle
age truck), 113 = 33600 packages (from Konya to Konya by old age truck),
133 = 80000 packages (from Konya to Izmir by old age truck), 143= 120000
packages (from Konya to Ankara by old age truck), 163= 86400 packages (from
Konya to Adana by old age truck), and totally 479200 packages.
Optimum distribution plan from DCs to 63 customer zones in terms of packages in the third stage are given in Table 18.
5. Conclusions and Future Works
Effective supply chain network design and optimization of the network provide a competitive advantage to firms and organizations in today’s highly intractable international business environment.
The literature in designing and operating of supply chain networks can be clas-sified into three groups as conceptual, empirical, and quantitative frameworks (Talluri and Baker, 2002). Among the quantitative frameworks, optimization methods are found to be the preferred approaches (Harrison, 2001). Despite the widespread popularity of this area, some basic questions have remained to be answered. This study attempts to answer two such questions: i) How can deci-sion maker reflect the supply policy of the firm to supply chain model? ii) How can decision maker represent the value of time on transportation of materials and products in the model by means of utilizing an optimization method? In this study, design and optimization of strategic production-distribution prob-lem which consist of choosing the location of plants and distribution centers between alternatives and determining the optimal physical flow of goods from supply sources to consumption points is treated. The multi-echelon mixed inte-ger linear programming is utilized to model the supply chain system of a plastic profile manufacturer operating in Konya/Turkey. The model lets decision maker reflect his supply policy and also includes the choice of the facilities (plants or distribution centers to be opened and design of network configuration with mini-mum total cost under the capacity, balance, and supply policy constraints. The total cost involves supply cost (combination of purchasing cost and shipping cost from suppliers); transportation costs between plants and DCs; distribution cost between DCs and customer zones; fixed operating costs; and opportunity
cost which is the cost not to have the material at the right time. This study differs from the literature in terms of adding a constraint related to reflecting the decision maker’s supply policy and also representing the value of time on transportation of materials and products in the model
The developed model is solved by a professional software package. The results of the solution process prove that the location of the plant, which has been already located in Konya, is a true choice and discards the Istanbul and Izmir options. According to the solution four distribution centers (Konya, Izmir, Ankara and Adana) are to be opened among six alternatives. The solution also provides an explicit distribution plan for the firm.
Although the proposed model has been developed depending on the production and distribution policies of the considered company, it can be adapted and improved to the other manufacturing companies considering their production and distribution policies.
Notwithstanding the above merits mentioned, the proposed model has some points, which need to be developed as future works: the model can be expanded to include multi objectives or uncertainty by probability or possibility/fuzzy sets theory.
Acknowledgements
This paper is based on the corresponding author’s PhD thesis entitled “Design and Optimization of Distribution Networks in Supply Chain Management: A Case Study and an Experimental Study Based on Genetic Algorithms”. The authors wish to thank to the management team of the anonymous company for providing the authors with valuable assistance in the case study reported in this paper.
References
1. M. A., Cohen, H. L., Lee (1989): Resource deployment analysis of global manufac-turing and distribution networks, Journal of Manufacmanufac-turing and Operations Manage-ment, 2: 81-104.
2. R., Ganeshan, T., Boone, A. J., Stenger (2001): The impact of inventory and flow planning parameters on supply chain performance: An exploratory study, Interna-tional Journal of Production Economics, 71: 111-118.
3. H. K., Gules, T. F., Burgess, J. E., Lynch (1997): The evolution of buyer-supplier relationships in the automotive industries of emerging European economies: the case of Turkey, European Journal of Purchasing & Supply Management, 3(4): 209-219. 4. T. P., Harrison (2001): Global supply chain design, Information Systems Frontiers, 3(4): 413-416.
5. H., Min, G., Zhou (2002): Supply chain modeling: past, present and future, Com-puters and Industrial Engineering, 43(1-2): 231-249.
6. T., Paksoy, H. K., Gules, F., Altiparmak (2003): Design and optimization of distribution networks in supply chain management: a multi-stage mixed integer linear
programming model, Journal of Dokuz Eylul University Business Faculty, 4(2): 1-25 (in Turkish).
7. Petkim (2003): PETKIM Petrokimya Holding A.S., Aliaga, Izmir, Turkey,
http://www.p etkim .com .tr/ing/p etsan.htm, Accessed: 19.09.2003.
8. D., Petrovic, R., Roy, and R., Petrovic (1999): Supply chain modeling using fuzzy sets, International Journal of Production Economics, 59: 443-453.
9. D. F., Pyke, M. A., Cohen (1993): Performance characteristics of stochastic in-tegrated production-distribution systems, European Journal of Operational Research, 68(1): 23-48.
10 M., Sakawa, I., Nishizaki, Y., Uemura (2002): A decentralized two-level trans-portation problem in a housing material manufacturer: Interactive fuzzy programming approach, European Journal of Operational Research, 141: 167-185.
11. R. P., Sundarraj, S., Talluri (2003): A multi-period optimization model for the procurement of component-based enterprise information technologies, European Jour-nal of OperatioJour-nal Research, 146: 339-351.
12. A., Syarif, Y., Yun, M., Gen (2002): Study on multi-stage logistics chain net-work: a spanning tree-based genetic algorithm approach, Computers and Industrial Engineering, 43(1-2): 299-314.
13. S., Talluri, R. C., Baker (2002): A multi-phase mathematical programming ap-proach for effective supply chain design, European Journal of Operational Research, 141: 544-558.
14. G., Ulusoy (2003): An assessment of supply chain and innovation management practices in the manufacturing industries in Turkey, International Journal of Produc-tion Economics, 86: 251-270.
15. H., Yan, Z., Yu, T. C. E., Cheng (2003): A strategic model for supply chain design with logical constraints: formulation and solution, Computers & Operations Research, 30(14): 2135-2155.
Figures
Figure 2. The supply chain network of the plastic profile manufacturer.
Tables
Table 1.Evolution of strategies adopted for buyer-supplier relationships over time in Turkey (Ulusoy, 2003)
Table 2.The comparison table of supply chain models (Paksoy et al., 2003)
References: [1] Cohen and Lee, 1989; [2] Pyke and Cohen, 1993; [3] Petrovic et al., 1999; [4] Ganeshan et al., 2001; [5] Sakawa et al., 2002; [6] Syarif et al., 2002; [7] Yan et al., 2003; [8] Sundarraj and Talluri, 2003; [9] Jayaraman and Ross, 2003; [10] Current model.
Table18.Optimum distribution plan for the third stage of the supply chain network