Address for Correspondence: Dr. Aslı Tanındı, Ufuk Üniversitesi Tıp Fakültesi, Dr. Rıdvan Ege Hastanesi, Kardiyoloji Anabilim Dalı, Çukurambar, Ankara-Türkiye
Phone: +90 312 204 40 82 Fax: +90 312 204 40 55 E-mail: [email protected] Accepted Date: 22.11.2013 Available Online Date: 26.02.2014
©Copyright 2015 by Turkish Society of Cardiology - Available online at www.anakarder.com DOI:10.5152/akd.2014.5277
A
BSTRACTObjective: Epicardial adipose tissue (EAT) is associated with the presence, severity and extent of atherosclerotic coronary artery disease (CAD) in addition to subclinical atherosclerosis. We investigated if EAT thickness is related to acute myocardial infarction in patients with CAD. We also searched for the association between EAT thickness and objective coronary flow and myocardial perfusion parameters such as Thrombolysis in Myocardial Infarction Frame count (TFC) and myocardial blush grade (MBG).
Methods: Two-hundred consecutive patients with stable angina pectoris or acute coronary syndrome who were admitted to Ufuk University Faculty of Medicine, Dr Rıdvan Ege Hospital cardiology department were included in this observational, cross-sectional study. EAT thickness was evaluated by conventional transthoracic echocardiography. Coronary angiography was performed to determine the coronary involvement and perfusion. Results: Mean EAT thicknesses were 5.4±1.9 mm, 6.3±1.8 mm, and 8.5±1.4 mm in the stable angina pectoris (SAP), unstable angina pectoris (USAP) and acute myocardial infarction groups, respectively (p<0.001). With increasing EAT thickness, TFC increases whereas mean MBG values decrease (for EAT thickness <5 mm, 5-7 mm, >7 mm; mean TFC: 21.6±2.2, 25.3±3.3 and 35.2±7.7; and MBG values: 2.98±0.14, 2.83±0.57 and 1.7±1.16, respectively; both p<0.001). Cut-off EAT value to predict AMI was identified as 7.8 mm (ROC analysis AUC:0.876; p<0.001, 95% CI:0.822-0.927). Sensitivity and specificity of EAT cut-off value 7.8 mm to predict AMI were 81.8% and 82.5% respectively.
Conclusion: Increased EAT is associated with AMI and it may prove beneficial for choosing patients who would need more aggressive approach in terms of risk reduction using echocardiography which is a relatively cheap and readily available tool as a follow-up parameter.
(Anatol J Cardiol 2015; 15: 224-31)
Keywords: epicardial adipose tissue, acute myocardial infarction, TIMI frame count, myocardial blush grade
Aslı Tanındı, Sinan Altan Kocaman
1, Aycan Fahri Erkan, Murat Uğurlu, Aslıhan Alhan*, Hasan Fehmi Töre
Departments of Cardiology, Faculty of Medicine and *Statistics, Faculty of Arts and Sciences, Ufuk University; Ankara-Turkey1Clinic of Cardiology, Ankara Güven Hospital; Ankara-Turkey
Epicardial adipose tissue thickness is associated with myocardial
infarction and impaired coronary perfusion
Introduction
Epicardial adipose tissue (EAT) in which coronary arteries are embedded is a specialized visceral adipose tissue around the heart located between visceral pericardium and myocardi-um (1). There is no anatomical barrier between EAT and myocar-dium so they share the same microcirculation. EAT secretes many proatherogenic and proinflammatory hormones and cyto-kines which may induce initiation and progression of coronary artery disease by endocrine and paracrine mechanisms (2). EAT thickness has been shown to be associated with the presence, severity and extent of atherosclerotic coronary artery disease (CAD) (3) in addition to subclinical atherosclerosis (4).
We hypothesized that EAT may help identify patients at increased risk of acute myocardial infarction (AMI) in patients
presenting with stable or unstable clinics considering the increased inflammatory milieu it creates around coronary arter-ies. We aimed to investigate EAT thickness in different clinical presentations and to determine its independency and predictive power. We also searched for the relation between EAT thickness and objective coronary flow parameters such as Thrombolysis in Myocardial Infarction Frame count (TFC) and myocardial blush grade (MBG) which are used to define epicardial and myo-cardial coronary perfusion quantitatively (5, 6).
Methods
Study design is cross-sectional observational. The study population consisted of 221 patients who underwent coronary angiography with the clinical diagnosis of CAD. We
consecu-tively enrolled patients without a history of prior coronary revas-cularization who were admitted to our hospital with stable angina pectoris or acute coronary syndrome between June and October 2012, and who were decided to undergo coronary angi-ography. Exclusion criterions were history of either surgical or percutaneous prior revascularization, pericardial effusion, more than moderate valvular pathology and poor echocardiographic imaging. This study was conducted according to the recommen-dations of Declaration of Helsinki on Biomedical Research involving human subjects and was approved by the institutional Ethics Committee. Written informed consent was obtained from each participant.
Acute ST elevation myocardial infarction (STEMI) was diag-nosed in the presence of chest pain lasting more than 20 min-utes associated with ST segment elevation of more than or equal to 1 mm in at least two extremity electrocardiographical leads or more than or equal to 2 mm in at least two contiguous precordial V1, V2, V3 leads and 1 mm in the remaining precordial leads. Diagnosis of acute non-ST elevation myocardial infarction (NSTEMI) was established when characteristic chest pain last-ed longer than 20 min with/without associatlast-ed ST-segment depression of more than or equal to 0.1 mV and/or T-wave inver-sion in two contiguous leads in the electrocardiogram and increased levels of troponin T was present. CAD was confirmed by coronary angiography within 12 h of presentation in all patients with AMI. All of the stable CAD patients had undergone coronary angiography too. The severity of coronary atheroscle-rosis was determined by the Gensini score (7).
Twenty-one patients were excluded because of the pres-ence of pericardial effusion (n:4), more than moderate valvular pathology (n:5), poor echocardiographic imaging (n:3) or refusing to give written informed consent (n:9). Remaining two hundred patients were divided into three groups according to their clini-cal presentation; 133 patients were in the stable angina pectoris (SAP) group, 34 patients were in the unstable angina pectoris (USAP) group and 33 patients were included in AMI group. AMI group consisted of patients with ST elevation myocardial infarc-tion (STEMI, n:16) and non-ST elevainfarc-tion myocardial infarcinfarc-tion (NSTEMI, n:17).
Anthropometric parameters, past medical history, presence of atherosclerosis risk factors, and medications were recorded for each patient. Blood samples were obtained for complete blood count (Cell-Dyn 3700, Abbott, USA), biochemistry and lipid parameters (UniCell DxC 800, Beckman Coulter USA) before coronary angiography.
Echocardiography
All echocardiographic measurements were performed by the same cardiologist, who had no knowledge of the patient’s clini-cal information, using a VIVID 7 ultrasound (VIVID 7 Pro; GE, Horten, Norway) with a 2.5-3.5 MHz transducer before perform-ing coronary angiography. Each examination was recorded and two other cardiologists blinded to the clinical presentation inter-preted the results off-line. Parasternal and apical projections
were obtained according to the recommendations of American Society of Echocardiography (8). EAT thickness was measured from standard parasternal long-axis view on the free wall of the right ventricle perpendicular to the aortic annulus at end-systole (9). It was identified as the echo-free space between the outer wall of the myocardium and the visceral layer of the pericardium (Fig.1). Thickest point of EAT was measured each time and aver-age value of 3 cardiac cycles was recorded.
Coronary angiography
Selective left and right coronary angiography was performed through femoral artery by standard Judkins technique with 6 Fr catheters (MediCath, Barcelona, Spain) using Toshiba Infinix CSI (Toshiba Corp., Japan).
Gensini score which considers both the extent and the severity of the lesions at coronary angiography was calculated for each patient. This scoring system grades the stenosis in the epicardial coronary arteries (1 for 1-25% stenosis, 2 for 26-50% stenosis, 4 for 51-75% stenosis, 8 for 76-90% stenosis, 16 for 91-99% stenosis, and 32 for total occlusion) and multiplies this number by a constant number determined according to the ana-tomical position of the lesion. TFC, corrected TFC (cTFC) for left anterior descending artery (LAD) and MBG were analyzed by two cardiologists off-line; a third cardiologist was consulted in case of discrepancy. TFC is defined as the number of cine-frames required for the contrast to reach standard distal land-marks for each coronary artery. For LAD, anteroposterior or left anterior oblique cranial projections were used and the pre-defined landmark was the distal bifurcation commonly named as “whale’s tail”. For circumflex artery (Cx), right anterior oblique caudal projection was preferred and the predefined landmark was the distal bifurcation of the segment with the longest total distance. Right projections were preferred for right coronary artery (RCA), and the predefined landmark was the first branch of the posterolateral artery. cTFC was obtained for LAD by divid-ing TFC by 1.7 (10). Mean TFC was calculated by dividdivid-ing the sum of cTFC and TFC Cx and TFC RCA by three.
Myocardial perfusion was assessed by MBG using the best projection for each coronary artery. Duration of cine filming was
Figure 1. Transthoracic echocardiography view (parasternal long axis) showing the measurement of epicardial adipose tissue thickness over the right ventricular free wall along aortic annulus
Pericardial adipose tissue
required to exceed 3 cardiac cycles in the washout phase to assess the washout of myocardial blush. Grade 0 was defined as the failure of the contrast to enter the microvasculature. In Grade 1, contrast slowly enters but fails to exit the microvascu-lature; Grade 2 defines delayed entry and exit from the micro-vasculature and Grade 3 means normal entry and exit from the microvasculature (5).
Statistical analysis
Continuous variables were given as mean±standard deviation; categorical variables were defined as percentages. Mean values were compared by ANOVA test among different groups. The χ2
test was used for the categorical variables among the groups. Logistic regression analysis with Backward LR method was used for multivariate analysis of independent variables, which were significantly different in univariate analysis. After exclusion of irrelevant variables (p>0.05) from the model, logistic regression analysis with enter method were performed with remaining sig-nificant variables and then obtained results were presented. An optimal cut-off for the detection of AMI by EAT was determined by receiver operating characteristics (ROC) analysis and area under curve (AUC) values were determined. All tests of significance were two-tailed. Statistical significance was defined as p<0.05. The SPSS statistical software (SPSS 15.0 for windows, Inc., Chicago, IL, USA) was used for all statistical calculations.
Results
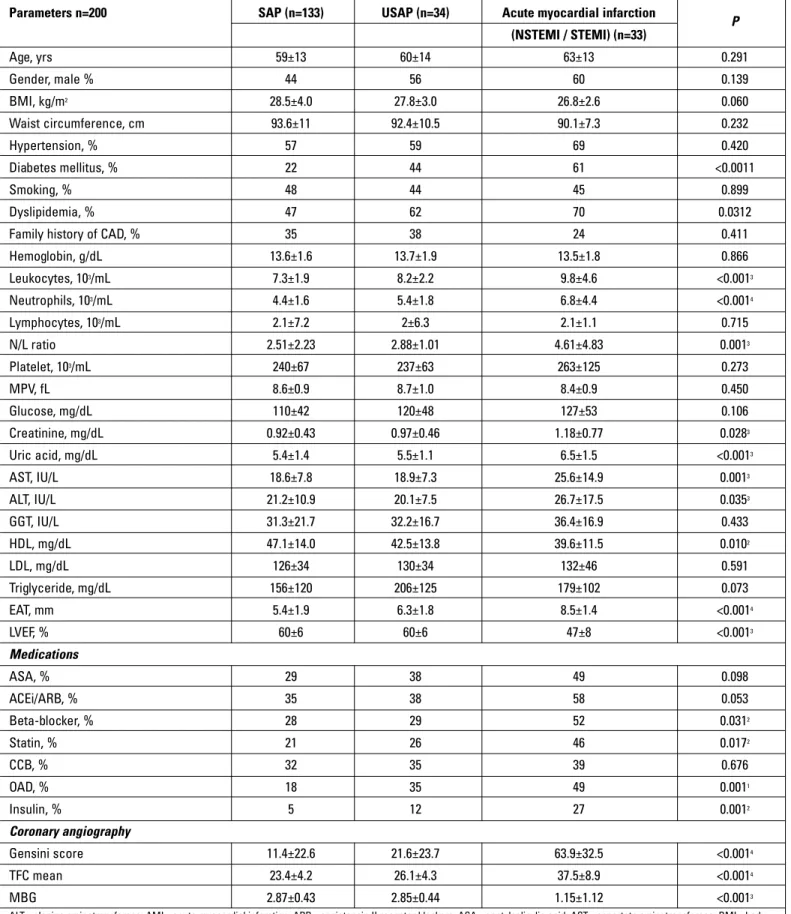
Baseline characteristics were shown in Table 1. There were no significant differences between groups with respect to gen-der or anthropometric measures including body mass index and waist circumference. Incidence of diabetes and dyslipidemia were higher in patients who presented with acute coronary syndromes. Leucocyte count, ratio of neutrophils to lympho-cytes and serum uric acid levels were significantly higher in AMI group compared to SAP and USAP as expected.
After coronary angiography, three patients in AMI group were found to have nonsignificant coronary artery disease
whereas six patients had nonsignificant CAD in the USAP group. In addition, four patients had normal coronary arteries, and two had coronary vasospasm in the USAP group. In the SAP group; 32 patients had significant CAD, 40 had nonsignificant CAD, 15 had other findings like coronary ectasia, turbulent and slow flow, and vasospasm.
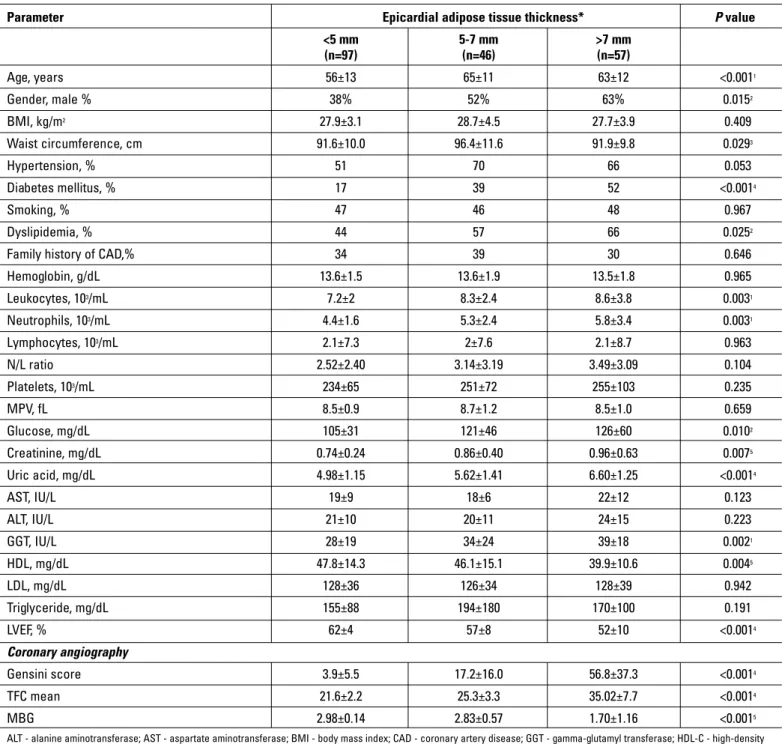
Mean EAT thicknesses were 5.4±1.9 mm, 6.3±1.8 mm, and 8.5±1.4 mm in the SAP, USAP and AMI groups, respectively (p<0.001) (Fig. 2). Table 1 also demonstrates coronary angio-graphic findings in three different clinical presentations. Table 2 shows the change of study parameters with respect to increas-ing EAT thicknesses (<5 mm, 5-7 mm and >7 mm). We used those EAT values because they were the literature cut-off values of EAT for presentations to compare data (11, 12).
Mean Gensini score and TFC were higher whereas mean MBG was significantly lower in three groups with respect to increasing EAT values. With increasing EAT thickness, TFC increases whereas mean MBG values decrease. Analyzing the entire study population, there was a significant, strong and positive association between EAT and mean TFC (r=0.757, p<0.001) and a negative correlation between EAT and MBG (r=-0.549, p<0.001).
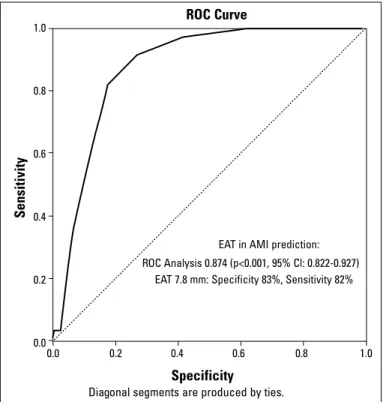
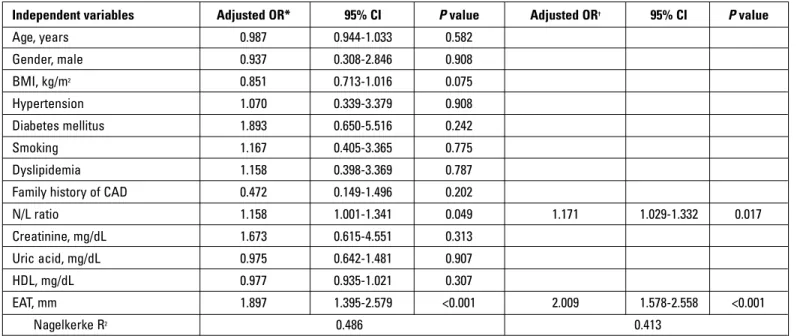
Multivariate analysis and ROC analysis revealed that EAT can be used as an independent and powerful predictor of AMI (Table 3 and Fig. 3). Cut-off EAT value to predict AMI was identi-fied as 7.8 mm (ROC analysis AUC:0.876; p<0.001, 95% CI:0.822-0.927). Sensitivity, specificity, positive predictive value, negative predictive value and the diagnostic accuracy of EAT cut-off 7.8 mm to predict AMI were 81.8%, 82.5%, 48%, 95.8% and 82.4%, respectively.
Figure 3. The ROC curve determining the optimal cut-off point to predict acute myocardial infarction
EAT-epicardial adipose tissue
EAT in AMI prediction: 1.0 0.8 0.6 0.4 0.2 0.0 0.0 0.2 0.4 0.6 0.8 1.0 ROC Analysis 0.874 (p<0.001, 95% Cl: 0.822-0.927)
EAT 7.8 mm: Specificity 83%, Sensitivity 82% ROC Curve
Specificity
Sensitivity
Diagonal segments are produced by ties. Figure 2. Change of mean EAT thickness in different clinical presentations
EAT-epicardial adipose tissue
10.00 8.00 6.00 4.00 2.00 0.00 Mean EA T (mm) Subgroups P<0.001 P<0.023 Error Bars: 95% Cl P<0.001
Parameters n=200 SAP (n=133) USAP (n=34) Acute myocardial infarction (NSTEMI / STEMI) (n=33) P Age, yrs 59±13 60±14 63±13 0.291 Gender, male % 44 56 60 0.139 BMI, kg/m2 28.5±4.0 27.8±3.0 26.8±2.6 0.060 Waist circumference, cm 93.6±11 92.4±10.5 90.1±7.3 0.232 Hypertension, % 57 59 69 0.420 Diabetes mellitus, % 22 44 61 <0.0011 Smoking, % 48 44 45 0.899 Dyslipidemia, % 47 62 70 0.0312
Family history of CAD, % 35 38 24 0.411
Hemoglobin, g/dL 13.6±1.6 13.7±1.9 13.5±1.8 0.866 Leukocytes, 103/mL 7.3±1.9 8.2±2.2 9.8±4.6 <0.0013 Neutrophils, 103/mL 4.4±1.6 5.4±1.8 6.8±4.4 <0.0014 Lymphocytes, 103/mL 2.1±7.2 2±6.3 2.1±1.1 0.715 N/L ratio 2.51±2.23 2.88±1.01 4.61±4.83 0.0013 Platelet, 103/mL 240±67 237±63 263±125 0.273 MPV, fL 8.6±0.9 8.7±1.0 8.4±0.9 0.450 Glucose, mg/dL 110±42 120±48 127±53 0.106 Creatinine, mg/dL 0.92±0.43 0.97±0.46 1.18±0.77 0.0283 Uric acid, mg/dL 5.4±1.4 5.5±1.1 6.5±1.5 <0.0013 AST, IU/L 18.6±7.8 18.9±7.3 25.6±14.9 0.0013 ALT, IU/L 21.2±10.9 20.1±7.5 26.7±17.5 0.0353 GGT, IU/L 31.3±21.7 32.2±16.7 36.4±16.9 0.433 HDL, mg/dL 47.1±14.0 42.5±13.8 39.6±11.5 0.0102 LDL, mg/dL 126±34 130±34 132±46 0.591 Triglyceride, mg/dL 156±120 206±125 179±102 0.073 EAT, mm 5.4±1.9 6.3±1.8 8.5±1.4 <0.0014 LVEF, % 60±6 60±6 47±8 <0.0013 Medications ASA, % 29 38 49 0.098 ACEi/ARB, % 35 38 58 0.053 Beta-blocker, % 28 29 52 0.0312 Statin, % 21 26 46 0.0172 CCB, % 32 35 39 0.676 OAD, % 18 35 49 0.0011 Insulin, % 5 12 27 0.0012 Coronary angiography Gensini score 11.4±22.6 21.6±23.7 63.9±32.5 <0.0014 TFC mean 23.4±4.2 26.1±4.3 37.5±8.9 <0.0014 MBG 2.87±0.43 2.85±0.44 1.15±1.12 <0.0013
ALT - alanine aminotransferase; AMI - acute myocardial infarction; ARB - angiotensin II receptor blockers; ASA - acetylsalicylic acid; AST - aspartate aminotransferase; BMI - body mass index; CAD - coronary artery disease; CCB - calcium channel blockers; EAT - epicardial adipose tissue; GGT - gamma-glutamyl transferase; HDL - high-density lipoprotein cholesterol; LDL - low-density lipoprotein cholesterol; LVEF - left ventricular ejection fraction; MBG - myocardial blush grade; MPV - mean platelet volume; N/L - neutrophyl-lymphocyte; NSTEMI - non-ST elevation MI; OAD - oral anti-diabetic drugs; SAP - stable angina pectoris; STEMI - ST elevation MI; TFC - thrombolysis in myocardial infarction frame count; USAP - unstable angina pectoris. 1: statistical difference is between SAP-USAP and SAP-AMI groups; 2:statistical difference is between SAP-AMI groups; 3: statistical difference is between SAP-AMI and USAP-AMI groups; 4:statistical difference is between SAP-USAP, SAP-AMI and USAP-AMI groups
Discussion
Our study demonstrated that EAT thickness measured by echocardiography is independently associated with AMI. Although there are studies linking EAT and coronary artery dis-ease (2); this study highlights the association between EAT and AMI in patients who admit with a wide range of chest pain syn-dromes. We suggest that EAT may help identify patients having
a high AMI risk and to predict coronary findings prior to coro-nary angiography, and it may be used as a follow-up parameter in clinic practice.
EAT secretes many proinflammatory and proatherogenic cytokines and adipokines like interleukin-6, interleukin-1, tumor necrosis factor-α, monocyte chemoattractant protein-1, plas-minogen activator inhibitor-1, angiotensinogen, leptin, resistin and visfatin (13-15). In contrast, adiponectin which has
antiath-Parameter Epicardial adipose tissue thickness* P value
<5 mm 5-7 mm >7 mm (n=97) (n=46) (n=57) Age, years 56±13 65±11 63±12 <0.0011 Gender, male % 38% 52% 63% 0.0152 BMI, kg/m2 27.9±3.1 28.7±4.5 27.7±3.9 0.409 Waist circumference, cm 91.6±10.0 96.4±11.6 91.9±9.8 0.0293 Hypertension, % 51 70 66 0.053 Diabetes mellitus, % 17 39 52 <0.0014 Smoking, % 47 46 48 0.967 Dyslipidemia, % 44 57 66 0.0252
Family history of CAD,% 34 39 30 0.646
Hemoglobin, g/dL 13.6±1.5 13.6±1.9 13.5±1.8 0.965 Leukocytes, 103/mL 7.2±2 8.3±2.4 8.6±3.8 0.0031 Neutrophils, 103/mL 4.4±1.6 5.3±2.4 5.8±3.4 0.0031 Lymphocytes, 103/mL 2.1±7.3 2±7.6 2.1±8.7 0.963 N/L ratio 2.52±2.40 3.14±3.19 3.49±3.09 0.104 Platelets, 103/mL 234±65 251±72 255±103 0.235 MPV, fL 8.5±0.9 8.7±1.2 8.5±1.0 0.659 Glucose, mg/dL 105±31 121±46 126±60 0.0102 Creatinine, mg/dL 0.74±0.24 0.86±0.40 0.96±0.63 0.0075 Uric acid, mg/dL 4.98±1.15 5.62±1.41 6.60±1.25 <0.0014 AST, IU/L 19±9 18±6 22±12 0.123 ALT, IU/L 21±10 20±11 24±15 0.223 GGT, IU/L 28±19 34±24 39±18 0.0021 HDL, mg/dL 47.8±14.3 46.1±15.1 39.9±10.6 0.0045 LDL, mg/dL 128±36 126±34 128±39 0.942 Triglyceride, mg/dL 155±88 194±180 170±100 0.191 LVEF, % 62±4 57±8 52±10 <0.0014 Coronary angiography Gensini score 3.9±5.5 17.2±16.0 56.8±37.3 <0.0014 TFC mean 21.6±2.2 25.3±3.3 35.02±7.7 <0.0014 MBG 2.98±0.14 2.83±0.57 1.70±1.16 <0.0015
ALT - alanine aminotransferase; AST - aspartate aminotransferase; BMI - body mass index; CAD - coronary artery disease; GGT - gamma-glutamyl transferase; HDL-C - high-density lipoprotein cholesterol; LDL-C - low-density lipoprotein cholesterol; LVEF - left ventricular ejection fraction; MBG - myocardial blush grade; MPV - mean platelet volume; N/L - neutrophyl-lymphocyte; TFC - thrombolysis in myocardial infarction frame count.* 5 and 7 mm were the literature cut-off values of EAT. 1:statistical difference is between EAT <5 mm - EAT 5-7 mm and EAT <5 mm – EAT >7 mm groups; 2:statistical difference is between EAT <5 mm - EAT >7 mm groups; 3:statistical difference is between EAT <5 mm - EAT 5-7 mm and EAT 5-7 mm - EAT >7 mm groups; 4:statistical difference is between EAT <5 mm - EAT 5-7 mm, EAT 5-7 mm - EAT >7 mm and EAT <5 mm - EAT >7 mm groups; 5:statistical difference is between EAT <5 mm - EAT >7 mm and EAT 5-7 mm - EAT >7 mm groups
erogenic properties through improvement of endothelial func-tion and anti-inflammatory effect was shown to be under expressed in EAT in patients with CAD (16). In the light of these findings, EAT is associated with metabolic syndrome (17), insulin resistance (17, 18), endothelial dysfunction, subclinical athero-sclerosis (19) and overt atherosclerotic CAD (20).
We report impaired epicardial and myocardial perfusion with increasing EAT thickness. There are studies which found increased EAT thickness in patients with coronary slow flow expressed as increased TFC (4, 21). Microvascular dysfunction, endothelial dysfunction and inflammation are the underlying mechanisms for slow flow (22). TFC is a quantitative measure of epicardial blood flow although it is affected by resistive compo-nents of microvasculature (6). But myocardial blush grade is an acceptable angiographic tool in the assessment of myocardial perfusion taking microvascular circulation into account.
Positron emission tomography (PET) has become the gold standard in the assessment of myocardial perfusion (23). Recently Alam et al. (24) studied 137 patients with nonobstruc-tive CAD using PET scans to assess myocardial perfusion and myocardial flow reserve (MFR) and they found that increased EAT was associated with impaired MFR indicating myocardial microvascular dysfunction. In another PET study evaluating myocardial blood flow at rest and during adenosine-induced hyperemia, intrapericardial fat volume was shown to predict hyperemic myocardial perfusion independently (25). Myocardial perfusion has been recognized as an important determinant of major adverse cardiac events besides percent stenosis of the epicardial coronary artery (26); so these studies linking myocar-dial microvascular and vasomotor functions with EAT are
impor-tant in terms of predicting impaired myocardial perfusion even in the absence of obstructive CAD. We did not use PET scan or any other distinguished tool for myocardial perfusion assess-ment; but MBG is an easy and practical way for myocardial perfusion in patients who has undergone invasive coronary angiography.
The most striking finding of this study was the identification of EAT as a predictor of AMI with quite satisfactory sensitivity, specificity and negative predictive values. In a community based study conducted with MESA participants, pericardial fat was found to be associated with an increase in incident coronary events defined as myocardial infarction, resuscitated cardiac events, angina and fatal coronary heart disease (27). Unstable presentation in patients with increased EAT was also reported by Ahn et al. (28). They had measured EAT thickness in 527 patients who were undergoing coronary angiography and found that EAT thickness was higher in subjects with unstable angina than in those with atypical chest pain or stable angina. Park et al. (29) have reported very recently that EAT thickness by echocar-diography was related to plaque vulnerability determined by virtual histology intravascular ultrasound in patients with sig-nificant CAD. In another very recent study investigating the association between EAT volume and atherosclerotic plaque characteristics, plaques were classified as fibrous, calcific, lipid and necrotic; and increased EAT volume was related to higher percentage of necrotic plaque tissue which is potentially the most vulnerable type (30).
Plaque vulnerability is the putative explanation for the asso-ciation between increased EAT and AMI. In addition to composi-tion of the plaque, another contributing factor of EAT to
vulner-Independent variables Adjusted OR* 95% CI P value Adjusted OR† 95% CI P value
Age, years 0.987 0.944-1.033 0.582 Gender, male 0.937 0.308-2.846 0.908 BMI, kg/m2 0.851 0.713-1.016 0.075 Hypertension 1.070 0.339-3.379 0.908 Diabetes mellitus 1.893 0.650-5.516 0.242 Smoking 1.167 0.405-3.365 0.775 Dyslipidemia 1.158 0.398-3.369 0.787
Family history of CAD 0.472 0.149-1.496 0.202
N/L ratio 1.158 1.001-1.341 0.049 1.171 1.029-1.332 0.017 Creatinine, mg/dL 1.673 0.615-4.551 0.313 Uric acid, mg/dL 0.975 0.642-1.481 0.907 HDL, mg/dL 0.977 0.935-1.021 0.307 EAT, mm 1.897 1.395-2.579 <0.001 2.009 1.578-2.558 <0.001 Nagelkerke R2 0.486 0.413
BMI - body mass index; CAD - coronary artery disease; CI - confidence interval; EAT - epicardial adipose tissue; HDL - high-density lipoprotein; N/L - neutrophil-lymphocyte; OR - odds ratio
*The multivariate analyses was used for of independent variables being significantly different among study groups in Table 1 and having a causative role for AMI.
†Logistic regression analysis with Backward LR method was used for multivariate analysis of independent variables including age, gender, BMI, HT, DM, smoking, dyslipidemia, family
history of CAD, N/L ratio, uric acid, creatinine, HDL and EAT, which were significantly different in univariate analysis. After exclusion of irrelevant variables (p>0.05) from the model, logistic regression analysis with enter method were performed with remaining significant variables and then obtained results were presented.
ability could be positive remodeling which is defined as the outward plaque building with the thinning of arterial tunica media. Although eccentric plaques with positive remodeling usually keeps the lumen patent, they are more prone to rupture both due to the stretch at the plaque free arc and the high inflammatory infiltrate and lipid content (31). Prati et al. (32) have shown that lesions neighboring pericardium undergo vessel expansion easily due to the permissive role of EAT in contrast to the lesions surrounded by myocardium which resists expansion of the lesion thus avoids positive remodeling.
Study limitations
Most important limitations of this study are the relatively small sample size and the cross-sectional design which ham-pers to infer causality. We don’t have any information about serum levels of interleukins, cytokines and adipokines which could partially highlight the underlying mechanism. In addition, although physiopathologic properties, atherosclerotic plaque components and thrombotic milieu could differ between STEMI and NSTEMI patients, AMI group was not analyzed separately as STEMI and NSTEMI; because the number of patients in the subgroups would be inadequate for a proper statistical analysis. Therefore, we preferred to allocate patients with proven myo-cardial damage in a single group. Lastly, quantification of EAT was performed by echocardiography. Although assessment of EAT volume by computed tomography is a more precise method, echocardiography is cheap and easily available.
Conclusion
Quantification of EAT thickness using echocardiography which is a relatively cheap and readily available tool may prove beneficial for choosing patients who would need more aggres-sive approach in terms of risk reduction, and it may be used as a follow-up parameter.
Conflict of interest: None declared. Peer-review: Externally peer-reviewed.
Authorship contributions: Concept - A.T., S.A.K., A.F.E.; Design - A.T., A.F.E.; Supervision - A.T., A.F.E.; Resource - H.F.T.; Materials - A.T., H.F.T.; Data collection &/or processing - A.T., A.F.E.; Analysis &/or interpreta-tion - A.T., S.A.K., A.A., M.U.; Literature search - A.T.; Writing - A.T.; Critical review - A.T., A.F.E., S.A.K., H.F.T., A.A., M.U.
Acknowledgement: We thank Ms Belgin Mekereci for her help in data collection and archiving.
References
1. Iacobellis G, Malavazos AE, Corsi MM. Epicardial fat: from the biomolecular aspects to the clinical practice. Int J Biochem Cell Biol 2011; 43: 1651-4. [CrossRef]
2. Xu Y, Cheng X, Hong K, Huang C, Wan L. How to interpret epicardial adipose tissue as a cause of coronary artery disease: a meta-analysis. Coron Artery Dis 2012; 23: 227-33. [CrossRef]
3. Eroğlu S, Sade LE, Yıldırır A, Bal U, Özbiçer S, Özgül AS, et al. Epicardial adipose tissue thickness by echocardiography is a marker for the presence and severity of coronary artery disease. Nutr Metab Cardiovasc Dis 2009; 19: 211-7. [CrossRef]
4. Cömert N, Yücel O, Ege MR, Yaylak B, Erdoğan G, Yılmaz MB. Echocardiographic epicardial adipose tissue predicts subclinical atherosclerosis: epicardial adipose tissue and atherosclerosis. Angiology 2012; 63: 586-90. [CrossRef]
5. van 't Hof AW, Liem A, Suryapranata H, Hoorntje JC, de Boer MJ, Zijlstra F. Angiographic assessment of myocardial reperfusion in patients treated with primary angioplasty for acute myocardial infarction: myocardial blush grade. Zwolle Myocardial Infarction Study Group. Circulation 1998; 97: 2302-6. [CrossRef]
6. Kunadian V, Harrigan C, Zorkun C, Palmer AM, Ogando KJ, Biller LH, et al. Use of the TIMI frame count in the assessment of coronary artery blood flow and microvascular function over the past 15 years. J Thromb Thrombolysis 2009; 27: 316-28. [CrossRef]
7. Gensini GG. A more meaningful scoring system for determining the severity of coronary artery disease. Am J Cardiol 1983; 51: 606. [CrossRef]
8. Schiller NB, Shah PM, Crawford M, DeMaria A, Devereux R, Feigenbaum H, et al. Recommendations for quantitation of the left ventricle by two-dimensional echocardiography. American Society of Echocardiography Committee on Standards, Subcommittee on Quantitation of Two-Dimensional Echocardiograms. J Am Soc Echocardiogr 1989; 2: 358-67. [CrossRef]
9. Iacobellis G, Willens HJ. Echocardiographic epicardial fat: a review of research and clinical applications. J Am Soc Echocardiogr 2009; 22: 1311-9. [CrossRef]
10. Gibson CM, Cannon CP, Daley WL, Dodge JT Jr, Alexander B Jr, Marble SJ, et al. TIMI frame count: a quantitative method of assessing coronary artery flow. Circulation 1996; 93: 879-88.
[CrossRef]
11. Nelson MR, Mookadam F, Thota V, Emani U, Al Harthi M, Lester SJ, et al. Epicardial fat: an additional measurement for subclinical atherosclerosis and cardiovascular risk stratification? J Am Soc Echocardiogr 2011; 24: 339-45. [CrossRef]
12. Çetin M, Kocaman SA, Durakoğlugil ME, Erdoğan T, Ergül E, Doğan S, et al. Effect of epicardial adipose tissue on diastolic functions and left atrial dimension in untreated hypertensive patients with normal systolic function. J Cardiol 2013; 61: 359-64. [CrossRef]
13. Şengül C, Özveren O. Epicardial adipose tissue: a review of physiology, pathophysiology, and clinical applications. Anatol J Cardiol 2013; 13: 261-5.
14. Spiroglou SG, Kostopoulos CG, Varakis JN, Papadaki HH. Adipokines in periaortic and epicardial adipose tissue: differential expression and relation to atherosclerosis. J Atheroscler Thromb 2010; 17: 115-30.
[CrossRef]
15. Malavazos AE, Ermetici F, Cereda E, Coman C, Locati M, Morricone L, et al. Epicardial fat thickness: relationship with plasma visfatin and plasminogen activator inhibitor-1 levels in visceral obesity. Nutr Metab Cardiovasc Dis 2008; 18: 523-30. [CrossRef]
16. Eiras S, Teijeira-Fernández E, Shamagian LG, Fernandez AL, Vazquez-Boquete A, Gonzalez-Juanatey JR. Extension of coronary artery disease is associated with increased IL-6 and decreased adiponectin gene expression in epicardial adipose tissue. Cytokine 2008; 43: 174-80. [CrossRef]
17. Pierdomenico SD, Pierdomenico AM, Cuccurullo F, Iacobellis G. Meta-analysis of the relation of echocardiographic epicardial adipose tissue thickness and the metabolic syndrome. Am J Cardiol 2013; 111: 73-8. [CrossRef]
18. Wang CP, Hsu HL, Hung WC, Yu TH, Chen YH, Chiu CA, et al. Increased epicardial adipose tissue (EAT) volume in type 2 diabetes mellitus and association with metabolic syndrome and severity of coronary atherosclerosis. Clin Endocrinol (Oxf) 2009; 70: 876-82. [CrossRef]
19. Kocaman SA, Durakoğlugil ME, Çetin M, Erdoğan T, Ergül E, Canga A. The independent relationship of epicardial adipose tissue with carotid intima-media thickness and endothelial functions: the association of pulse wave velocity with the active facilitated arterial conduction concept. Blood Press Monit 2013; 18: 85-93.
[CrossRef]
20. Doesch C, Haghi D, Suselbeck T, Schoenberg SO, Borggrefe M, Papavassiliu T. Impact of functional, morphological and clinical parameters on epicardial adipose tissue in patients with coronary artery disease. Circ J 2012; 76: 2426-34. [CrossRef]
21. Erdogan T, Çanga A, Kocaman SA, Çetin M, Durakoğlugil ME, Çicek Y, et al. Increased epicardial adipose tissue in patients with slow coronary flow phenomenon. Kardiol Pol 2012; 70: 903-9.
22. Elbasan Z, Şahin DY, Gür M, Şeker T, Kıvrak A, Akyol S, et al. Serum uric acid and slow coronary flow in cardiac syndrome X. Herz 2013; 38: 544-8. [CrossRef]
23. Pourmoghaddas A, Klein R, deKemp RA, Wells RG. Respiratory phase alignment improves blood-flow quantification in Rb82 PET myocardial perfusion imaging. Med Phys 2013; 40: 022503. [CrossRef]
24. Alam MS, Green R, deKemp R, Beanlands RS, Chow BJ. Epicardial adipose tissue thickness as a predictor of impaired microvascular function in patients with non-obstructive coronary artery disease. J Nucl Cardiol 2013; 20: 804-12. [CrossRef]
25. Bucci M, Joutsiniemi E, Saraste A, Kajander S, Ukkonen H, Saraste M, et al. Intrapericardial, but not extrapericardial, fat is an independent predictor of impaired hyperemic coronary perfusion in coronary artery disease. Arterioscler Thromb Vasc Biol 2011; 31: 211-8. [CrossRef]
26. Farhad H, Dunet V, Bachelard K, Allenbach G, Kaufmann PA, Prior JO. Added prognostic value of myocardial blood flow quantitation in rubidium-82 positron emission tomography imaging. Eur Heart J Cardiovasc Imaging 2013; 14: 1203-10. [CrossRef]
27. Ding J, Hsu FC, Harris TB, Liu Y, Kritchevsky SB, Szklo M, et al. The association of pericardial fat with incident coronary heart disease: the Multi-Ethnic Study of Atherosclerosis (MESA). Am J Clin Nutr 2009; 90: 499-504. [CrossRef]
28. Ahn SG, Lim HS, Joe DY, Kang SJ, Choi BJ, Choi SY, et al. Relationship of epicardial adipose tissue by echocardiography to coronary artery disease. Heart 2008; 94: e7. [CrossRef]
29. Park JS, Choi SY, Zheng M, Yang HM, Lim HS, Choi BJ, et al. Epicardial adipose tissue thickness is a predictor for plaque vulnerability in patients with significant coronary artery disease. Atherosclerosis 2013; 226: 134-9. [CrossRef]
30. Yamashita K, Yamamoto MH, Ebara S, Okabe T, Saito S, Hoshimoto K, et al. Association between increased epicardial adipose tissue volume and coronary plaque composition. Heart Vessels 2013 [Epub ahead of print] DOI 10.1007/s00380-013-0398-y.
31. Varnava AM, Mills PG, Davies MJ. Relationship between coronary artery remodeling and plaque vulnerability. Circulation 2002; 105: 939-43.
[CrossRef]
32. Prati F, Arbustini E, Labellarte A, Sommariva L, Pawlowski T, Manzoli A, et al. Eccentric atherosclerotic plaques with positive remodelling have a pericardial distribution: a permissive role of epicardial fat? A three-dimensional intravascular ultrasound study of left anterior descending artery lesions. Eur Heart J 2003; 24: 329-36. [CrossRef]