BIOMINERALIZATION WITH ENGINEERED CELLULAR
SYSTEMS
A DISSERTATION SUBMITTED TO
THE GRADUATE SCHOOL OF ENGINEERING AND SCIENCE
OF BILKENT UNIVERSITY
IN PARTIAL FULFILLMENT OF THE REQUIREMENTS FOR
THE DEGREE OF
DOCTOR OF PHILOSOPHY
IN
MATERIALS SCIENCE AND NANOTECHNOLOGY
By
ELĠF ERGÜL
“Reproduced in part with permission from [Biomineralization of Calcium Phosphate Crystals Controlled by Protein–Protein Interactions. Elif Duman, Ebru Şahin
Kehribar, Recep Erdem Ahan, Esra Yuca, and Urartu Özgür Şafak Şeker. ACS Biomaterials Science & Engineering Article ASAP DOI:
ABSTRACT
BIOMINERALIZATION WITH ENGINEERED CELLULAR
SYSTEMS
Elif ERGÜL
PhD in Materials Science and Nanotechnology
Advisor: Urartu Özgür ġafak ġeker
August, 2019
Hydroxyapatite (HAP) is the final product of bone biomineralization process and HAP formation is controlled by proteins, enzymes and small molecules secreted to extracellular matrix (ECM). Among these molecules, alkaline phosphatase (ALP) leads formation of HAP crystals and noncollagenous proteins control crystal nucleation and growth, and inhibit crystal formation. Osteocalcin (OCN) and osteopontin (OPN), are the most abundant noncollagenous proteins in ECM, which controls mineralization events. In this study, effect of OCN and OPN on HAP crystal formation was studied in order to achieve controlled crystal growth. In vitro
biomineralization assays were conducted to understand the effect of OCN and OPN on the crystal structure of as formed minerals. While OCN decreases crystal growth rate and inhibit mineralization, which leads to more uniform crystal formation, OPN provides faster mineral formation with reduced Ca/P ratio. Moreover, a mammalian engineered cell line was constructed to achieve expression of bone extracellular
matrix (ECM) proteins. For this purpose, genetic cassettes were produced to express OCN and OPN proteins, which are the most common non-collagen proteins that control bone mineral formation. By this way, production of bone type minerals with controlled size, shape and Ca/P ratio can be possible. Our system provides a truly biomimetic approach to HAP formation compared to chemical synthesis methods in literature. We believe our current findings will lead to innovative approaches for bone biomineralization in regenerative medicine and bone tissue engineering.
Keywords: Osteocalcin, Osteopontin, ALP Enzymatic Activity, Biomineralization,
ÖZET
GENETĠĞĠ DEĞĠġTĠRĠLMĠġ HÜCRELER ĠLE
BĠYOMĠNERALĠZASYONUN SAĞLANMASI
Elif ERGÜL
Malzeme Bilimi ve Nanoteknoloji, Doktora
Tez DanıĢmanı: Urartu Özgür ġafak ġeker
Ağustos, 2019
Hidroksiapatit (HAP), kemik biyomineralizasyon işleminin son ürünüdür ve HAP oluşumu, hücre dışı matrikse (ECM) salgılanan proteinler, enzimler ve küçük moleküller tarafından kontrol edilir. Bu moleküller arasında, alkalin fosfataz (ALP), HAP kristallerinin oluşmasını sağlar ve kolajen olmayan proteinler, kristal
çekirdeklenmesini, büyümesini kontrol eder ve kristal oluşumunu inhibe eder. Osteokalsin (OCN) ve osteopontin (OPN), mineralizasyon olaylarını kontrol eden ve ECM' de en çok bulunan kolajen olmayan proteinlerdir. Bu çalışmada, kontrollü kristal büyümesini sağlamak için OCN ve OPN'nin HAP kristal oluşumu üzerindeki etkisi incelenmiştir. OCN ve OPN'nin oluşan minerallerin kristal yapısı üzerindeki etkilerini anlamak için in vitro biyomineralizasyon deneyleri yapılmıştır. OCN kristal büyümesini azaltır, daha düzgün kristal oluşumuna yol açar ve mineralizasyonu inhibe ederken, OPN Ca / P oranını düşürür ve daha hızlı mineral oluşumu sağlar.
Ayrıca, kemik hücre dışı matrisinde bulunan proteinlerin ifade edilmesini sağlamak amacıyla genetiği değiştirilmiş bir hücre hattı oluşturulmuştur. Bu amaçla, kemik
mineral oluşumunu kontrol eden, en çok bulunan kolajen olmayan proteinler olan OCN ve OPN proteinlerini ifade edebilecek genetik kasetler oluşturulmuştur. Bu şekilde, boyut, şekil ve Ca / P oranı kontrol edebilmek ve kemik tipi mineraller üretmek mümkün olabilecektir. Sistemimiz, literatürdeki kimyasal sentez yöntemleriyle karşılaştırıldığında HAP oluşumuna biyomimetik bir yaklaşım sunmaktadır. Mevcut bulgularımızın, rejeneratif tıp ve kemik dokusu
mühendisliğinde, kemik biyomineralizasyonunda yenilikçi yaklaşımlara yol açacağına inanıyoruz.
Anahtar kelimeler: Osteocalcin, Osteopontin, ALP Enzim Aktivitesi,
ACKNOWLEDGEMENTS
It seems that it has taken 8 years to complete PhD program. For me, it was more than that. It has started when I started primary school when I am 7 years old by learning reading, writing and math. Since then, I am a bookworm and a fond of learning. Last 8 years of my life was full of experience and experiment, failure and success, cry and laugh, and; sorrow and proud. Now, it has ended for a new beginning.
First, I would like to thank Dr. Urartu Şeker for guiding me in my thesis work. He is an incredibly virtuous person and a dedicated, passionate scientist. I am so happy to work with him in my PhD journey. I would also thank to Dr. Esra Yuca for guiding me in my projects. She is an excellent troubleshooter, no experiments can be left half finished with her consistency. I also want to thank to Recep Erdem Ahan and Ebru Şahin Kehribar for helping me in my thesis work. I want to thank to all SBL group members; Ebru Şahin Kehribar, Recep Erdem Ahan, Behide Saltepe, Musa Efe Işılak, Aslıhan Gökaltun, Merve Erden, Julian Ostoku, Gökçe Çelik, Zafer Koşar, Çisil Köksaldı, Selin Su Yirmibeşoğlu, Nedim Hacıosmanoğlu, Özge Begli, Cemile Elif Özçelik, Büşra Merve Kırpat, Sıla Köse, Merve Yavuz, Tolga Tarkan Ölmez, Ebuzer Kalyoncu, Tuğçe Önür and Onur Apaydın. Without them, such a nice and fruitful working environment could not be possible.
I would like to acknowledge all the support coming from my best friends. Hikmet Taner Teker was my best supporter since my undergraduate years both mentally and intellectually. Ebru Şahin Kehribar is both a close friend for me and a college to discuss scientific research, her presence in SBL lab gave me strength all the time.
Recep Erdem Ahan is somehow weird person, but he is so clever, talented and supportive. Dr. Rashad Mammadov was one of the best scientist in the world, I am happy to work with him and learn from him in my first year of PhD. His wisdom, advices and support had great contribution on my acquired skills. Dr. Nuray Gündüz is another passionate scientist graduated from UNAM, she was always supportive in my hard times, her advices from a different perspective helped me guide my life in my own way. I also thank her for pushing me positively to make me work harder.
Above every person that I want to thank to, I would like to thank my mother, Emine Duman and my father, Hüseyin Duman. They always supported my education and my journey to become a scientist. Without their effort on educating their daughters in spite of all odds, I could not be a women in science. I cannot skip to say that my sisters, Hümeyra Duman and Fatma Türker, was as supportive as my parents. Hümeyra was both my baby sitter from time to time and my lawyer; and Fatma was my life coach. I am so happy to have two sisters now, even though the years of childhood leading a cat and dog life.
The most challenging part of the PhD was becoming a scientist and a mother at the same time. However, whatever I learned from motherhood helped me to be a good researcher, and vice versa. I would like to thank to my daughters, İpek Ergül and Sedef Ergül, for making me who I am today. I would like to thank to all my
babysitters, taking care of my children while I am working. Günay Parlak, she is like an older sister for me, Ayşe Tiryaki, Muhammet Ergül, Yıldız Köksal, Emine
Duman, Hüseyin Duman, Hümeyra Duman, Rabia Kuşçu. Hatice Üzümcü, Gözde Yiğit Güneş, Fadime Acar, Öznur Çeliköz were the teachers of my daughters in kindergarten. I want to thank to these compassionate teachers for compensating the
odds of being a student mom. All helped me to raise my children and complete my thesis work. I also thank to Dr. Urartu Şeker for supporting me in the hard times of parenthood and integrating me to his group in spite of all the odds of being a mother. I hope scientist will take advantage of child care support provided by universities or governments in the future. Nobody starts his/her life at age 18, so having children should be something normal in academia.
It is impossible to thank to all the people who help me in my thesis, there are lots of hidden figures. All the members of UNAM, Bilkent University, the people who take part in the construction of the university and the institution, the people who fix technical problems that we faced, the people who keep the environment clean... I wish I would thank to all of them.
I want to thank to the contributors of my PhD thesis projects. During my thesis, I worked with Dr. Esra Yuca, in cloning, protein purification and biomineralization experiments. Ebru Şahin Kehribar helped me in optimization of protein purification, Recep Erdem Ahan in cloning, Behide Şaltepe for designing cloning experiments, Onur Apaydın for conducting MTT assay. I want to thank to all group members and engineers who educate me and make me gain all the skills. I want to thank to Dr. Serkan Kasırga for fruitful advises in EDS data analysis.
Lastly, I would like to acknowledge the PhD scholarship from TÜBİTAK (The Scientific and Research Council of Turkey) BIDEB 2211-A.
1 TABLE OF CONTENTS
2 CHAPTER I: INTRODUCTION ... 1
2.1 The mechanism of biomineralization in mammalian hard tissues ... 1
2.2 Currents strategies to mimic hard tissue extra cellular matrix ... 2
2.3 Expression of recombinant proteins in E. coli ... 4
2.4 The significance of the method used in this study to control crystal behavior ... 5
2.5 The significance of the method used in this study to engineer mammalian cells by bone mineralizing factors ... 6
3 CHAPTER II: BIOMINERALIZATION OF CALCIUM PHOSPHATE CRYSTALS CONTROLLED BY PROTEIN–PROTEIN INTERACTIONS ... 7
3.1 Objective ... 7
3.2 Materials And Methods ... 8
3.2.1 Cell strains, growth, cell maintenance and transformation ... 8
3.2.2 Construction of plasmid maps and cloning ... 9
3.2.3 Sequence alignments ... 12
3.2.4 Expression of recombinant proteins in E. coli ... 12
3.2.5 Purification of recombinant proteins ... 13
3.2.6 Verification of expression and purification ... 17
3.2.7 Protein quantitation ... 19
3.2.8 Analysis of enzyme kinetics... 20
3.2.10 Biomineralization of calcium and phosphate in the presence of recombinant proteins 22
3.3 Results and Discussion ... 25
3.3.1 Cloning, expression and purification... 25
3.3.2 Effect of recombinant proteins on enzyme kinetics ... 39
3.3.3 Secondary structure analysis ... 41
3.3.4 Effect of recombinant proteins on ALP-mediated in vitro biomineralization 45 4 CHAPTER III: ENGINEERING CELLS FOR BIOMINERALIZATION ... 66
4.1 Objective ... 66
4.2 Materials and Methods ... 67
4.2.1 Cell Lines ... 67
4.2.2 Differentiation of Pre-Osteoblast Cells ... 68
4.2.3 Plasmid construction ... 68
4.2.4 Transfection ... 69
4.2.5 mRNA and protein isolation ... 69
4.2.6 Quantitative Real Time PCR (qRT-PCR) ... 71
4.2.7 Immunocytochemistry (ICC) ... 71
4.3 RESULTS AND DISCUSSION ... 72
4.3.1 Cloning, expression and purification... 72
4.3.2 Transient transfection of mammalian cells for OCN and OPN expression .... 79
5 CHAPTER IV ... 86
5.2 BIBLIOGRAPHY ... 89
5.3 APPENDIX A ... 95
5.3.1 DNA sequences of genes and gene fragments ... 95
5.4 APPENDIX B ... 104
5.4.1 List of primers ... 104
5.5 APPENDIX C ... 107
5.5.1 Plasmid maps ... 107
5.6 APPENDIX D ... 112
5.6.1 Sanger sequencing results ... 112
5.7 APPENDIX E ... 116
5.7.1 Amino acid sequences of proteins ... 116
5.8 APPENDIX F ... 120
5.9 APPENDIX G ... 121
5.9.1 Secondary structure analysis. ... 121
5.10 APPENDIX H ... 1
LIST OF TABLES
Table A1. Nucleotide sequences of phoA, GST-OCN, OCN and OPN genes. ... 95 Table A2. Nucleotide sequences of cDNAs. ... 101
Table B1. Nucleotide sequences of primers used in cloning ALP, OCN and OPN genes. ... 104 Table B2. Nucleotide sequences of primers used in qRT-PCR reactions. ... 106
Table E1. Amino acid sequences of ALP, GST-OCN, OCN and OPN proteins. .... 116 Table E2. Amino acid sequences of mouse pre-osteoblast derived OCN and OPN proteins. ... 119
Table G1. Secondary structure prediction by Bestsel online tool. Secondary structure analysis of OCN and OPN proteins and their changes upon addition of CaCl2 (Ca2+), β-GP (organic phosphate, P) and Na2HPO4 (inorganic phosphate, Pi). The analysis was done based on the protocol described elsewhere. (Micsonai, Wien et al. 2015). ... 121
LIST OF FIGURES
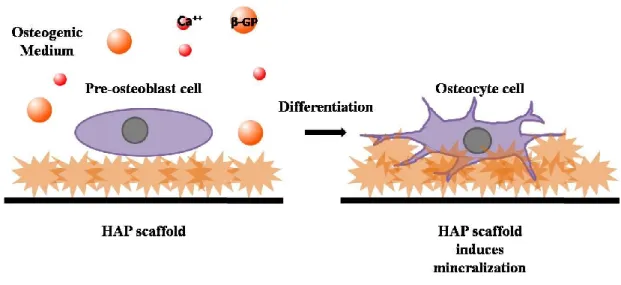
Figure 1. Graphical illustration depicting the effect of size/shape/CaP ratio controlled HAP scaffold on differentiation of osteoblast cells and induction of mineralization. In the presence of Ca2+ ions and organic phosphate source, pre-osteoblasts can differentiate into osteocyte cells and deposit inorganic matrix. HAP scaffold hastens mineral deposition and propagates osteoblast differentiation. ... 5 Figure 2. Graphical illustration depicting the effect of bone related proteins on reprogramming of somatic cells and induction of mineralization. In the presence of bone mineralizing proteins, Ca2+ ions and organic phosphate source, somatic cells can secrete inorganic matrix... 6 Figure 3. ALP is a conserved enzyme and functions similarly in several organisms. Multiple sequence alignment of ALP proteins from 4 selected organisms is
performed by Clustal Omega and is partially shown. ... 26 Figure 4. Amplification of phoA gene from bacterial genomic DNA. DH5α genomic DNA was used as a template to amplify phoA gene. PCR reaction was performed according to the protocol of Q5 Polymerase (NEB). 2-log DNA ladder (NEB) was used for detection. ... 26 Figure 5. Schematic diagram of ALP expression cassette. Native periplasmic space localization sequence was replaced with pelB periplasmic space localization peptide. His-tag was added after pelB to the N-terminal of the protein for detection of
expression and purification. GS linker provide flexibility to His-tag. T7 promoter and terminator were used for expression by T7 polymerase. ... 27 Figure 6. OCN gene was amplified by PCR. Synthetic OCN gene fragment was used as template in PCR. PCR reaction was performed according to the protocol of Q5 Polymerase (NEB). 50 bp ladder (NEB) was used for detection. ... 28 Figure 7. Schematic diagram of OCN expression cassette. GST tag added to the N-terminal of the protein for enhancing solubility, expression and purification. TEV recognition site was inserted between GST and OCN for removing GST after expression. His-tag was added to the C-terminal of the protein for detection of expression and purification. T7 promoter and terminator were used for expression by T7 polymerase. ... 29
Figure 8. OPN gene was amplified by PCR. Synthetic OPN gene fragment was used as template in PCR. PCR reaction was performed according to the protocol of Q5 Polymerase (NEB). 2-log DNA ladder (NEB) was used for detection. ... 30 Figure 9. Schematic diagram of OPN expression cassette. His-tag was added to the C-terminal of the protein for detection of expression and purification. T7 promoter and terminator were used for expression by T7 polymerase... 30 Figure 10. Agarose gel electrophoresis image of pEt22b-ALP plasmid verification by restriction enzyme digestion. Uncut plasmid was used as digestion control (Lane 2). 3 colonies was selected to verify insertion of ALP into pEt22b by HindIII digestion (Lanes 3-5). Last plasmid in image has a higher band (6500 bp vs. 5000 bp), which verifies insertion. The ladder was 2-log DNA ladder (NEB) in Lane 1. ... 31 Figure 11. Agarose gel electrophoresis image of pGEX-6P1-OCN plasmid
verification by restriction enzyme digestion. Uncut plasmid was used as digestion control (Lane 2). 2 colonies was selected to verify insertion of OCN into pGEX-6P1 by BamHI and EcoRI digestion (Lanes 3-4). Last plasmid in image has a band (300-400 bp), which verifies insertion. The ladder was 2-log DNA ladder (NEB) in Lane 1. ... 32 Figure 12. Agarose gel electrophoresis image of pEt22b-OPN plasmid verification by restriction enzyme digestion. Uncut plasmid was used as digestion control (Lane 2). One of the colonies was selected to verify insertion of OPN into pEt22b by NotI and XhoI digestion (Lane 3). Last plasmid in image has a band (900 bp), which verifies insertion. The ladder was 2-log DNA ladder (NEB) in Lane 1. ... 33 Figure 13. Phosphatase assay detects overexpression of ALP in transformed cells. Overexpression of ALP in periplasmic extract of pET22b-ALP bacteria (A)
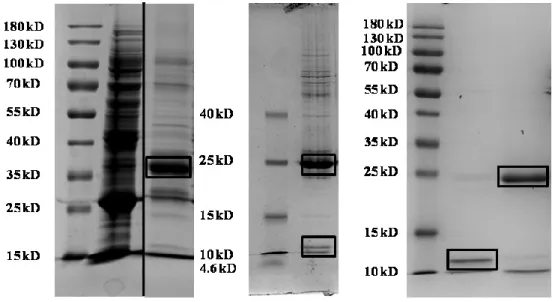
compared to that of control bacteria (B) after 4 hour IPTG (1 mM) induction at 200 RPM, 37 ºC. ... 34 Figure 14. Purification of ALP by IMAC detected by SDS-PAGE analysis. Lane 1 Page Ruler (NEB) ladder, Lane 2 cell lysate, Lane 3 purified ALP. Purification was done by either Cobalt resin or Ni-NTA resin. ... 35 Figure 15. Purification of ALP by IMAC detected by Western blot analysis. Lane 1 Page Ruler (NEB) ladder, Lane 2 purified ALP. Detection was done by anti-his-tag primary antibody, HRP-conjugated secondary antibody and ECL substrate. ... 35 Figure 16. Purification of OCN detected by SDS-PAGE. Image 1: Lane 1 Page Ruler
was done by either Cobalt resin or Ni-NTA resin. Image 2: Lane 1 Spectra Low Range (NEB) ladder, Lane 2 GST (26 kD) and OCN (10 kD) were cut by TEV protease. Image 3: Lane 1 Page Ruler (NEB) ladder, Lane 2 OCN (10 kD), Lane 3 GST (26 kD). Purification was done by GST bind resin. ... 36 Figure 17. Purification of OCN by IMAC detected by Western blot analysis. Image 1: Lane 1 Page Ruler (NEB) ladder, Lane 2 purified GST-OCN (36 kD). Image 2: Lane 1 Spectra Low Range (NEB) ladder, Lane 2 GST-OCN (36 kD), GST (26 kD) and OCN (10 kD). GST-OCN were cut by TEV protease. Detection was done by anti-his-tag primary antibody, HRP-conjugated secondary antibody and ECL
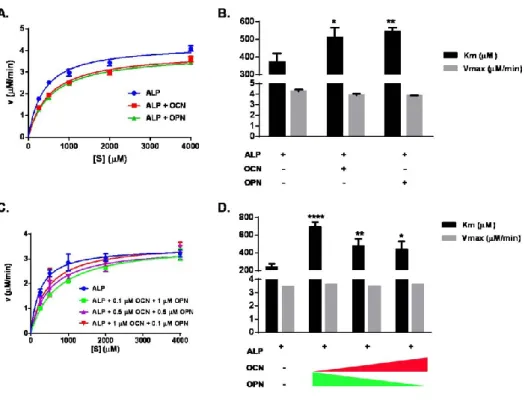
substrate... 37 Figure 18. Purification of OPN by IMAC detected by SDS-PAGE analysis. Lane 1 Page Ruler (NEB) ladder, Lane 2 cell lysate, Lane 3 purified OPN. Purification was done by either Cobalt resin or Ni-NTA resin. ... 38 Figure 19. Purification of OPN by IMAC detected by Western blot analysis. Lane 1 Page Ruler (NEB) ladder, Lane 2 purified OPN. Detection was done by anti-his-tag primary antibody, HRP-conjugated secondary antibody and ECL substrate. ... 38 Figure 20. Michaelis-Menten kinetic analysis of ALP activity in the presence of OCN and OPN. A. ALP activity in the presence of OCN or OPN. B. Vmax and Km of ALP in the presence of OCN or OPN. Km (µM), the reaction rate constant, increased in the presence of OCN and OPN. C. ALP activity in the presence of varying
concentrations of OCN and OPN. D. vmax and km of ALP in the presence of OCN and OPN. Km, the reaction rate constant, increased in the presence of varying
concentrations of OCN and OPN. Vmax (µM pNP/min) is constant for all cases. Experiment was performed in triplicate. Nonlinear regression curve fitting was performed to fit experimental data on Michaelis-Menten curve (A-C). TWO-WAY ANOVA was performed to compare each group with ALP only group (B-D). Vmax was not statistically significant while km significantly increased for all groups. ... 40 Figure 21. CD spectrum measurement for secondary structure analysis of OCN and OPN in the presence of biomineralization molecules. A.OCN helical and anti parallel structures was increased following the addition of Ca2+. B-C. α-helical structure of OCN is disrupted in the presence of inorganic phosphate, not organic phosphate. D. Secondary structure of OPN following the addition of Ca2+ is largely conserved. E-F. OPN becomes more compact in the presence of inorganic phosphate, not the organic phosphate. ... 44
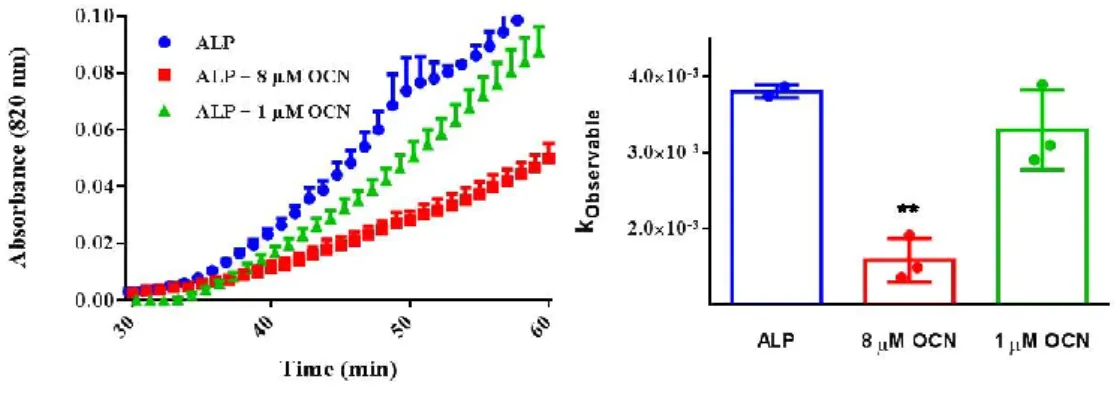
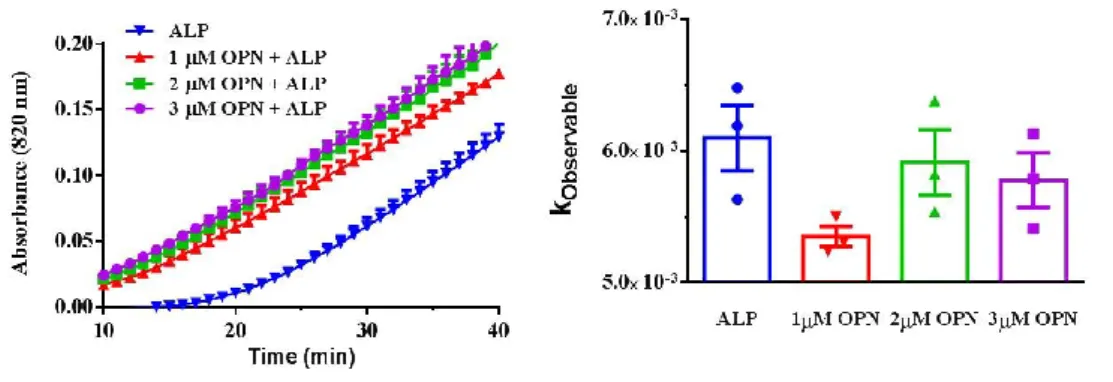
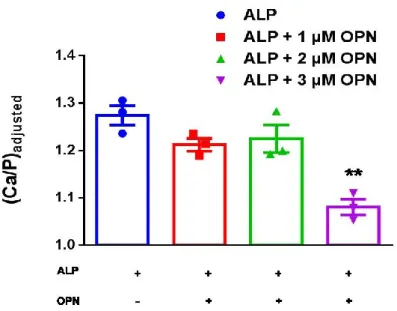
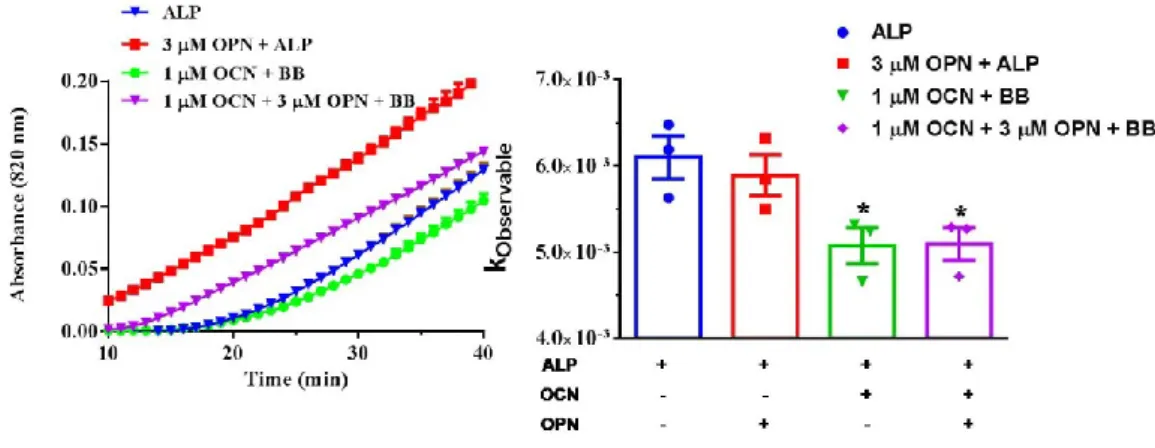
Figure 22. In vitro biomineralization in the presence of ALP and OCN-Pi. A. Initial mineral formation was detected by spectrophotometer when OCN and ALP were added into the reaction before BB (Ca2+ and β-GP). Initial mineral formation rate was calculated based on first 30 minutes of mineral formation. The legends in the first graphic are also valid for the columns in kobservable graphic. Statistical analysis was performed in Graphpad Prism software by One-Way ANOVA. BB: 24 mM CaCl2, 14.4 mM β-GP, 25 mM Tris-HCl (pH=7.4) ALP (5 U), 1 mM MgCl2 used for each reaction. All samples are in 25 mM Tris-HCl, pH=7.4. ... 47 Figure 23 In vitro biomineralization in the presence of ALP and OCN-Ca2+. A. Initial mineral formation was detected by spectrophotometer when OCN and BB Ca2+ and β-GP) were added into the reaction before ALP. Initial mineral formation rate was calculated based on first 30 minutes of mineral formation. The legends in the first graphic are also valid for the columns in kobservable graphic. Statistical analysis was performed in Graphpad Prism software by One-Way ANOVA. BB: 24 mM CaCl2, 14.4 mM β-GP, 25 mM Tris-HCl (pH=7.4) ALP (5 U), 1 mM MgCl2 used for each reaction. All samples are in 25 mM Tris-HCl, pH=7.4. ... 47 Figure 24. Electron microscopy imaging of in vitro biomineralization in the presence of ALP and OCN. A. SEM imaging of mineral formation in the presence of ALP after 24 h of incubation at 37 ˚C. B. SEM imaging of mineral formation in the presence of ALP and OCN after 24 h of incubation at 37 ˚C. A-B. Scale bars represent 1 µm. C. Crystal size is measured by the ImageJ program measure tool from SEM images from N=20 ± SEM and N=18 ± SEM crystals. Unpaired t-test was performed to analyze statistical significance. BB: 24 mM CaCl2, 14.4 mM β-GP, 25 mM Tris-HCl (pH=7.4) ALP (5 U), 1 mM MgCl2 used for each reaction. All samples are in 25 mM Tris-HCl, pH=7.4. ... 49 Figure 25. Ca:P ratio of the minerals formed in the presence of ALP and OCN after 24 h of incubation at 37 ˚C detected by XPS and EDS, respectively. 3 points with 400 µm spot size were selected for XPS scanning. Unpaired t-test was performed to analyze statistical significance. 5-6 points were selected EDS analysis. One-Way ANOVA was performed to analyze statistical significance. ... 52 Figure 26. Schematic representation of the reaction with ALP in the absence of OCN, and ALP was added into reaction before or after BB (Ca2+ and β-GP). ... 53 Figure 27. In vitro biomineralization in the presence of ALP and OPN-Ca2+. Initial
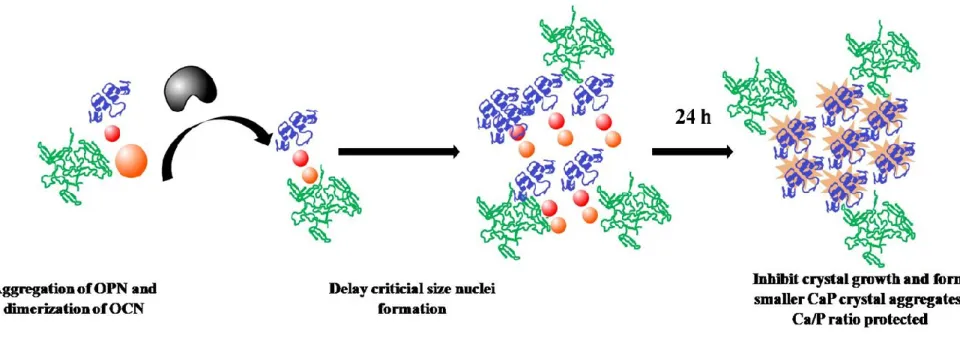
the reaction before ALP. Initial mineral formation rate was calculated based on first 30 min of mineral formation. (Error bars represents N=3 ± SEM.) The legends in spectrophotometry measurement graphic are also valid for the columns in kobservable graphics. Statistical analysis was performed in Graphpad Prism software by One-Way ANOVA. BB: 24 mM CaCl2, 14.4 mM β-GP, 25 mM Tris-HCl (pH=7.4) ALP (5 U), 1 mM MgCl2 used for each reaction. All samples are in 25 mM Tris-HCl, pH=7.4. ... 55 Figure 28. In vitro biomineralization in the presence of ALP and OPN-Pi. Initial mineral formation detected by spectrophotometer when ALP and OPN added into the reaction before BB. Initial mineral formation rate was calculated based on first 30 min of mineral formation. (Error bars represents N=3 ± SEM.) The legends in spectrophotometry measurement graphic are also valid for the columns in kobservable graphics. Statistical analysis was performed in Graphpad Prism software by One-Way ANOVA. BB: 24 mM CaCl2, 14.4 mM β-GP, 25 mM Tris-HCl (pH=7.4) ALP (5 U), 1 mM MgCl2 used for each reaction. All samples are in 25 mM Tris-HCl, pH=7.4. ... 55 Figure 29. A.SEM imaging of mineral formation in the presence of ALP after 24 h of incubation at 37 ˚C. B. SEM imaging of mineral formation in the presence of ALP and 3 µM OPN after 24 h of incubation at 37 ˚C. A-B. Scalebars represent 1µm. C. Crystal size is measured by the ImageJ program measure tool from SEM images from N=14 ± SEM and N=21 ± SEM crystals. Unpaired t-test was performed to analyze statistical significance. ... 57 Figure 30. Surface Ca:P ratio of the minerals formed in the presence of ALP and OPN after 24 h of incubation at 37 ˚C detected by XPS. 3 points with 400 µm spot size are selected for scanning. ONE-WAY ANOVA was performed to analyze statistical significance of each sample compared to ALP. ... 58 Figure 31. Illustration of initial and late phases of CaP crystal formation in the presence of ALP only, and both ALP and OPN... 60 Figure 32. In vitro biomineralization in the presence of ALP and varying
concentrations of OCN and OPN. Initial mineral formation detected by
spectrophotometer. Initial mineral formation rate calculated based on first 40 min of mineral formation (ONE-WAY ANOVA). BB: 24 mM CaCl2, 14.4 mM β-GP, 25 mM Tris-HCl (pH=7.4) ALP (5 U), 1 mM MgCl2 used for each reaction. All samples are in 25 mM Tris-HCl, pH=7.4. ... 62
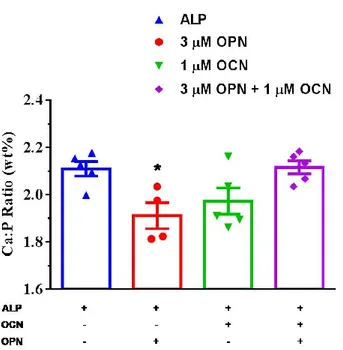
Figure 33. SEM imaging of mineral formation after 24 h of incubation at 37 ˚C in the presence of ALP only, ALP and 3 µM OPN, ALP and 1 µM OCN, and ALP,
combination of, 3 µM OPN and 1µM OPN, respectively. Scalebars represents 1 µm. ... 63 Figure 34. Ca:P ratio of the minerals formed in the presence of ALP and OCN after 24 h of incubation at 37 ˚C detected by EDS. 5-6 points were selected EDS analysis. One-Way ANOVA was performed to analyze statistical significance. ... 64 Figure 35. Illustration of initial and late phases of CaP crystal formation in the presence of ALP only, and ALP, OCN and OPN. ... 65 Figure 37. Differentiation of MC3T3 cells for osteoblastic gene expression. Alizarin Red Staining indicates CaP crystal formation of MC3T3 cells differentiated in osteogenic medium for 14 days. Scalebar represents 100 μm. ... 73 Figure 38. Schematic diagram of mOCN expression cassette. Kozak translation initiation sequence was added for enhanced expression. His-tag was added after a GS linker to the C-terminal of the protein for detection of expression. GS linker provides flexibility to His-tag. CMV promoter and BGH terminator were used for constitutive mammalian gene expression. ... 74 Figure 39. mOCN gene was amplified by PCR. mOCN cDNA was used as template in 2-step PCR. PCR reaction was performed according to the protocol of Q5
Polymerase (NEB). 2-log DNA ladder (NEB) was used for detection. Tm1= 53-62 ºC (55 ºC best), Tm2= 82 ºC. All temperatures worked. Lane 1: 2 log DNA Ladder (NEB) Lane 2-6: Gradient PCR reactions. ... 74 Figure 40. Linearization of plasmid vector pCDNA3-eGFP with HindIII and XbaI digestion. Lane 1 2-log DNA Ladder (NEB), Lane 2-3 double digested plasmid, Lane 4 uncut plasmid control. ... 75 Figure 41. Verification of mOCN-pCDNA3 Gibson Assembly. Restriction enzyme digestion was performed with EcoRI and KpnI. Lane 1: Ladder, Lane 2: uncut plasmid for 1st colony, Lane 3: Double digested plasmid. Lane 4: uncut plasmid for 2nd colony, Lane 5: Double digested plasmid. Lane 6: uncut plasmid for 3rd colony, Lane 7: Double digested plasmid. Lane 8: uncut plasmid for 4th colony, Lane 9: Double digested plasmid. Lane 10: uncut plasmid for 5th colony, Lane 11: Double digested plasmid. ... 76 Figure 42. Schematic diagram of mOPNa expression cassette. Kozak translation
linker to the C-terminal of the protein for detection of expression. GS linker provides flexibility to His-tag. CMV promoter and BGH terminator were used for constitutive mammalian gene expression. ... 77 Figure 43. mOPNa gene was amplified by PCR. mOPNa cDNA was used as template in 2-step PCR. PCR reaction was performed according to the protocol of Q5
Polymerase (NEB). 2-log DNA ladder (NEB) was used for detection. Lane 1: 2-log DNA Ladder (NEB), Lane 2-6: mOPNa. cDNA library template was amplified at 62-72 ˚C interval. 900 bp expected band was visible on gel. ... 77 Figure 44. Colony PCR of mOPNa-pCDNA3 plasmid construct with PFU
Polymerase. Lane 1: Ladder, Lane 2-5: mOPNa colonies 1-4 amplified at 67 ˚C, Lane 6: mOPNa plasmid (positive control). ... 78 Figure 45. Transfection of HEK293 cells with pCDNA-eGFP and PEI. 1:3 DNA:PEI ratio was used. PEI was prepared in 0.1 N HCl and in 100% EtOH, respectively. 105 cells were seeded each well in 24 well plate and they were allowed to grow for 24 h. 500 ng DNA was used for each group. DNA and PEI were premixed in serum-free DMEM 20 min before transfection. Images were taken 24 hours after transfection by an inverted fluorescent microscope. ... 80 Figure 46. Detection of mOCN and mOPNa mRNA levels in HEK293 cells by qRT-PCR. cDNA library was created from equal amount of mRNA from each biological triplicate before qRT-PCR. Equal amount of cDNA was used in technical triplicate. hGAPDH gene was used to normalize gene expression levels. Untransfected
HEK293 cells were used as negative control to calculate relative expression levels. 81 Figure 47. Protein expression analysis of mOCN in HEK293 cells by SDS-PAGE. Image 1. Cell lysate. Lane 1: Page Ruler Ladder (NEB), Lane 2: Untransfected cells. Lane 3: mOCN transfected cells after 48 h culture with plasmid. Image 2. Cell culture supernatant. Lane 1: Page Ruler Ladder (NEB), Lane 2: Control cells
without transfection cultured in the presence of osteogenic medium for 48 h, Lane 3: mOCN transfected cells after 48 h culture with plasmid. ... 82 Figure 48. Protein expression analysis of mOPNa in HEK293 cells by SDS-PAGE. Image 1. Cell lysate. Lane 1: Page Ruler Ladder (NEB), Lane 2: Untransfected cells. Lane 3: mOPNa transfected cells after 48 h culture with plasmid. Image 2. Cell culture supernatant. Lane 1: Page Ruler Ladder (NEB), Lane 2: Control cells
without transfection cultured in the presence of osteogenic medium for 48 h, Lane 3: mOPNa transfected cells after 48 h culture with plasmid. ... 82
Figure 49. Protein expression analysis of mOPNa in HEK293 cells by Western Blotting. Cell lysate. Lane 1: Page Ruler Ladder (NEB), . Lane 2: Control cells without transfection cultured in the presence of osteogenic medium. Lane 3: mOCN transfected cells, Lane 3: mOPNa transfected cells. Western Blot analysis was performed 48 h after transfection. ... 83 Figure 50. Protein expression analysis of mOCN and mOPNa in HEK293 cells by ICC. A,D. Untransfected HEK293 cells. B,E. mOCN transfected HEK 293 cells. C,F. mOPNa transfected HEK 293 cells. His Tag Monoclonal Antibody (HIS.H8) was used in 1:300 dilution in 5% milk powder in 1X PBS as primary antibody. Pierce Goat anti-Mouse IgG (H+L) Cross Adsorbed Secondary Antibody, DyLight 550 was used in 1:600 dilution in 5% milk powder in 1X PBS as secondary antibody. Images were taken fluorescent microscope. A-C. Overlay of brightfield and
fluorescent images. D-F. Fluorescent staining images. Scalebars represents 50 μm. 85
Figure C1. Schematic representation of pEt22b-pelB-6H-ALP plasmid. ... 107 Figure C2. Schematic representation of pGEX-6P1-GST-OCN-6H plasmid. ... 108 Figure C3. Schematic representation of pEt22b-OPN-6H plasmid. ... 109 Figure C4. Schematic representation of pCDNA3-OCN-4H plasmid. ... 110 Figure C5. Schematic representation of pCDNA3-OPN-4H plasmid. ... 111
Figure D 1. Sequencing alignment of pEt22b-ALP construct with phoA gene sequence. Analysis performed in Geneious R9.0.5 Software.
(Score = 5475.0, Identities = 1189/1458 (81%),
Positives = 1189/1458 (81%), Gaps = 261/1458 (17%)) ... 112 Figure D 2. Sequencing alignment of pGEX-6P1-GST-OCN-6H construct with synthetic OCN gene fragment sequence. Analysis performed in Geneious R9.0.5 Software. Score = 1170.0, Identities = 234/1151 (20%),
Positives = 234/1151 (20%), Gaps = 917/1151 (79%) ... 113 Figure D3. Sequencing alignment of pEt22b-OPN-6H construct with synthetic OPN gene fragment sequence. Analysis performed in Geneious R9.0.5 Software.
Score = 4275.0, Identities = 855/1230 (69%),
Figure D4. Sequencing alignment of pCDNA3-mOCN-4H construct with mOCN cDNA sequence. Score = 4835.75, Identities = 1013/5710 (17%),
Positives = 1076/5710 (18%), Gaps = 4632/5710 (81%) ... 114 Figure D5. Sequencing alignment of pCDNA3-mOPNa-4H construct with mOPNa cDNA sequence. Score = 1500.0, Identities = 293/307 (95%),
Positives = 293/307 (95%), Gaps = 13/307 (4%) ... 115 Figure D6. Sequencing alignment of mOPNa-4H (K30) and pCDNA3-mOPNa-4H (K30, D87Y) constructs with mOPNa cDNA sequence. First colony does not contain missense mutation while second colony has missense mutation. . 115
Figure F1. Standard curve for pNP concentration. (y = 47.19x - 1.655, R² = 0.998) ... 120 Figure F 2. Determination of ALP unit enzyme concentration. (y = 0.546x - 0.008, R² = 0.997) 1 U enzyme corresponds to the 1.98 fold ALP, which generates 1 µM pNP in 1 min. ... 120
Figure G1. Secondary structure analysis of OCN and OPN proteins and their changes upon addition of CaCl2 (Ca2+), β-GP (organic phosphate, P) and Na2HPO4 (inorganic phosphate, Pi). The analysis was done based on the protocol described elsewhere with Bestsel online tool.(Micsonai, Wien et al. 2015) ... 123
Figure H 1. Comparison of Ca:P ratio of the CaP crystals in our system with the commercial HAP. Ca:P ratio was calculated by XPS and EDS, respectively.
Measurements were done after 24 h of incubation at 37 ˚C. A. 3 points with 400 µm spot size were selected for XPS scanning. B. 5-6 points were selected EDS analysis. Unpaired t-test was performed to analyze statistical significance. ... 1
2 CHAPTER I: INTRODUCTION
2.1 The mechanism of biomineralization in mammalian hard
tissues
Bone tissue is composed of a dense extracellular matrix which is synthesized by two main cell types: osteoblasts and osteocytes, and degraded by another cell type, osteoclasts, each are differentiated from bone marrow stromal cells. (Liu, Luo et al. 2016) Osteoblasts are responsible for the formation of the organic part of the matrix, including Collagen (type I) 90%, noncollagenous proteins, proteoglycans,
glycosaminoglycans and lipids. Osteocytes are terminally differentiated forms of osteoblasts and they synthesize and are trapped inside inorganic matrix, primarily hydroxyapatite (Ca5(PO4)3(OH)2) crystals. (Crichton 2012)
HAP formation in bone is composed of two phases. In the first phase, matrix vesicles (MVs), which are membranous compartments, are released from osteoblasts. ALP is found both in ECM and in the membrane of MVs, and converts organic phosphate into inorganic phosphate (Pi). Ca2+ and Pi ions are internalized from ECM and amorphous CaP crystals are formed inside MVs. Amorphous CaP crystals were converted to octa-CaP (OCP) crystals, and OCP crystals were converted to HAP crystals. In second phase, HAP crystals penetrate MV membrane and secreted to the ECM. Continued nucleation of hydroxyapatite crystals in ECM is controlled by the levels of extra-vesicular Ca2+, Pi, and H+, as well as Ca2+-binding proteins including Collagen I, OCN, and OPN. (Golub 2009)
Collagen I is the most abundant protein in ECM of bone and serves as a template for the growth of crystals in parallel orientation. It is composed of triple helical fibers, and mineralization starts in gap regions of these fibers. (Crichton 2012) However, the presence of collagen I is not enough for mineralization, noncollagenous proteins (NCPs) play important roles in controlling mineralization process. NCPs control size, shape and Ca/P ratio of the crystals, inhibit mineralization to prevent excessive calcification and to provide c-axis elongated growth of crystals, and provide
uniformity to the crystals. (Gehron Robey 2008) Mainly, there are two class of NCPs in bone ECM, gamma-carboxylated proteins, and small integrin-binding ligand, N-linked glycoproteins (SIBLINGs). OCN and OPN belongs to these families,
respectively, and are the most abundant NCPs. OCN and OPN are both inhibitor of mineralization but OPN also acts as a nucleator when it is cross linked to the gap regions of the collagen fibers (Hauschka and Wians Jr 1989; Denhardt and Guo 1993; Ducy, Desbois et al. 1996; Kaartinen, Pirhonen et al. 1999).
2.2 Currents strategies to mimic hard tissue extra cellular matrix
Although hard tissues in the body are difficult to injure, the intrinsic healing capacity of these tissues is highly limited. (Edwards, Simmons et al. 1988) In addition, several diseases can affect homeostasis of bone and teeth, such as bone cancer, osteoporosis, and dental pulp infections. (Riggs and Melton 1986; Jemal, Siegel et al. 2008; Trope 2008) Commercial bone substitutes and dental prostheses for fracture healing and disease treatment are available. (Greenwald, Boden et al. 2001; Wittneben, Buser et al. 2014) However, the properties of these materials need to be enhanced in order to provide better osteointegration while controlling the bone regeneration rate and
preventing ectopic bone formation. (Puzas, Miller et al. 1989; Ai-Aql, Alagl et al. 2008)
Among synthetic bone substitutes, hydroxyapatite (HAP) grafts are one of the best in terms of their bioinertness and osteointegration capability. (Heise, Osborn et al. 1990; Landi, Celotti et al. 2003; Li, Yubao et al. 2005; Sadat-Shojai, Khorasani et al. 2013; Teotia, Raina et al. 2017). There are several methods for HAP synthesis; among them, wet chemical synthesis and high temperature synthesis are the most studied routes. (Sadat-Shojai, Khorasani et al. 2013) Despite their straightforward protocol, the methods suffer from many limiting factors. For example, wet chemical synthesis is the most promising method; however, precise control of crystallinity is not possible which yields a low number of ordered crystals and high impurity content. In addition, aging of crystals can take too long, which makes the process time-consuming. (Sadat-Shojai, Khorasani et al. 2013) High temperature synthesis of HAP can be a better alternative to wet synthesis in terms of a more pure phase composition and higher crystallinity, but it requires a high amount of energy to heat the sample up to 2000 ºC. (Sadat-Shojai, Khorasani et al. 2013)
Several organisms including mammalians can synthesize HAP crystals and other mineral forms. (Kirkham, Brookes et al. 2002) Organisms perform mineral synthesis with tight control mechanisms to provide high crystallinity and shape uniformity. Proteins, enzymes, and even small ions take part in this process. (D'Souza, Cavender et al. 1997; Gajjeraman, Narayanan et al. 2007; Abbarin, San Miguel et al. 2014; Ibsen, Gebauer et al. 2016; Siller Alejandro and Whyte Michael 2017; Tsao, Huang et al. 2017; O’Neill, Awale et al. 2018) These components possess important roles in hard tissue development, bone remodeling, and bone regeneration. (Romberg,
2017; O’Neill, Awale et al. 2018) Mimicking biological mineral formation has potential as a promising route for HAP synthesis, as the physiological conditions such as pH and temperature can be easily adapted to the in vitro environment. Synthesized HAP molecules can be better adapted to the host tissue environment by biomimetic mineral formation. (Kikuchi, Ikoma et al. 2004; Wang, Guan et al. 2007; Cai, Mei et al. 2010; Yang, He et al. 2011)
2.3 Expression of recombinant proteins in E. coli
Purification of proteins from bone tissue is a laborious work to study the interaction of these proteins in vitro. In addition, purification of the proteins may alter the secondary structure and functionality of the proteins since harsh conditions are applied during the extraction. (Prince, Oosawa et al. 1987) On the other hand, bacterial platforms are easy to handle for production and purification of recombinant proteins. (Guan and Dixon 1991; Baneyx 1999; Sørensen and Mortensen 2005; Choi, Keum et al. 2006; Structural Genomics, Architecture et Fonction des
Macromolécules et al. 2008) Several bone-related proteins are successfully produced and purified in these platforms, and they were investigated for their
biomineralization activities. (Sampath, Maliakal et al. 1992; Käkönen, Hellman et al. 1996; Smith, Cheung et al. 1996; Xiong, Yu et al. 2002; He, Dahl et al. 2003;
Tartaix, Doulaverakis et al. 2004; Lee, Kim et al. 2012; Svensson Bonde and Bulow 2012; Yun, Kim et al. 2012)
2.4 The significance of the method used in this study to control
crystal behavior
In this study, in vitro biomineralization of calcium phosphate (CaP) crystals was controlled in a truly biomimetic system composed of ALP, OCN and OPN, which are the main components of bone ECM. While ALP is enough for mineral formation, the reaction rate, size, and shape of the crystals were affected by the presence of OCN and OPN. Controlled HAP growth will improve construction of mammalian hard tissue environment-mimicking matrices and tissue scaffolds in order to provide bone healing at the fracture site. These matrices will be suitable candidates to host hMSCs and pre-osteoblast cells. Fine-tuning/manipulation of OCN-OPN concentrations and ratio can create a valuable platform to control biomineralization in bone regeneration and tissue repair. (Figure 1)
Figure 1. Graphical illustration depicting the effect of size/shape/CaP ratio controlled HAP scaffold on differentiation of osteoblast cells and induction of mineralization. In the presence of Ca2+ ions and organic phosphate source, pre-osteoblasts can differentiate into osteocyte cells and
deposit inorganic matrix. HAP scaffold hastens mineral deposition and propagates osteoblast differentiation.
2.5 The significance of the method used in this study to engineer
mammalian cells by bone mineralizing factors
Differentiation of osteoblast cells from mesenchymal stem cells in vitro is a promising route for in vitro bone tissue formation. However, it is hard to isolate MSCs from human and the differentiation capacity of these cells varies from patient to patient. Therefore, a platform for generation of bone-type minerals by
non-mineralizing somatic cell types is needed. Engineering of somatic cells is necessary to make them suitable for bone type mineral formation. In order to achieve this, bone ECM specific proteins were produced in mammalian cells. Main mineral-controlling proteins, OCN and OPN, were successfully produced in this work. They have huge potential to provide reprogramming somatic cells in order to achieve mineralization in different non-osteoblast cell lines. The reprogrammed cells can be a better
alternative to the mesenchymal cells to provide bone tissue regeneration and healing at the fracture site. (Figure 2)
Figure 2. Graphical illustration depicting the effect of bone related proteins on reprogramming of somatic cells and induction of mineralization. In the presence of bone mineralizing proteins, Ca2+
3 CHAPTER II: BIOMINERALIZATION OF CALCIUM
PHOSPHATE CRYSTALS CONTROLLED BY PROTEIN–
PROTEIN INTERACTIONS
3.1 Objective
Gene transfer from one organism to another by synthetic biology made production of proteins in different organisms possible. By this way, human proteins were
successfully produced and isolated from bacterial and yeast cells with high yield and low cost. (Swartz 2001; Sanchez-Garcia, Martín et al. 2016) Production of insulin in bacterial cells was a breakthrough in recombinant protein technology, which
eliminated the risk of immunogenicity of animal derived insulin and reduced the cost of exogenous insulin drugs used in diabetes treatment. (Keen, Pickup et al. 1980) Other drugs were also developed by recombinant technology including recombinant human erythropoietin for treatment of anemia, human growth hormone, for treatment of the growth hormone deficiency, recombinant hirudin for treatment of thrombotic disease. (Lee-Huang 1984; Shin, Kim et al. 1998; Tan, Wu et al. 2002; Choi and Lee 2004) For the treatment of bone-related diseases such as acute tibial fractures and osteoporosis, human bone proteins can be used directly or these proteins can be used for biomimetic mineral scaffold formation. (Liu, Luo et al. 2016)
In this part of my thesis project, expression and characterization of important bone mineralizing proteins, ALP, OCN, and OPN in bacterial platforms was achieved. Understanding and optimization of in vitro biomineralization activities with these
proteins gave us the opportunity to produce biomimetic minerals for bone regeneration applications.
3.2 Materials And Methods
3.2.1 Cell strains, growth, cell maintenance and transformation
E. coli DH5α strain was used in this study for cloning. E. coli DH5α strain contains
mutations in recA1 and endA1 genes which increase transformation efficiency. Plasmid recombination is reduced and plasmid stability is increased by recA1,
plasmid yield is improved by endA1. (Singer, Eiteman et al. 2009; Borja, Meza Mora et al. 2012) Cell stocks was prepared in freezing medium containing 25% glycerol in Lysogeny Both (LB) medium in order to maintain viability in the long term. E. coli BL21 (DE3) strain was used for protein expression and purification. This strain encodes T7 polymerase under the control of Lac promoter and is deficient of proteases for improving protein yield. (Jeong, Barbe et al. 2009) Both strains were inoculated in LB medium and incubated on LB agar at 30 or 37 ºC.
Chemical transformation was performed for the uptake of plasmids into bacterial cells. Chemically competent cells were prepared by TSS (Transformation and
Storage Solution) buffer (PEG 8000 20% (w/v), DMSO 10% (w/v), MgCl2 100 mM, in LB). Briefly, bacterial cells were inoculated in LB medium overnight and diluted in LB in 1:100 ratio. The bacterial cells were grown until OD600 becomes 0.2-0.5, incubated on ice for 10 min and centrifuged at 3000 RPM, +4 ºC. LB-supernatant was removed, the bacterial cells were resuspended in 1:10 volume of TSS buffer
compared to morning growth and aliquoted into pre-chilled microcentrifuge tubes. Positive control was done by transformation of an existing plasmid, negative control was done by spreading cells into several LB agar plates containing different
antibiotics (ampicillin, chloramphenicol, kanamycin). The aliquots were stored at -80 ºC for several months.
The competent cells were used for transformation of plasmids. First, the competent cell stock was thawed on ice for 10 minutes, intact plasmid, ligation or Gibson assembly reaction mix was added on competent cells, incubated on ice for 10 minutes. The cells were heated at 42ºC for 45 seconds for plasmid uptake via heat-shock, incubated on ice for 5 more minutes and diluted in 1 ml LB medium. Diluted cells were inoculated at 37 ºC for 30-60 minutes in shaking incubator. Cells were centrifuged at 13000 RCF for 1 minute, excess supernatant was removed, the cells resuspended in remaining medium and spread onto antibiotic containing LB-agar plate. The plate was incubated at 37 ºC overnight for single-colony growth.
3.2.2 Construction of plasmid maps and cloning
ALP is a phosphatase, which has a universal function, generating inorganic
phosphate by breaking phosphate bonds in organic phosphorylated molecules. The corresponding gene, phoA, is a universal gene with conserved domains and function. (Galperin and Jedrzejas 2001) E. coli ALP works in the same manner with human ALP. (Halford, Schlesinger et al. 1972) Therefore, bacterial ALP is used in this study. E. coli ALP was amplified by the primers listed in Table B1. E. coli
cloning with modifications. Polyhistidine tag coding sequence was added the 5' of the multiple cloning site (MCS). 6 Histidine residues was expressed at the N-terminal of the protein after pelB periplasmic space localization signal peptide. Plasmid map was shown in Figure C1.
BamHI-HF (NEB R3101S) and XhoI (NEB R0146S) was used to cut the plasmid by restriction digestion. 5472 bp linear vector was generated after restriction enzyme digestion. Same restriction enzymes were used to cut amplified phoA gene PCR product. 1356 bp insert was generated upon restriction enzyme digestion. T4 ligase (NEB M0202S) was used to ligate the vector and insert. 1:3 insert to vector molar ratio was used and the mix incubated at room temperature for 10 minutes. The
ligation mix was transformed into chemically competent E. coli DH5α bacteria. After overnight incubation, single colonies were selected and positive clones containing
phoA gene were verified by Sanger sequencing. (Figure D1)
Codon optimization of human OCN and OPN coding sequences were performed for overexpression of the proteins in E. coli K-12 strain. Online IDT codon optimization tool was used to generate sequences. (http://eu.idtdna.com/CodonOpt) Briefly, native signal sequences of both genes were excluded and the coding sequences of pro-proteins were analyzed based on E. coli codon usage. Rare codons in E. coli was changed to more frequently used codons in order to increase expression levels. The resulting sequences, synthetic OCN and OPN genes, were synthesized by Genscript Company. Nucleic acid sequences of synthetic OCN and OPN genes, and amino acid sequences of recombinant OCN and OPN were shown in Table A1, E1.
Gibson assembly method was used to clone synthetic OCN gene into pGEX-6P1 vector. GST fusion protein was placed before MCS of the vector in order to enhance
expression of non-native proteins. Moreover, TEV protease cleavage site was inserted to the 5' of OCN nucleotide sequence via PCR extension. TEV protease provides cleavage of GST fusion protein after expression and/or purification. Also, 6X-His coding sequence was inserted at the 3' of OCN nucleotide sequence so as to detect expression and for purification. Primers which were used to amplify synthetic OCN gene were listed in Table B1. For cloning, restriction enzyme digestion was performed to cut pGEX-6P1 vector with BamHI-HF(NEB R3136S) and EcoRI-HF (NEB R3101S) , 4999 bp linear vector was formed and verified by agarose gel electrophoresis. Gibson assembly was performed by using equamolar ratio of insert and vector according to the protocol used elsewhere. (Gibson, Young et al. 2009) Briefly, vector and insert were mixed in equimolar ratio in the reaction mix
containing exonuclease, polymerase and ligase. Exonuclease trims one of the strands in each DNA template, the resulting single stranded regions match and stick together since there is at least 20 bp overlapping homologous regions which were introduced to insert by extension PCR. Ligase closes the last gap between bases. Then, the assembly product was transformed into chemically competent E. coli DH5α bacteria. After overnight incubation, single colonies were selected and positive clones
containing synthetic OCN gene (273 bp) was verified by Sanger sequencing. (Figure D2)
Standard ligation method was used to clone synthetic OPN gene into pET22b(+) vector, which contains 6x-His tag coding sequence before stop codon. The primers listed in Table B1 was used to amplify synthetic OPN gene via PCR. Restriction enzyme digestion was performed to cut pET22b(+) vector, and synthetic OPN gene product with NotI-HF (NEB R3189S) and XhoI (NEB R0146S). 5492 bp linear vector and 855 bp insert were formed, respectively and agarose gel electrophoresis
was performed to verify digestion. Ligation was performed at room temperature for 10 minutes and the ligation mix was transformed into chemically competent E. coli DH5α bacteria. After overnight incubation, single colonies selected and positive clones containing synthetic OPN gene (855 bp) was verified by Sanger sequencing. (Figure D3)
3.2.3 Sequence alignments
The plasmid maps were designed by Benchling online tool for the insertion of the codon optimized gene fragments. After cloning, selected positive colonies was sequenced by Genewiz Company. The sequencing results were analyzed by
Geneious R9.0.5 software by pairwise alignment. The sequences of gene fragments in Benchling were used for comparison of identity. Automatically determine
direction, Global alignment with free end gaps, 65% similarity options were chosen for alignment.
3.2.4 Expression of recombinant proteins in E. coli
E. coli BL21 (DE3) strain was used to express ALP, OCN and OPN proteins. The
plasmids containing the synthetic genes of the proteins was isolated from DH5α bacteria and transformed into E. coli BL21 (DE3) strain via chemical transformation method described in 3.2.1. Expression of genes encoding ALP and OPN are
controlled by T7 promoter and expression of gene encoding OCN is controlled by Tac promoter. Both promoters were switched on in the presence of a commonly used
inducer, Isopropyl β-D-1-thiogalactopyranoside (IPTG). Bacteria containing
expression plasmids were inoculated overnight. Then, they were diluted at 1:50 ratio and inoculated for approximately 2 hours. 1 mM IPTG (Amresco 0487-10G), inducer of gene expression, was added when bacteria reaches OD=0.5-0.6, where they enter pre-log phase. In log phase, population density of the bacterial culture rapidly increases. Therefore, pre-log phase is the most suitable time for switching on inducible promoters. After several optimizations, induction of ALP was performed for 4 hours at 37 ºC, while induction of OCN and OPN were performed for 6-8 hours at 30 ºC. Following the induction of the proteins, bacterial culture centrifuged at 8000 RCF and the medium was discarded. Bacterial pellets were freezed at -80 ºC to keep the proteins intact until purification.
3.2.5 Purification of recombinant proteins
3.2.5.1 Cell Lysis
Bacterial pellet was obtained from 25 mL cell culture, the pellet was resuspended in 1 mL lysis buffer (50 mM Na2HPO4.2H2O (Merck 106342), 300 mM NaCl (Merck 1.06404-1KG), 10 mM Imidazole (VWR 0527-50G)), 1 mg/mL lysozyme (Sigma L6876-10G) and 1 mM phenylmethane sulfonyl fluoride (PMSF) (Amresco m145-5G). Cell lysis was provided by lysozyme and sonication. Sonication was made for 5 min on ice. Then, the cell lysate was centrifuged at maximum speed for 30-60
minutes to separate intact components from soluble proteins. The supernatant was filtered with 0.45 µm syringe filter (Isolab) before loading to mobile/immobile resin.
3.2.5.2 Purification of recombinant proteins by cobalt resin for small
scale purification
Cobalt resin was used to trap his-tagged proteins and separate them from the rest of the proteins. Imidazole groups of histidines can bind to cobalt ions on resins. Thus, they can be purified from cell lysate. 200 µL cobalt resin (Thermo Scientific 89964-10 ML) was washed with 1 mL wash buffer (50 mM Na2HPO4, 300 mM NaCl, 89964-10 mM Imidazole) to remove EtOH. Soluble proteins obtained from the previous step were mixed with cobalt resin and incubated at room temperature in an end-over-end rotator for 1 h. The resin was centrifuged at 700 RCF for 2 minutes to allow the resin to precipitate and washed with wash buffer 2-3 times with 1 ml of wash buffer in order to remove all non-specific proteins. Then, 100 µL elution buffer (50 mM Na2HPO4, 300 mM NaCl, 150 mM Imidazole) was mixed with the resin in an end-over-end rotator for 5 min and the resin was centrifuged at 700 RCF for 2 min. The supernatant contains eluted His-tag proteins since high imidazole concentration in elution buffer provides unbinding of His-tagged proteins from resin by replacing them. The elution was repeated for 5 times to elute all of the proteins bound to resin.
3.2.5.3 Purification of recombinant proteins by nickel column for
large scale purification
Nickel column (HisTrap HP 1 ml, GE Healthcare) was used to purify large quantities of proteins. Nickel column was washed with 10 volumes of ddH2O to remove EtOH. Then, the soluble part of the cell lysate were loaded to column in preparative high pressure liquid chromatography (Prep-HPLC, Agilent) device. Binding buffer (50 mM Na2HPO4, 300 mM NaCl, 20 mM Imidazole) was used for both binding and washing, and elution buffer (50 mM Na2HPO4, 300 mM NaCl, 500 mM Imidazole) was used for eluting proteins. The following reaction conditions were operated for purification: 35 min binding buffer for washing, 10 min elution buffer with 1 mL/min flow rate, 2 ml of elution aliquots was collected in fraction collector, 5 bar maximum pressure limit.
3.2.5.4 Removal of GST tag from OCN
GST was removed from OCN by TEV protease cleavage. Purified GST-OCN was concentrated to 1 ml with a 10 kDa cutoff filter unit (Thermo) and loaded into desalting column (Desalt 5 ml, GE Healthcare). Desalting column was washed with 10 ml ddH2O and was equilibrated with 5 ml 25 mM Tris Buffer prior to loading of the proteins. Then, the proteins were eluted in 2 ml 25 mM Tris Buffer.
Concentration of GST-OCN was determined by BCA assay and GST-OCN (2 ml) was mixed with TEV protease (1:100 ratio of TEV:GST-OCN). For efficient
cleavage by TEV protease, 100 µl of 20X TEV Reaction Buffer (1 M Tris-HCl (Sigma T5941-500G) (pH 8.0), 10 mM EDTA (Sigma E5134-500G)), and 20 µl of 0.1 M DTT (Invitrogen P2NY00147) were added into the reaction. Almost 90% of the protein was cleaved at room temperature when incubated for 16 h, which was detected by SDS-PAGE analysis.
After verification of efficient cleavage, the reaction mixture was concentrated to 1 ml with a 3 kDa cutoff filter unit (Millipore) and loaded to a desalting column. Desalting column was washed with 10 ml ddH2O and was equilibrated with 5 ml 20 mM
binding buffer prior to loading proteins. Then, the proteins were eluted in 2 ml 20 mM binding buffer. Then, binding to cobalt resin explained in section 3.2.5.2 was repeated. Thus, GST-OCN-His (Uncut protein), GST-TEV-His, OCN-His was bound and eluted with cobalt resin while GST remained in unbound fragment. The elution was concentrated to 1 ml with a 3 kDa cutoff filter unit, and loaded to a desalting column. The desalting column was washed with 10 ml ddH2O, and was equilibrated with 5 ml 1X PBS (prepared from 10X PBS stock containing 1.37 M NaCl, 26.8 mM KCl (Merck 1.04936-1KG), 0.1 M Na2HPO4, 17.6 mM K2HPO4 (Merck 1.05104-1KG), pH=7.4 by dilution with ddH2O) prior to loading the proteins. Then, the proteins were eluted in 2 ml 1X PBS.
GST Bind Resin (Novagen 70-541-3-10ML) was used to separate GST-TEV-His, and GST-OCN-His from OCN-His. 1 mL of the GST resin was washed twice with 2.5 mL 1X PBS to remove EtOH. The proteins obtained from the previous step were added onto the GST Bind Resin. Binding of the GST-tagged proteins to GST-Bind Resin was performed at room temperature for 1 h in an end-over-end rotator. Then, the resin was centrifuged at 500 RCF for 5 min. The unbound fragment and first 2
washes contain almost pure OCN-His and were collected. GST-tagged proteins were eluted at least twice in 250 µL GST Elution Buffer (50 mM Tris-HCl, 10 mM L-Glutathione, reduced (Cayman Chemical 10077461-10G), pH=8.0).
The unbound proteins were concentrated to 1 ml with a 3 kDa cutoff filter unit, and loaded to a desalting column. Desalting column was washed with 10 ml ddH2O and was equilibrated with 5 ml 25 mM Tris or OCN storage buffer (0.121% Tris, 50% Glycerol, 0.435% Sodium chloride). Then, the proteins were eluted in 2 ml 25 mM Tris or OCN Storage Buffer for either immediate use or -20/-80 ºC storage,
respectively.
3.2.6 Verification of expression and purification
3.2.6.1 SDS-PAGE and Coomassie Blue Staining
2.2 ml ddH2O, 2.6 ml 1.5 M Tris-HCl (Sigma) (pH 8.8), 100 µl 10% (w/v) SDS, 5 ml Acrylamide/Bisacrylamide (VWR) (30%/0.8% w/v), 100 µl 10% (w/v) APS (Biorad Ammonium persulfate), 10 µl tetramethylethylenediamine (TEMED) (Biorad) were used to prepare 15% SDS resolving gel. 3.2 ml ddH2O, 2.6 ml 1.5 M Tris-HCl (pH 8.8), 100 µl 10% (w/v) SDS, 4 ml Acrylamide/Bisacrylamide (30%/0.8% w/v), 100 µl 10% (w/v) APS, 10 µl TEMED were used to prepare 12% SDS resolving gel. 2.975 ml ddH2O, 1.25 ml 0.5 M Tris-HCl (pH 6.8), 50 µl 10% (w/v) SDS, 0.67 ml Acrylamide/Bisacrylamide (30%/0.8% w/v), 50 µl 10% (w/v) APS, 5 µl TEMED were used for preparing the stacking gel. Resolving gel was allowed to dry for 30
min at room temperature after addition of 250 µl isopropanol. Stacking gel was added after complete removal of isopropanol, the combs were placed immediately, and the gel was allowed to dry for 30 min at room temperature before use.
4 µl 6X Laemmli sample buffer (1.2 g SDS (sodium dodecyl sulfate), 6 mg
bromophenol blue, 4.7 ml glycerol, 1.2 ml Tris (0.5M, pH 6.8), 2.1 ml ddH2O), and 20 µl protein were mixed prior to loading SDS gel. Cell lysates were denatured at 95 ºC for 5 min. 12% SDS gel was used to detect proteins higher than 15 kD (ALP and GST-OCN and OPN ) and 15% SDS gel was used to separate proteins as low as 10 kD (OCN).
SDS-PAGE was performed at 120-190 V for 45-90 minutes for an efficient protein separation. For detecting whole proteins, the gels were stained with Coomassie Brilliant Blue (CBB) Solution (45 MetOH%, 10% glacial acetic acid, 3 g/L CBB R250 (Sigma 27815-25G)), and destained in destaining buffer (10% acetic acid, 30% methanol). For detecting his-tagged proteins, the proteins on gel were transferred to a PVDF (Thermo Scientific 88520) membrane.
3.2.6.2 Western blotting
The proteins were transferred to a PVDF membrane in a Transblot Turbo Transfer System (Biorad). Transfer conditions were as following for ALP, GST-OCN and OPN: 25 kV, 1.3 A for 7 min. Transfer conditions for OCN were as following: 25 kV, 1.3 A for 5 min. The membrane was incubated in blocking solution (3% milk powder in 1X TBS-T) for 1 h in a rotator at room temperature. Immediately after
blocking, the membrane was transferred to the primary antibody solution (1: 10000 dilution of mouse anti-6X-His Tag mAb (HIS.H8) (PTGLAB 66005-1-1G-0.15 ML) in 5% milk powder in 1X TBS-T). Primary antibody was allowed to bind His-tagged proteins on membrane for 1 h at room temperature or for overnight at +4 ˚C in a rotator. Prior to and after incubation in secondary antibody solution (1: 10000 dilution of Goat anti-mouse IgG H&L (HRP) (Abcam ab6789-1 MG) in 5% milk powder in 1X TBS-T), the membrane was washed 3 times in 1X TBS-T for 5, 15, 5 min in a rotator at room temperature. Secondary antibody binding was performed at room temperature for 1 h in a rotator. ECL Substrate (Biorad 170-5060-200 ML) was used to detect the secondary antibody. Briefly, the membrane was incubated in 1 ml of substrate solution in dark without agitation and imaged immediately in ChemiDoc MP Imaging System (Biorad).
3.2.7 Protein quantitation
Serial dilutions of BSA (2 mg/mL, Pierce 23209) were prepared and used to form a standard curve. Equal amount of BSA standard curve samples and protein of interest were placed in 96-well plates in triplicate. BCA Protein Assay Kit (Pierce 23225) was used to measure protein concentrations. Reagent A and Reagent B was mixed in 50:1 ratio prior to measurement and 200-260 µl of mix was added on proteins by a multichannel pipette. The plate was incubated at 37 ºC for 30 min, and was read in SpectraMax M5 spectrophotometer (Molecular Devices) at 562 nm absorbance. Protein concentrations were automatically calculated by the standard BCA assay protocol in SoftmaxPro software.
3.2.8 Analysis of enzyme kinetics
3.2.8.1 Determination of unit enzyme concentration
ALP in 25 mM Tris (pH 7.4) was diluted, and 7 serial dilutions were prepared. 0.5 mM pNPP and ALP were incubated at 37 ºC for 5 min. ALP and pNPP (Sigma 20-106 EMD MILLIPORE) were mixed in 1:1 ratio, and each reaction was prepared in triplicate. Absorbance measurement was performed in a spectrophotometer at 405 nm. pNP (Fluka 35836) was used to prepare standard curve. 140 µM pNP was used as the starting substrate for serial dilutions. 7 serial dilutions was prepared.
Absorbance measurement was performed at 405 nm at spectrophotometer. ALP converted pNPP into pNP, and pNP concentration was calculated based on the standard curve. (Figure F1) Then, the reaction velocity (pNP/min) was calculated. The concentration of ALP which generates 1 µM pNP in 1 min was determined as 1 U enzyme. (Figure F2)
3.2.8.2 ALP enzymatic activity in the presence of OCN and OPN
4 mM pNPP substrate was prepared in pNPP reaction buffer (0.1 M Lysine (Amresco 0167-1 KG), 1 mM MgCl2 (Sigma M4880-100 G), 1 mM ZnCl2 (NEB 7646-85-7)). 5 serial dilutions of pNPP were performed in the pNPP reaction buffer. 1 U ALP (25 mM Tris, pH=7.4) was used for each reaction in the presence of OCN, OPN, both or none. Each reaction was performed in triplicate at 37 ºC for 10 min.
Absorbance measurement was performed at 405 nm at spectrophotometer. pNP standard curve which was prepared previously was used to calculate pNP
concentration and reaction velocity (µM pNP/min). Michaelis-Menten graphics were generated at Graphpad Prism 6 software. Then, reaction rate constant, km (µM), and maximum velocity, vmax (µM/min), values were calculated. Nonlinear regression curve fitting was performed to fit experimental data with the maximum number of iterations (95% confidence interval, R2>0.9 for each group). Second order
polynomial smoothing and 4 number of neighbors averaging were applied on the curves of Michaelis-Menten graphs. Statistical significance of km and vmax values were calculated by TWO-WAY ANOVA in Graphpad Prism 6 software.
3.2.9 Secondary structure analysis by circular dichroism (CD)
measurement
CD Spectra Measurement Device (Jasco J-815) was used to analyze the secondary structures of OCN and OPN. In addition, the effects of calcium and phosphate on the secondary structure of the recombinant proteins were analyzed. A temperature gradient was selected between 22 and 37 ºC with 5ºC intervals, 300 sec delay time, 1 mm band width. OCN and OPN proteins were prepared in 25 mM Tris, pH=7.4. 1 M CaCl2 (Merck 1.02378-500 G), 1 M Na2HPO4, or 1 M β-GP (Calbiochem 35675-100 G) was used to analyze the interaction of the proteins with calcium, organic and inorganic phosphate. 5 mM CaCl2, Na2HPO4 and β-GP was used in the analysis.
3.2.10 Biomineralization of calcium and phosphate in the presence of
recombinant proteins
CaP crystal formation in the presence of ALP, organic phosphate source (β-GP), and calcium was studied. The effect of the most abundant bone mineralizing extracellular matrix proteins, namely OCN and OPN, on CaP crystal formation was analyzed. To do this, a biomineralization buffer (BB) was prepared based on the protocol
described elsewhere. (Gungormus, Fong et al. 2008) The BB was prepared as 2X (48 mM CaCl2, 28.8 mM β-Glycerophosphate, 25 mM Tris-HCl pH 7.4) and used 100 µl for each 200 µl reaction. 200 µl reaction was composed of 1X BB, 1 mM MgCl2, 5 U ALP, and varying concentrations of OCN and OPN.
3.2.10.1
Spectrophotometry measurements
The reaction was performed in 96 well plate for spectrophotometry measurements in SpectraMax Microplate Reader. A light scattering measurement at 820 nm
absorbance was performed for 1 h with 1 min intervals at 37 ºC so as to detect initial CaP crystal formation. All reactions were performed in triplicate for statistical analysis. After about 20 min, the reaction becomes observable. The slope of the first 30-40 min of CaP formation reaction was calculated (R2>=0.98), and designated as observable reaction rate constant (kobservable).
3.2.10.2
Imaging of CaP crystals by electron microscopy
The plate was incubated at 37 ºC for up to 24 h to prepare samples for scanning electron microscopy (SEM) imaging and energy-dispersive X-ray spectroscopy (EDS) analysis. Briefly, silicon wafer was cut into small pieces and washed with isopropanol prior to sample preparation. 5 µL of sample from 200 µl CaP formation reaction was dropped onto a wafer, and incubated for 10 min at room temperature. The wafer was dried with a lint-free napkin carefully and washed twice with 1 µL ddH2O for 1 min each. The wafer was kept in a vacuum desicator till SEM imaging. Before imaging, the wafer surface was coated with 5 nm Au/Pd. The images were taken by E-SEM microscope (FEI‐Quanta 200 FEG). A representative image was shown in the figures for all groups. Crystal sizes were measured from SEM images by ImageJ Software. Statistical analysis of crystal size was done by Graphpad Prism 6 Software by unpaired t-test. The number of size measurements, the mean size, and standard error mean (SEM) values were indicated in both results section and in figure captions. EDS analysis was performed with EDAX Genesis software attached to the SEM microscope. Same operating conditions were used for all measurements (Accelerating voltage: 5 kV, Spot size 3.0).
3.2.10.3
Quantitative analysis of Ca/P ratio and determination of
crystallinity by X-ray photoelectron spectroscopy (XPS)
analysis
CaP crystal formation reaction was transferred to a low-binding microcentrifuge tube after incubation at 37 ºC for 24 h. The sample was centrifuged at 8000 RCF for 8 min and supernatant was removed. 100 µL of pH 10 water (10% NH4OH) was added onto the tube to stop reaction, and the tube was centrifuged at 8000 RCF for 8 min. Supernatant was removed, and the sample was washed with 100 µL EtOH. The sample was centrifuged at 8000 RCF for 8 min, supernatant was removed, and the sample powder was air dried for at least 3-5 min. The sample was kept at room temperature until analysis. The elemental composition of sample was analyzed by XPS (Thermo Scientific K‐Alpha spectrometer). The binding energy (BE) scale was adjusted based on the measurement of adventitious C (284.6 eV). The survey scan was acquired with scan number 2 and the high resolution detailed scans of Ca(2p), P(2p), O(1s) and C(1s) were acquired with scan number 10-30 based on the intensity of the signal. 400 µm spot size was chosen for each point and all samples were scanned from 3 different points. Adjusted Ca/P ratio was calculated based on the protocol described in a previous research in the literature (Lu, Campbell et al. 2000). Statistical analysis of Ca/P ratio was done by Graphpad Prism 6 Software by
unpaired t-test for comparing two samples, and by One-Way ANOVA for comparing more than two samples.