FAKULTÄT MASCHINENBAU
Master of Science in Manufacturing TechnologyInstitut für Umformtechnik und Leichtbau Prof. Dr.-Ing. Dr. h.c. Matthias Kleiner Prof. Dr.-Ing. Dr.-Ing. E.h. A. Erman Tekkaya
M a s t e r T h e s i s
Increasing Metal Utilization by Improved Drawbead
Design in Deep Drawing Operations
by Beyhan Mutlu
Registration Number: 153837
Supervisors:
Prof. Dr.-Ing. Dr.-Ing. E.h. A. Erman Tekkaya Prof. Dr.-Ing. Ziya Şanal
Registered on 03.06.2013 Submitted on 03.12.2013
Abstract
The deep drawing process is a commonly used forming process in several branches of industry such as the automotive industry, aircraft industry and the household appliances industry. Deep drawing tools are used to produce very large numbers of identical parts. Therefore, even small inefficiencies in metal utilization per part can cause very large amounts of wasted material over a deep drawing tool’s life. Drawbeads are commonly used in deep drawing processes to control the flow of the sheet metal into the die cavity. Use of drawbeads increases the amount of scrap metal in deep drawing operations. The primary motivation behind this thesis is to decrease the amount of scrap metal which is produced by the use of drawbeads, and therefore increase the metal utilization in deep drawing processes.
In this thesis, two different improved drawbeads are designed to increase the metal uti-lization in deep drawing operations. This study focuses on the drawbead restraining force generated from the improved drawbeads. 2D and 3D simulations were carried out for the analyses. In the simulations, commercial software programs ABAQUS/Standard and AutoForm were used. An experimental setup was built for the verification of the simulations and the results obtained by numerical simulations are compared with exper-imental results. DC04 and DP600 steels were used for the simulations and experiments. Comparison of the experimental and simulation results showed good agreement. The results of the simulations and the experiments indicate that, for the selected operations, the conventional drawbead can be replaced by the improved drawbeads, and therefore metal utilization of the process can be increased.
Keywords: Deep drawing, Drawbeads, Drawbead Restraining Force, Metal Utilization, Finite Element Simulations
Acknowledgements
This dissertation is the final task of the International Joint Degree Master’s Program in Master of Science in Manufacturing Technology (MMT). The Master of Science pro-gram was carried out in cooperation between Turkish-German University and TU Dort-mund University.
I would like to acknowledge the following individuals for supporting me through my Master’s degree and also in this research.
First of all, I would like to gratefully acknowledge the German Academic Exchange Service (DAAD) for providing me financial support throughout the Master’s degree. I would like to express my appreciation and thankfulness to my supervisor Prof. Dr.-Ing. Dr.-Dr.-Ing. E.h. A. Erman Tekkaya for his support, inspiration, constructive criticism and patience throughout this study. I am honored to be his student, and I am sure that all the things learned from him will benefit me all through my life. I would like to give my sincere appreciation to my other supervisor Prof. Dr.-Ing. Ziya Şanal for providing me the opportunity to become involved in this Master’s program.
I would like to express my gratefulness and appreciation to Assist. Prof. Dr. Celalettin Karadoğan for his guidance, suggestions and invaluable help. I also would like to ex-press my gratitude to Dipl.-Ing. Frank Steinbach for his help and constructive criticism on the thesis.
The thesis has been carried out at TOFAŞ Türk Otomobil Fabrikası A. Ş. in Bursa. The support provided by TOFAŞ is greatly acknowledged. I am very grateful to M.Sc. Ser-kan Ali Altınel, Die Design Administrator, for his profound trust, support and sugges-tions to this research. Special thanks are extended to my colleague Suat Özgen for his help, support and constructive criticism. I also would like to thank to all employees of the company for their help in performing experiments and willing to inform me about their experiences.
I also want to express my special gratitude to the MMT Office, especially to Ms. Andrea Hallen and Ms. Claudia Köster for their friendship and being there whenever I need help.
Almost last but not least, I would like to thank to my friend Sayako Kondo, whose in-valuable support, suggestions and friendship made great contributions to this work. Finally, I would like to appreciate my parents, sister and brother İlmiye Mutlu, Yakup Mutlu, Ferdi Mutlu and Hatice Mutlu for their patience, love, encouragement and infi-nite support during my whole life.
Table of Contents
List of Figures iii
List of Tables vi
Formula symbols and abbreviations vii
1 Introduction 1
1.1 Motivation and Objective of the Thesis ... 4
1.2 Outline of the Thesis ... 5
2 Theory 7 2.1 Formability of Sheet Metals ... 7
2.1.1 Anisotropy ... 8
2.1.2 Forming Limit Diagrams ... 9
2.2 Deep Drawing ... 11
2.2.1 Failure Modes ... 13
3 Basics of Drawbeads 15 3.1 Introduction ... 15
3.2 Analytical Drawbead Models ... 21
3.2.1 Simple Analytical Model ... 22
3.2.2 Weidemann’s Analytical Model ... 22
3.2.3 Kluge’s Analytical Model ... 24
3.2.4 Stoughton’s Analytical Model ... 25
3.3 Effects of Parameters on Drawbeads ... 27
3.3.1 Geometry Parameters ... 28
3.3.2 Material Parameters ... 29
3.3.3 Process parameters ... 30
3.3.4 Influence of Friction ... 31
3.4 Special Drawbead Concepts ... 35
4 Finite Element Simulations of Drawbeads 37 4.1 Introduction to Forming Simulation ... 37
4.2 Finite Element Models of Drawbeads ... 40
4.2.1 Geometrical Drawbead ... 40
4.2.2 Equivalent Drawbead ... 41
5 Numerical and Experimental Results 44 5.1 Simulative Analysis of Selected Parameters on Drawbeads ... 44
5.2 Improved Drawbead Geometries ... 54
5.2.1 Improved Rectangular Drawbead ... 56
5.2.2 Improved Circular Drawbead ... 60
5.3 Simulation Results of the Improved Drawbeads ... 60
5.4 Experimental Verification ... 62
6 Conclusion 70
List of Figures
Figure 1.1: Production steps of a body part. ... 4
Figure 2.1: Necking of sheet specimens under uniaxial tension: Figure 2.1 (a): Diffuse necking, Figure 2.1 (b): localized necking (Grote & Antonsson, 2009). ... 7
Figure 2.2: Forming limit diagram for plane stress (Tekkaya, 2012). ... 10
Figure 2.3: Deep drawing operation and its basic tools (N. N., 2013c). ... 12
Figure 2.4: Schematic diagram of the state of stress during deep drawing. Grey elements indicate elements before deformation, colorful elements indicate elements after defor-mation (Kalpakjian & Schmid, 2007). ... 12
Figure 2.5: Various failure modes in Deep Drawing: 1-Flange wrinkling; 2-Wall wrin-kling; 3-Part wrinwrin-kling; 4-Ring prints; 5-Traces; 6-Orange skin; 7-Lüder’s strips; 8-Bot-tom fracture; 9-Corner fracture; 10,11-Folding; 12-Earing; 13,14-Corner folding (Grote & Antonsson, 2009). ... 13
Figure 3.1: Deep drawing process including drawbead (Hosford & Caddell, 2011). 16 Figure 3.2: Drawbead forces (Çiçek, 2005). ... 16
Figure 3.3: The development of deformation and friction in a circular drawbead. ... 17
Figure 3.4 a): circular drawbead, Figure 3.4 b): rectangular drawbead, Figure 3.4 c): edge drawbead (Zhongqin & Gang, 2000). ... 18
Figure 3.5: Combined drawbead application, a double circular bead. ... 19
Figure 3.6: Position of drawbeads (N. N., 2003). ... 20
Figure 3.7: Arrangement of conventional drawbeads (Siegert, 1996 ). ... 20
Figure 3.8: Traditional drawbead layout and special run-out draw beads for higher strength steels (Keeler & Ulintz, 2013). ... 21
Figure 3.9: The drawbead geometry used in Weidemann’s model (Shuhui et al. 2001). ... 24
Figure 3.11: Galled die surface (Kim, 2008). ... 31
Figure 3.12: Macroscopic/Microscopic/Nanoscopic scale views of galling in deep drawing operations (Kim, 2008). ... 32
Figure 3.13: Surface treatment effects on tool wear in U- channel drawing of DP steel (Kim, 2008). ... 33
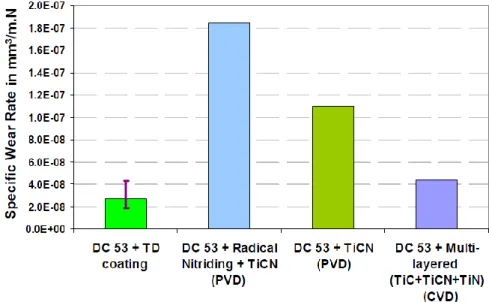
Figure 3.14: Specific wear rate results for DC 53 tool steel with different coatings (Cora, 2009). ... 34
Figure 4.1: Schematic drawing of a true drawbead and its equivalent drawbead repre-sentation (Meinders, 2000). ... 41
Figure 4.2: Modelling the true drawbeads on the equivalent drawbead (Quetting et al. 2013) ... 43
Figure 5.1: Basic formula of restraining force calculation on circular drawbeads (N, N., 2011). ... 46
Figure 5.2: Shape of the simulated part and equivalent drawbead lines. ... 48
Figure 5.3: Change in shape for different restraining forces. ... 48
Figure 5.4: Change in shape for DP600 due to springback. ... 49
Figure 5.5: 2D FE model used for the friction analysis. ... 50
Figure 5.6: DBRF results of the mesh sensitivity study. ... 51
Figure 5.7: DBRF results for different friction coefficients. ... 53
Figure 5.8: Dimensions of reference drawbead. ... 55
Figure 5.9 a): improved rectangular drawbead, Figure 5.9 b): improved circular draw-bead ... 55
Figure 5.10: Lengths of scrap after trimming off, Figure 5.10 a): reference drawbead, Figure 5.10 b): improved circular drawbead, Figure 5.10 c): improved rectangular drawbead. ... 56
Figure 5.11: 2D models of the improved rectangular drawbead located at different po-sitions. ... 57
Figure 5.12: DBRF results for different positions. ... 58
Figure 5.13: 2D finite element model of the female bead. ... 59
Figure 5.14: Maximum principal stress history for the critical elements. ... 60
Figure 5.15: Comparison of drawbead restraining forces for DC04. ... 61
Figure 5.16: Comparison of drawbead restraining forces for DP600. ... 61
Figure 5.17: Schematic diagram of the experimental setup for measuring drawbead re-straining force. ... 63
Figure 5.18: Drawbead sets for the experiments. ... 63
Figure 5.19: Experimental results of DBRF for DC04. ... 64
Figure 5.20: Experimental results of DBRF for DP600. ... 65
Figure 5.21: Removed coating layer by the rectangular drawbead. ... 66
Figure 5.22: Deformed strips after the experiments. ... 66
Figure 5.23: DBRF comparison for DC04. ... 67
List of Tables
Table 4.1: Commercial FEM codes for sheet metal forming simulations (Tekkaya,
2000). ... 38
Table 5.1: DBRF and estimated plastification values for the simulations. ... 47
Table 5.2: Dimensions of the conventional drawbead used in the industry. ... 50
Table 5.3: Results of the mesh sensitivity study. ... 51
Table 5.4: Results of the friction analysis. ... 54
Formula symbols and abbreviations
Formula Symbols
Symbol Unit Description
r
- Anisotropy coefficientr
n - Normal anisotropyΔr
- Plane anisotropyφ
- True straink
f MPa flow stressf
R - Restraining force factorμ
- Friction coefficientz
mm Distancew
mm Length of drawbeadR
mm RadiusF
N ForceE
GPa Young’s modulusσ
MPa Stressε
- Strainθ
- Contact angle𝜀̇
1/s Strain raten
- Strain hardening exponentm
- Strain rate exponents
m2 AreaIndices
Indice Description
0o Rolling direction
90o Transverse direction w Width direction t Thickness direction g Groove radius b Bead radius Abbreviations Abbreviation Description
DBRF Drawbead Restraining Force
FLD Forming Limit Diagram
FLC Forming Limit Curve
LDR Limiting Drawing Ratio
BHF Blankholder Force
BHDF Bead Hold-down Force
CVD Chemical Vapor Deposition
PVD Physical Vapor Deposition
TD Thermal Diffusion
GI Hot-dip Galvanized
GA Galvannealed
CAD Computer Aided Design
FEM Finite Element Method
FDM Finite Difference Method
EMBR Electromagnetic Blank Restrainer
BEM Bending Enhanced Membrane
1 Introduction
Sheet metal forming is one of the most widely used manufacturing processes in various industries such as producing industrial parts, office and home appliances, automobile body, airplane parts, food cans and civil engineering applications. Parts made from sheet metal can provide, with appropriate and suitable design, a high strength to weight ratio and high dimensional accuracy within certain tolerances. Therefore, sheet metal forming techniques are increasingly used from small household appliances through the automotive industry up to large aircraft structures.
The automotive industry has been one of the fastest growing industries in the world and it is the main driving force behind the developments in sheet metal forming technology. The International Organization of Motor Vehicle Manufacturers (OICA) announced that more than 84.1 million vehicles (including passenger cars and commercial vehicles) were produced in 2012. There was 5 percent increase in production compared to the previous year’s record. After a dramatic fall in 2009 to 61.8 million units due to the global financial crisis in 2008, the world vehicles production has clearly recovered glob-ally, with however sharp discrepancies depending on the various regions. Total produc-tion in Asia/Oceania increased 7.7 percent and reached 43.7 million units in 2012, fol-lowed by the Americas at 20 million units with 12.5 percent increase. However, produc-tion in Europe (including Russia, +12.1% and Turkey, -9.8%) was sharply reduced by 5.4 percent and 19.8 million vehicles produced in those countries. In 2012, global vehi-cle sales reached 81.7 million units with similar trends as observed for production. The difference between production and sales figures are due to non-recorded registrations in countries (vehicles for administration, military, embassies…). A total of 38 million ve-hicles were sold in Asia/Oceania/Middle East, 23.6 million veve-hicles in Americas and 18.7 million vehicles in Europe. For 2013, OICA expects the global market to remain positive overall. According to forecasts, the sales volume of vehicles all over the world will grow further by about 3 percent. Prospects in the European Union however are bleak. Blain (2013).
In 2012, 1072978 units of vehicles were produced and 817,620 units of vehicles were sold in Turkey. The Automotive Manufacturers Association (OSD) publicized that the
total production in the sector demonstrated 9.8 percent decline in 2012 and domestic retail sales declined by 10.2 percent. Although the Eurozone financial crisis has ad-versely affected Turkey’s exports, total vehicle production is expected to grow by 4.8 percent in 2013 according to Turkey’s Ministry of Development. Aksongur (2013), N. N. (2013a).
The figures explained above show that the automotive industry is undoubtedly one of the most influential contributors to the world’s economy. The automotive industry is a global industry, with an annual turnover of over €2 trillion, making it equivalent to the sixth largest economy in the world. N. N. (2013b). It is an important global driver of growth, income, employment, and innovation. Therefore, the worldwide automotive market is highly competitive. Factors affecting competition include product quality and features, brand values, model variety, innovation and development time, pricing, relia-bility, safety, emissions, fuel economy, customer service, warranty conditions and fi-nancing terms. The increased competition also leads to a very intense development ac-tivity to increase producac-tivity and to reduce material and costs. Tisza (2013).
The cost reduction of an existing product has been a principal focus of many car manu-facturers in the sector. There are many aspects that can be considered in order to reduce the cost. The main cost reduction aspect, which is related to sheet metal forming, is to minimize waste of material while maximizing the material utilization.
Deep drawing is a sheet metal forming process which is used to produce geometrical or irregular 3 dimensional shapes from sheet blanks. This process is used to produce very large numbers of identical parts. Therefore, it plays an extremely important role in the manufacture of automotive parts. Typical parts produced by deep drawing are beverage cans, containers, aircraft components and automobile panels such as fenders, quarter panels, hoods, door panels, roofs and deck lids. The first manufacture step in the pro-duction of body panels is deep drawing. In the process, the punch causes the workpiece to flow into the die cavity in order to obtain the final shape of the part. After the work-piece is completely drawn, the excess material around the outer section of the final shape will be trimmed off. This discarded part of the raw material is called scrap. Due to the high volumes of identical parts produced, even very small amount of scrap metal can
lead to very large amounts of wasted material over a deep drawing tool’s life. Amount of waste material decides the economic utilization of the products.
Typically, raw materials represent 45% to 75% of total cost in deep drawing operations. The total cost includes, manufacturing cost, die cost, labor cost etc. For large body pan-els, for example door panels and roofs, this ratio is between 60% and 75%. For small interior parts this ratio decreases down to 45% and 60%. Moreover, the metal utilization rate to produce an automotive body part is between 50% and 60%. As an example, in the production of a car roof with 55% material utilization rate and with the assumption of 70% raw sheet material to total cost ratio, the wasted material will represent 31.5% of total cost of the production.
To produce deep drawing parts from a sheet workpiece, the first step is to prepare blank layout for the part. That is, the dimensions of the sheet material that will be deep drawn into the designed part. However, the blank layout is generally larger than required sheet metal. There are several reasons which affect the dimensions of the blank layout. The first reason is the selection of process parameters used in deep drawing operation. The most important process parameter which affects the blank layout is the use of draw-beads. In automotive industry, generally irregular or very complex parts are produced and production of these parts without defects has vital importance in order to remain competitive in the global market. Drawbeads control the material flow during deep drawing and they are used to produce these complex parts without defects. The use of drawbeads enlarges the blank layout on the direction perpendicular to the drawbead line. For instance, with a 50 grams increase in the weight of blank layout due to use of draw-bead, will cause an increase of 5 tons of sheet metal required for the production of 100000 automotive parts. Another important reason is anisotropic properties of the blank material. Due to anisotropy, the sheet metal can exhibit directional properties. In order to eliminate the defects caused by the directionality of material properties, for instance formation of earing, larger blank layout can be used. Consequently, because of the reasons stated here, it is not realistic to produce a product with 100% metal utiliza-tion. Hence, it is very important to design deep drawing tools which satisfy the combined requirements of productivity, part quality and high metal utilization. Figure 1.1 repre-sents an example of produced part with its blank layout.
Figure 1.1: Production steps of a body part.
Automotive manufacturers produce scrap not only during deep drawing process but also during the blanking stage of the blank layouts from the stock strip. During the design process for blanking dies, decisions must be made about the orientation of the blank layout on the stock strip. Since only the optimum orientation can reduce wastage of the sheet material. A detailed discussion of this subject is not in the scope of this thesis and can be found in the literature. Nye (2000).
1.1 Motivation and Objective of the Thesis
The primary motivation behind this thesis is to decrease the amount of scrap metal which is produced by the use of drawbeads in deep drawing processes. Thus, the metal utiliza-tion of the process will be increased.
This motivation can be achieved by generating the same amount of drawbead restraining force with the conventional drawbeads from a smaller drawbead geometry. Therefore, the objective of the presented thesis is to design improved drawbead geometries which generate higher restraining forces from smaller drawbead geometries and locate these improved geometries at the smallest distance from the punch opening line.
1.2 Outline of the Thesis
This thesis is split into six main chapters as shown below.
Chapter 1. Introduction
This chapter gives an introduction and a general outline for the motivation behind this thesis.
Chapter 2. Theory
This chapter gives a background about the formability of sheet metals and the deep drawing process. The importance of the Forming Limit Diagrams and the influence of the anisotropy of the materials are given. Moreover, the possible failure modes of the deep drawing operations are investigated in this chapter of the thesis.
Chapter 3. Basics of Drawbeads
In this chapter, firstly a detailed information about the drawbeads is given and the guidelines in drawbead design are presented. Then, analytical drawbead mod-els are described. After that, the parameters which have influence on the perfor-mance of drawbeads are discussed. Finally, special drawbead concepts that are found in the literature are presented.
Chapter 4. Finite Element Simulations of Drawbeads
This chapter covers general information about the simulation of drawbeads. The chapter begins with an overview about the importance of the finite element sim-ulations for forming operations. Next, a brief information about the finite element codes, their solution procedures and the types of elements used in simulations are given. At the end of the chapter, the finite element models of drawbeads are de-scribed and their advantages and disadvantages are discussed.
Chapter 5. Numerical and Experimental Results
This chapter is devoted to present the results of the finite element simulations and the experiments. Firstly, the finite element codes used in the simulations are de-scribed and their basic features are given. Then, these finite element codes are
used to investigate the influence of some parameters on drawbeads. After that, the improved drawbead geometries are designed and their design considerations are stated. Simulative analysis of the improved drawbeads and experimental ver-ification of the simulations are done. Finally, a comparison and a discussion be-tween the results of the simulations and the results of the experiments are done.
Chapter 6. Conclusion
2 Theory
2.1 Formability of Sheet Metals
In sheet metal forming processes, the blank is subjected to large plastic deformations. An important concern in sheet metal forming is whether the desired deformation can be achieved without failure of the sheet blank. The ability of the metal to be plastically formed under specified conditions into a desired shape without fracture or necking is called formability. The formability of materials is influenced by all factors participating in the forming process, namely sheet metal properties, process parameters and strain bounding criteria. Even if one of these factors cannot be controlled properly, a failure can happen during the forming operation.
Fracture usually follows a necking. Therefore, critical levels of deformation, so-called sheet forming limits, can be characterized by both the diffuse necking and the local necking states. Diffuse necking occurs when uniform deformation stops, as the material reaches its maximum strength. The local necking occurs after diffuse necking and during local necking the specimen thins without further width contraction. Kilfoil (2007). Fig-ure 2.1 illustrates diffuse necking and local necking.
Figure 2.1: Necking of sheet specimens under uniaxial tension: Figure 2.1 (a): Diffuse necking, Figure 2.1 (b): localized necking (Grote & Antonsson, 2009).
There are various methods developed for evaluating the formability of sheet metals. These methods can be subdivided into four main classes: simulating tests, mechanical tests, finding limiting dome height and drawing forming limit diagrams. In this thesis some information about forming limit diagram is presented. However, more detailed
information about forming limit diagram and other methods can be found in the litera-ture. Tekkaya et al. (2000).
2.1.1 Anisotropy
Due to their crystallographic structure and the characteristic of the rolling process, sheet metals generally exhibit a significant anisotropy of mechanical properties. The variation of their plastic behavior with direction is assessed by a quantity called Lankford param-eter or anisotropy coefficient. This coefficient is usually obtained by uniaxial tensile tests on strip shaped sheet specimens. The anisotropy coefficient r is defined by:
r =φw
φt (2.1) where φw and φt denote the true strain in width and thickness direction, respectively. If the anisotropy coefficient is equal to one, the metal flows equally within the width and thickness. If the coefficient is greater than one, the metal flows mainly within its width. On the other hand, for the metal having a coefficient less than one, the metal flows mainly within its thickness. For most metals the value of r changes with the longitudinal strain, and by convention a longitudinal elongation of 20% is used for comparison. Tek-kaya et al. (2000).
The anisotropy coefficient changes with the orientation of the specimen with respect to the rolling direction. This variation is determined by three r-values obtained from spec-imens in rolling (0o), diagonal (45o) and transverse (90o) directions. The average of r-values obtained from different directions in the plane of the sheet metal represents the coefficient of normal anisotropy rn. The coefficient of normal anisotropy is determined by:
rn =r0o + 2r45o + r90o
4 (2.2) where r0, r45 and r90 are the anisotropy coefficients in the rolling direction, diagonal di-rection and transverse didi-rection respectively. A material with a high normal anisotropy coefficient will experience less thinning during a deep drawing operation than a material having a smaller normal anisotropy coefficient, provided that their flow characteristics
are identical. Generally, the higher the normal anisotropy coefficient the deeper the draw that can be achieved.
A measure of the variation of normal anisotropy with the angle to the rolling direction is known as planar anisotropy.
∆r =r0o + r90o − 2r45o
2 (2.3) The planar anisotropy is directly related to the earing amplitude of the deep-drawn cups. As the magnitude of the Δr value increases, the earing height increase.
2.1.2 Forming Limit Diagrams
The forming limit diagram (FLD) (also known as the forming limit curve, FLC) is a very important concept utilized for the evaluation of the formability of sheet metals, which reflects the maximum principal strains that can be sustained by sheet materials prior to the onset of localized necking. It is basically a material property, so that every sheet metal has its own forming limit diagram. According to ISO standard 12004-1, the formability of sheet metal is represented by the forming limit curve.
The curve on an FLD represents a boundary between the safe and failed forming regions (Figure 2.2). The safe region is represented by the area below the curve where the ma-terial does not exhibit visible necking. The failed region refers to the area above the curve where the material has begun to form a visible (local) neck; hence, the material begins to lose its strength. Kilfoil (2007).
Figure 2.2: Forming limit diagram for plane stress (Tekkaya, 2012).
The limiting strains on an FLD can be either determined experimentally or predicted theoretically. Experimentally, an FLD is determined from a grid of circles that has been applied to the surface of the sheet sample prior to the forming operation. During forming the initial circles of the grid distort and become ellipses. From the minor and major axes of these ellipses, the principal strains on sheet specimens can be determined. The exper-imental procedures for determining the forming limit curve are given in the standard ISO 12004-2. Various theoretical models have been developed for the calculation of forming limit diagrams. The most commonly used models are presented in the literature. Tekkaya et al. (2000).
There are various tests to determine the FLD experimentally like the uniaxial tensile test, hydraulic bulge test, punch stretching test, Keeler test, Hecker test, Marciniak test, Nakazima test and Hasek test. From these, Marciniak test or hydraulic bulge test is uti-lized for eliminating friction effects; uniaxial test is preferred for its simplicity and Nakazima test is suitable since it is capable of covering a great variety of strain paths. Hasek test is used in order to prevent wrinkling of the specimens. Sönmez (2005). How-ever, it should be noted that results obtained using different methods cannot be used for comparison purposes.
2.2 Deep Drawing
Deep drawing is one of the most common processing techniques utilized in mass pro-duction. According to the definition in DIN standard, DIN 8584, the tensile compressive forming of a sheet blank (or depending on material, also of foils or plates) to a hollow body open on one side or the forming of a predrawn hollow shape into another with a smaller cross-section without an intentional change in sheet thickness. High strength, lightweight and cost-effective parts can be produced by deep drawing process. Some of the advantages of the process are as follows: i) rapid press cycle times, ii) fewer opera-tions required to finish a part, iii) the ability to create complex geometries unattainable through other processes.
The process involves three main tools, namely: draw punch, blankholder and female die. The basic tools of the process and the schematic representations of stages are shown in Figure 2.3. In the first stage, the blank is pressed down by the blankholder over the die, which has a cavity in the external shape of the part. Then, punch moves downward into the blank and draws or stretches the material into the die cavity. Finally, the punch is removed out of the die and returned to its original position. In industry, after the last step the part usually undergoes other mechanical processes, namely trimming. In the trimming process, the excess metal that is necessary to draw the part is cut away from the finished part. Simões (2012). The shape of the final product is determined by the geometry of the punch and forming die. It can be any geometry varying from a simple axisymmetric cup to a very complex auto body panel. Therefore, different tools are re-quired for different products.
Figure 2.3: Deep drawing operation and its basic tools (N. N., 2013c).
During deep drawing operation, the parts of the blank under the blankholder are sub-jected to a radial tensile stress and a tangential compressive stress. As it can be seen from the Figure 2.4, there are compressive forces in the flange region and tensile forces elsewhere in the workpiece. As a result, upon drawing, the blank thickens at the flange region. However, there is thinning at the bottom and at the wall.
Figure 2.4: Schematic diagram of the state of stress during deep drawing. Grey elements indicate elements before deformation, colorful elements indicate elements after defor-mation (Kalpakjian & Schmid, 2007).
In deep drawing operations, formability is expressed by a limiting drawing ratio (LDR). The limiting drawing ratio is the ratio between the initial diameter of the blank and the final diameter of the cup which can be formed without failure. Failure occurs by thinning
of the cup wall. The ideal limiting drawing ratio calculated by membrane theory is 2.72. In reality, the LDR is 1.8 to 2.0 for aluminum sheets and 1.9 to 2.2 for steel sheets. The reason for this is various process parameters are not considered in the simplifying mem-brane theory. One of the parameter is the dimension of the blank or equivalently the punch. As the relative punch diameter increases the limiting drawing ratio decreases. Furthermore, as the normal anisotropy increases the LDR increases; however, as the planar anisotropy increases the LDR decreases. Similarly, as the hardening exponent increases the LDR increases, but as friction between the blank and the die increases, the LDR decreases. Tekkaya (2012), Grote & Antonsson (2012).
2.2.1 Failure Modes
An incorrect design of the deep drawing tools and the blank layout or an incorrect choice of process parameters and blank material can yield a product with failures. Some of the most common failure modes are tearing, necking, wrinkling, earing, Lüder’s strips and orange skin, see the Figure 2.5.
Figure 2.5: Various failure modes in Deep Drawing: 1-Flange wrinkling; 2-Wall wrin-kling; 3-Part wrinwrin-kling; 4-Ring prints; 5-Traces; 6-Orange skin; 7-Lüder’s strips; 8-Bot-tom fracture; 9-Corner fracture; 10,11-Folding; 12-Earing; 13,14-Corner folding (Grote & Antonsson, 2009).
Tearing and necking are tensile instability caused by strain localization. The strength of the part is reduced and the appearance worsened because of tearing and necking. An-other failure is wrinkling, caused by compressive stresses unlike to tearing and necking. The other one is earing. Earing requires some metal to be trimmed from the top of the cup. The main reason for earing is planar plastic anisotropy. Also the last defect types
which poorly affect the appearance of the sheet metal part are ring prints, traces, orange skin and Lüder’s strips. Yalçın (2010).
Wrinkling occurs in the flange region and it is a common mode of failure in sheet metal forming. In the flange region, plastic buckling occurs when the compressive stresses there exceeds a certain value. This plastic buckling is the reason of formation of the wavy shaped wrinkling. Wrinkling is an undesired deformation and it must be pre-vented. There are two main methods used in order to prevent wrinkling. The first one is using blankholder. The clearance between the blankholder and the die can be adjusted by adjusting the blankholder force (BHF). Prevention of wrinkling can be achieved by adjusting the blankholder force. However, the amount of blankholder force is very im-portant, because high BHF leads to fracture and low BHF leads to wrinkling in the flange region or in the wall of the part. The other method for prevention of wrinkling is using drawbeads. A drawbead is an insert or rib-like projection on the blankholder surfaces that aids to control material flow during the deep drawing operation. When material moves though the groove, compressive stresses decrease because of the tensile forces acting. So wrinkling is prevented by reducing the compressive stresses below the critical value.
Another troublesome defect is the failure to maintain dimensional tolerances because of springback. Springback is the elastic recovery of formed part in unloading and it is the most important factor in deviation of final product from desired geometry. It is very important to predict and/or compensate the springback in the sheet metal forming oper-ations.
3 Basics of Drawbeads
3.1 Introduction
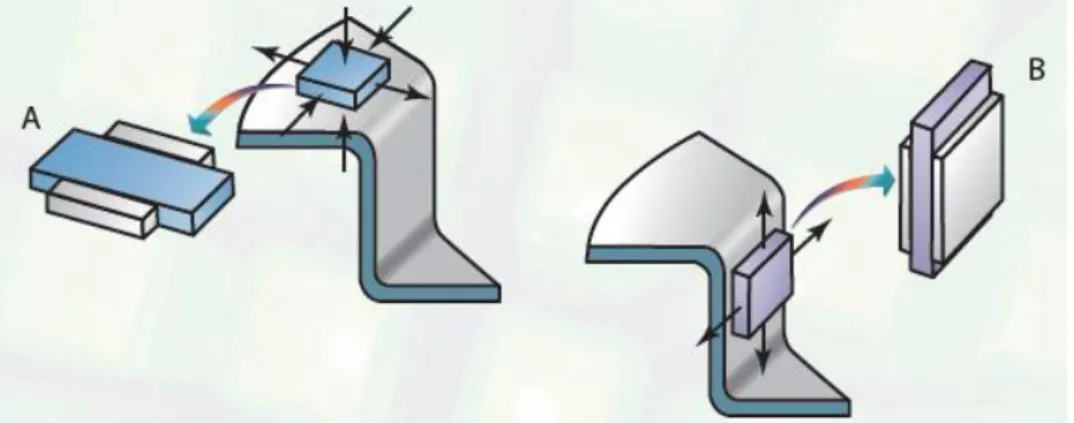
In sheet metal forming, the rate of material flow into die cavity must be controlled in order to obtain better quality and defect free products. Generally, the material flow is controlled by the blankholder: a restraining force is created by friction between the tools and the blank. However, the material flow during the drawing of irregular complex parts can hardly be controlled by the blankholder. When a high restraining force is required, higher blankholder pressure must be applied to increase the frictional resisting force, which may cause excessive wear in the tooling and galling in the sheet blank. In some cases, the minimum blankholder force required to provide the necessary restraining force for a successful drawing operation may exceed the tonnage capacity of the press. Therefore, in the forming of irregular complex parts, a local mechanism is desired which restrains the material flow sufficiently at relatively low blankholder force. These de-mands can be fulfilled by drawbeads. Meinders (2000).
The drawbead consists of a small groove on the die surface/blankholder surface matched by protrusion on the blankholder surface/die surface as shown in Figure 3.1. Murali et
al. (2010). Due to this “artificial” barrier, drawbeads assure that the material flows in a
more uniform way, especially in deep drawing irregular complex parts. Drawbead action occurs in two stages. In the first stage, the blankholder closes, and a protrusion on one blankholder face pushes the sheet metal into a machining groove on the other blank-holder face to form a bead. The depth of movement of protrusion into the sheet surface determines the amount of bead penetration. In the second stage, the sheet metal is pulled through the drawbead and into the die cavity. Demeri (1993).
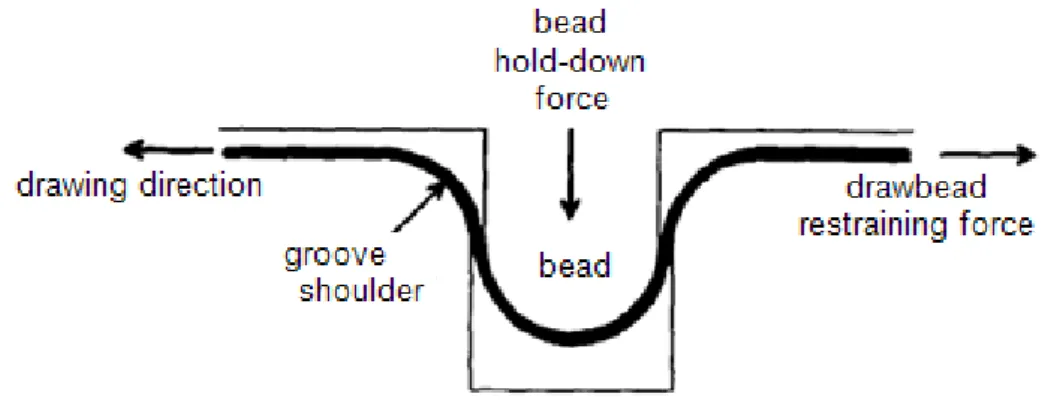
Figure 3.1: Deep drawing process including drawbead (Hosford & Caddell, 2011). Drawbeads generate two kinds of forces, namely, drawbead restraining force (DBRF) and bead hold-down force (BHDF). The forces generated by a drawbead are shown in Figure 3.2. These forces are related to the drawbead geometry (shape and dimension), sheet material (thickness and mechanical properties) and process parameters.
Figure 3.2: Drawbead forces (Çiçek, 2005).
The drawbead restraining force (pulling force) is the tension force required to pull the sheet through a drawbead. It is caused by deformation resulting from bending, unbend-ing (straightenunbend-ing) and reverse bendunbend-ing of the sheet metal in the drawbead area and by the frictional forces resulting from the sliding contact between the binder and the sheet metal. The direction of the DBRF is opposite to the material flow with the restriction that it acts perpendicular to the drawbead.
The bead hold-down force represents the force applied by the blank on the blankholder when the blank slides in the drawbead. The direction of the BHDF is opposite to the blankholder force direction. It causes a rise of the entire blankholder from which it can
be concluded that the BHDF is not a local phenomenon but will affect the total deep drawing process. Therefore, the bead hold-down force is subtracted from the total blank-holder force during the deep drawing simulations. Çiçek (2005).
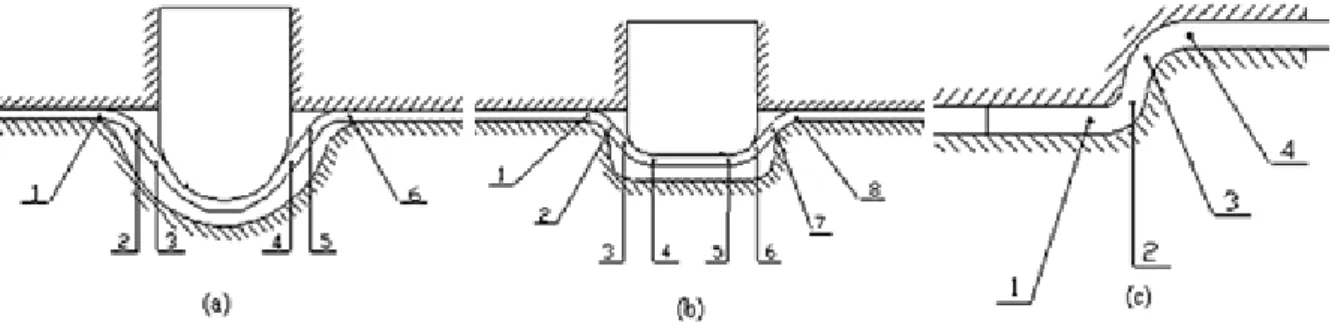
Figure 3.3 shows the development of deformation and friction as a sheet metal passes through an idealized circular drawbead. At point A, a deformation force is generated and the sheet undergoes bending deformation. As the sheet slides to position B, an ad-ditional force is generated to overcome the friction between the drawbead shoulder and the sheet. Also, the plastic deformation during bending causes the material to work harden. In the arc of AB, the sheet metal is strained in tension at the top surface and compression at the bottom surface. At position B the sheet metal straightens (unbend) and slides at the radius of the shoulder. The force required to straighten the sheet is greater than the force at point A because of the prior work hardening. This sequence of bend, slide (friction) and unbend accounts for all the restraining force from the first groove shoulder. The same force generating sequence occurs in the arcs CD and EF. However, in the arc of CD, the top surface experiences compressive stress, and the bot-tom surface experiences tensile stress. The entire restraining force of the drawbead is due to the work done in the three bending and unbending sequences plus the friction force between the bead and the sheet. Samuel (2002). Moreover, during the sliding pro-cess through a drawbead, the sheet metal experiences some reduction in its thickness.
Drawbeads can be machined, welded, or inserted on the die surface or on the holder surface. The performance of a drawbead depends on drawbead geometry, blank-holder normal force, friction coefficient but also on drawbead position with respect to center of die cavity. The drawbead geometric shape can be basically classified into three: circular (or round), rectangular and edge (or step) bead. As it is explained above, when a circular bead is used, the total number of bending and unbending deformations over the grooves and the bead is six as in Fig. 3.4 (a). When a rectangular bead is used, the total number of bending and unbending deformations is eight as in Fig. 3.4 (b), and therefore, a higher restraining force is obtained. However in practice, since the radii of the corners of a rectangular bead are smaller than the radius of a circular bead, higher strains are produced during bending over the bead radius. This causes higher surface damage on the sheet and tool, and for a critical bead radius fracture may occur on the sheet metal. Moreover, the thickness reduction caused by rectangular drawbead is more compared to circular and edge drawbeads due to higher number of bending and unbend-ing. When an edge bead is used, the number of bending and unbending deformations is four as in Fig. 3.4 (c). Zhongqin & Gang (2000). The advantage of an edge bead is that it can be located at the edge of the die corner so the blank layout can be reduced and considerable sheet material may be saved. However, the clearance in this type is usually very small and the effective bead radius of the sheet equals the tool radius. Due to these facts, the maximum restraining force is generated for the given tool radius. In addition, a possibility of fatigue fracture of sheet metal at the die edge may also appear when the edge load is placed too close to the die shoulder. Samuel (2002).
Figure 3.4 a): circular drawbead, Figure 3.4 b): rectangular drawbead, Figure 3.4 c): edge drawbead (Zhongqin & Gang, 2000).
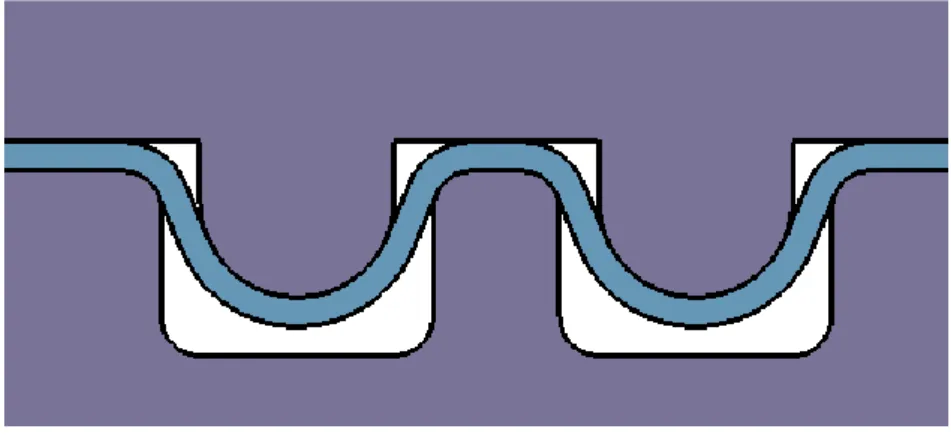
Generally, relatively higher drawbead restraining forces are required in the production of automobile outer panels. Also, some outer panel parts may require locally high re-straining forces. In such cases, the use of rectangular drawbeads may cause surface de-fects on the part. Therefore, combined drawbeads (see Figure 3.5) can be used in the production of these parts instead of rectangular drawbeads. Another advantage of com-bined drawbead is that it requires less blankholder force than a single drawbead that will give equivalent control. However, use of combined drawbead enlarges the required blank layout. Another type of drawbead is lock bead. Lock beads have rectangular ge-ometry and they are used to stop the material from flowing into the die cavity in order to stretch the part. Lock beads and edge beads should be used wherever possible in order to increase metal utilization.
Figure 3.5: Combined drawbead application, a double circular bead.
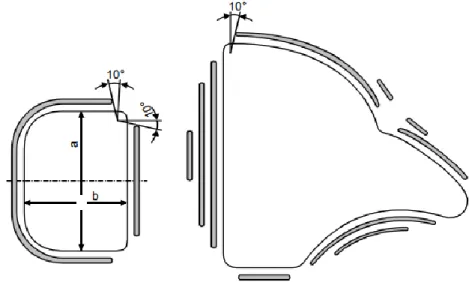
The location at which the drawbeads are placed is crucial to their effectiveness. To ob-tain the maximum effect from the drawbead it should be close to the area requiring re-straining and perpendicular to the direction of metal flow. If the drawbead is too far from the punch opening line, as in the case of dimension “x” as shown in Figure 3.6, then the drawbead is unable to supply sufficient restraining force to control the material during forming. Conversely, as in the case of dimension “y”, if the bead is too close to the trim line, material being drawn over the bead may become part of the finished prod-uct and create a surface defect. Therefore, a care should be taken to ensure that material pulled through the drawbead does not form of the final product in order to avoid appear-ance defects. Moreover, if the distappear-ance is too short, fatigue cracks may appear at the die edge. Çiçek (2005).
Figure 3.6: Position of drawbeads (N. N., 2003).
Drawbeads generally are not required in the corners of the blankholder or die. Draw-beads should not go beyond a distance of 10o from the center of the corner radius in order to avoid penetration into the zone of stress concentration and hence possible crack-ing. Lange (1985). Figure 3.7 illustrates the arrangement of drawbeads for automobile components.
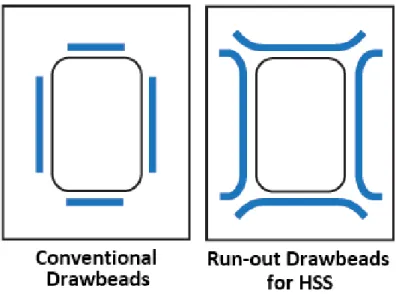
Figure 3.7: Arrangement of conventional drawbeads (Siegert, 1996 ).
However, drawbeads for high strength and advanced high strength steels (HSS and AHSS) should “run-out” at the tangent of the corner radius to minimize metal compres-sion in corners, as shown in Figure 3.8. The best location for a drawbead can be pre-dicted by the finite element analysis of metal flow.
Figure 3.8: Traditional drawbead layout and special run-out draw beads for higher strength steels (Keeler & Ulintz, 2013).
3.2 Analytical Drawbead Models
In deep drawing operations of irregular complex parts, the flow of material is generally controlled by the drawbead restraining forces. The drawbead restraining force depends on the drawbead geometry, the material used and the process parameters. In order to predict the appropriate drawbead geometry, the die designer must, first, determine the drawbead restraining force. Because a small variation of drawbead geometry can largely affect the amount of drawbead restraining force, and therefore the success or failure of sheet metal forming process. For this purpose, analytical and numerical (finite element) models are applied to the analysis and design of drawbeads in deep drawing operations.
Analytical models can provide a general insight, whereas greater specificity is possible from the use of computer simulation models. Numerous methods are generated for the calculation of drawbead restraining force analytically. Most of them are built on the model proposed in the studies by Swift 1948 and Nine 1978. The calculation models for drawbead restraining forces primarily differ in which method they use and which factors are taken into account in calculating the force required for bending and unbending. The analytical models represented in the thesis are simple analytical model, Weidemann’s model, Kluge’s model and Stoughton’s model.
3.2.1 Simple Analytical Model
The simple analytical model can provide a useful insight to calculate the drawbead re-straining force caused by only bending and unbending. It is developed with the simpli-fying assumptions: work hardening, sheet thinning, material anisotropy, elastic defor-mation, movement of the neutral plane and the difference between engineering strain and true strain (𝜑 = 𝜀) are neglected.
According to Hosford and Caddell (2011), the bending force can be derived as follow. The strain is given by;
𝜀 = 𝑧
𝑟 (𝟑. 𝟏) where 𝑧 is the distance from the neutral plane. In this case the work per volume for an element at 𝑧 is 𝑘𝑓(𝑧/𝑟), where 𝑘𝑓 is the flow stress and 𝑟 is the radius of the bend at the
neutral axis. The work for all elements is given by: 𝑑𝑊 𝑑𝐿 = 2 ∫ (𝑘𝑓/𝑟)𝑧𝑑𝑧 𝑡/2 0 =𝑘𝑓𝑡 2 (4𝑟) (𝟑. 𝟐) The restraining force caused by bending three times and unbending three times as the sheet moves through the circular drawbead is then
𝐹𝑏 =6𝑑𝑊 𝑑𝐿 =
1.5𝑘𝑓𝑡2
𝑟 (𝟑. 𝟑) Hosford & Caddell (2011) states that, this calculation neglects the Bauschinger effect, which lowers the restraining force somewhat. Moreover, if the bend radii are not all the same, estimation of drawbead restraining force will be more complicated.
3.2.2 Weidemann’s Analytical Model
In 1978, Weidemann proposed an analytical drawbead model to calculate the drawbead restraining force as follow (Shuhui et al. 2001):
𝐷𝐵𝑅𝐹 = 𝑡𝑤 {2𝜇𝑃 𝑡 𝑒 4𝜇𝜃 +2𝑘𝑓 √3 [(( 𝑒𝜇𝜃 4(𝑅𝑔+12𝑡)+ 1 4(𝑅𝑔+12𝑡)+ 1 4(𝑅𝑏+12𝑡)) 𝑒 2𝜇𝜃 + 1 4(𝑅𝑔+12𝑡)+ 1 4(𝑅𝑔+12𝑡)) 𝑒 𝜇𝜃+ 1 4(𝑅𝑔+12𝑡)]}
(𝟑. 𝟒)
Where 𝑡 is the blank thickness, 𝑤 is the length of the drawbead, 𝜇 is the friction coeffi-cient, 𝑘𝑓 is the flow stress, 𝜃 is the bending angle of the blank, 𝑅𝑔 is the shoulder radius of the groove, 𝑅𝑏 is the bead radius, and 𝑃 is the equivalent blankholder force per unit length (refer to Figure 3.9).
Weidemann’s drawbead restraining force model is simple in form and gives better re-sults than the simple analytical model. In Weidemann’s model, the following assump-tions are made for the ease of analysis:
1. The work hardening of sheet is neglected.
2. The anisotropy of the material is neglected.
3. The elastic deformation of the sheet is neglected.
4. Thinning of the sheet after each bend and unbend is neglected.
5. The bending angle is undetermined.
6. For any bead penetration, the effective bending radius is assumed to be equal to bead or groove radius.
7. The blank is in the plane strain state.
8. The influence of the strain rate and the Bauschinger effect on the deformation process is neglected.
9. The material is assumed to be rigid-plastic.
Due to the assumptions mentioned above, the model results in an underestimation of the drawbead restraining force (DBRF). Moreover, the model predicts the DBRF but min-imum bead hold-down force necessary to prevent the lifting-up of the binder still needs to be determined.
Figure 3.9: The drawbead geometry used in Weidemann’s model (Shuhui et al. 2001). 3.2.3 Kluge’s Analytical Model
Due to the disadvantages caused by the assumptions in Weidemann’s analytical model, Kluge derived a drawbead restraining force model in 1992. He used similar approach to that used by Weidemann to derive the mathematical model. He introduced strain hard-ening into the model by calculating the average flow stress during each bending and unbending deformation. Thus, underestimation of DBRF caused by neglecting strain hardening is eliminated. Kluge’s formula to calculate the drawbead restraining force is given below (Çiçek, 2005):
𝐷𝐵𝑅𝐹 = {[(𝜇𝐹𝑁 + 𝑘𝑓1𝑡 2𝑤 4 (𝑅𝑔+12 𝑡)) 𝑒 𝜇𝜃 + 𝑘𝑓2𝑡2𝑤 4 (𝑅𝑔+12 𝑡)+ 𝑘𝑓3𝑡2𝑤 4 (𝑅𝑏+12 𝑡)] 𝑒 2𝜇𝜃 + 𝑘𝑓4𝑡2𝑤 4 (𝑅𝑏 +12 𝑡)+ 𝑘𝑓5𝑡2𝑤 4 (𝑅𝑔 +12 𝑡)} 𝑒 𝜇𝜃 + 𝑘𝑓6𝑡2𝑤 4 (𝑅𝑔+12 𝑡)+ 𝜇𝐹𝑁 (𝟑. 𝟓) where 𝑡 is the initial sheet thickness, 𝑤 is the length of the drawbead, 𝜇 is the friction coefficient, 𝑘𝑓1−6 are the flow stresses at points 1-6 (as in Figure 3.4 a)), 𝜃 is the bending angle of the blank, 𝑅𝑔 is the shoulder radius of the groove, 𝑅𝑏 is the bead radius, and 𝐹𝑁 is the effective blankholder force.
The materials anisotropy, the elastic force originating from the sheet and the thinning of the sheet are neglected in this model as well. However, the most important shortcoming
of the model is the over-valuation of the bending strain due to the assumption that the effective bending radius is equal to that of the bead or the groove in the case of shallow bead penetration. Moreover, the model cannot predict the minimum bead hold-down force as well.
In 1999, Zhongqin et al. improved Kluge’s model by taking into account the effective bending radius and the materials anisotropy. In the model, the effective bending radius is used instead of bead or grove radius, therefore overestimation of the DBRF in the case of shallow bead penetration is eliminated.
3.2.4 Stoughton’s Analytical Model
A frequently used and more sophisticated analytical model to determine the DBRF is proposed by Stoughton in 1988. The Stoughton model is based on the virtual work prin-ciple. In this model, the forces are derived by equating the work required to pull the sheet through the drawbead to the work required to bend and straighten the sheet and overcome the frictional forces in sliding over the bead radii. Meinders (2000). The vir-tual plastic work due to the bending and unbending gives the restraining force 𝐹𝑖 (per
unit of length) at each point of radius change (see Figure 3.4 a)) is given below:
𝐹𝑖 = ∫ (∫ (𝜎. 𝑑𝜀) 𝜀𝑖+ 𝜀𝑖− ) +𝑡𝑖⁄2 −𝑡𝑖⁄2 (𝟑. 𝟔) where 𝑡𝑖 is the sheet thickness at the inflection point 𝑖 , 𝜀𝑖+and 𝜀𝑖−represents the tangential
strains before and after inflection point 𝑖 through the sheet section and 𝜎 is the flow stress of the sheet metal along the bead axis.
Deformed geometry of the sheet metal estimated based on the relative position of the bead with respect to groove geometry, thus able to account for effect of clearance and partial bead penetration on the drawbead force. The material is assumed to obey the Holomon hardening law which incorporates strain rate sensitivity. This hardening law degenerates to the Ludwik-Nadai hardening law when strain rate effects are neglected. The drawbead restraining force in the Stoughton analytical model depends on the fol-lowing parameters (Meinders, 2000);
The analytical formulation of the DBRF is given by equation:
𝐷𝐵𝑅𝐹 = ((𝐹1𝑒𝜇𝜃 + 𝜇𝐹
𝑒 + 𝐹2+ 𝐹3)𝑒2𝜇𝜃 + 𝜇𝐹𝑒 + 𝐹4+ 𝐹5) 𝑒𝜇𝜃+𝐹6 (𝟑. 𝟖)
where 𝜇 is the friction coefficient, 𝑤 is the length of the drawbead, 𝜃 is the angle of contact between the sheet and the contra-bead radius, 𝐾 is the material strength, 𝑛 is the strain hardening exponent, 𝑚 is the strain rate exponent, 𝑅𝑒𝑓𝑓 is the effective bend radius, 𝑟 is the normal anisotropy coefficient, 𝐸 is the modulus of elasticity, 𝜀̇ is the strain rate, 𝐹𝑒 is the elastic normal force and 𝐹𝑖 is the restraining force at each point. The strain hardening, the anisotropy and the elastic deformation of the sheet material are taken into account by Stoughton’s mathematical model. Also, the thinning of the sheet after each bend and unbend is taken into account. Moreover, the bead hold-down force can be calculated. The bead hold-down force (BHDF) is the summation of all the vertical components of the bending and unbending forces at the bead radii.
Although Stoughton’s mathematical model shows reasonable prediction capability for the DBRF, it still has some limitations. The model used simplified constitutive laws such as symmetrical properties on the tension and compression and normal anisotropic yield condition to obtain analytical forms of solutions for the DBRF. Also, the material is assumed to be work-hardened to a strain proportional to the average strain through the thickness in the simplified analytical model. (Keum et al. 2008). Moreover, in the model, friction in the bending and sliding was accounted using coil friction formula. However, friction in straight sides is not accounted. In 1993, Tüfekçi et al. added the frictional force due to the applied blankholder force in the straight sides to the total drawbead restraining force that was not accounted by Stoughton. Ajay (2008).
In 1993, Tüfekçi et al. compared the analytical results predicted by Kluge, Stoughton, and Weidemann models and they concluded that Stoughton’s model showed the best correlation with experimental data.
All of the models explained above neglects the Bauschinger effect during the cyclic bending and unbending process. However, when the material elements undergo non-monotonous deformations, the simple hardening law might not be so effective, even
though deformations are approximately proportional. During the reverse loading, mate-rial elements usually demonstrate the Bauschinger effect. Therefore, in 1998 You pro-posed a numerical model for the calculation of the DBRF that considers the kinematic hardening rule and Bauschinger effect.
In 2000, Keum and Ghoo formulated expert drawbead models which embody the draw-ing characteristics of the drawbead suitable for finite element analyses of sheet metal forming processes. The analytical models of basic drawbeads such as circular draw-beads, stepped drawbeads and squared drawbeads are proposed. The analytical model is derived using bending theory and the belt-pulley equation. For the analytical models of combined drawbeads such as double-circular drawbeads, double-stepped drawbeads, circular-and-stepped drawbead, etc., those for the basic drawbeads are combined. They concluded that results of the expert models agree well with the experimental measure-ments. More recently Fırat (2007) proposed an analytical drawbead model based on Stroughton’s virtual plastic work principle. In the analytical model, the steady state de-formation of the sheet metal is prescribed by the geometry of the drawbead element, and the deformation part of the restraint force is computed with the bending theory. Also, the analytical model is employed in the calculation of the bead exit thickness of the sheet material. He concluded that during the prediction of sheet thickness, the model gives good correlations with the experiments till a moderate penetration range. However, the model provides poorer results for higher penetration levels. For the DBRF, the analytical model without the friction produced remarkably good correlation with the experiments, when compared with the case involving the friction, but the DBRF predictions are higher than the experimental values.
3.3 Effects of Parameters on Drawbeads
Without extensive knowledge of the influences of all control variables on drawbeads, it is hardly possible to design a drawbead geometry adequately to produce a product with the desired shape and performance.
As the above analytical models indicate, geometric variables, process variables and ma-terial variables play a very important role on the performance of drawbeads. This section
of the thesis investigates the effects of parameters on drawbeads performance. These parameters can be classified into three categories:
1. Geometry parameters
2. Material parameters
3. Process parameters
3.3.1 Geometry Parameters
For a successful sheet deep drawing operation a required restraining force can be gen-erated by varying the bead radius 𝑅𝑔 and penetration of the draw bead 𝑑 as well as clearance 𝑔 groove width 𝑤𝑔, inlet 𝑅𝑔1and outlet 𝑅𝑔2 radii of the groove, as seen in Figure 3.10.
Figure 3.10: Geometrical parameters on a circular drawbead (Fırat et al. 2009).
The depth of movement of the protrusion into the sheet surface determines the amount of bead penetration. It is one of the dominant factors in determining both drawbead re-straining force and sheet thinning. Deeper the bead penetrates, bending and unbending to sharper radius (that is closer to bead radius) occurs. The metal will be subjected to sharper bending. Thus, bending/unbending part of the DBRF will be increased. Moreo-ver, increasing the penetration will increase the angle of wrap. As the angle of wrap increases, the force normal to the sheet increases, and therefore frictional part of the DBRF increases. (Demeri, 1993; Fırat et al. 2010; Trzepieciński, 2012).
Moreover, Taherizadeh et al (2009) states that the amount of springback decreases when the drawbead penetration depth increase. That is because, for deeper drawbead penetra-tions the restraining force is higher therefore, the sheet metal is stretched to a greater extent in the sidewall region after passing over the die shoulder. The higher tensile stresses help to decrease the residual stress gradient through the sheet thickness.
For a smaller radius of the drawbead, the sheet metal undergoes more bending defor-mation at the same penetration of the drawbead and needs greater power to deform. Also, for a smaller radius of groove shoulder, the sheet material in the drawbead region undergoes more bending deformation at the same penetration of the drawbead. There-fore, decreasing bead or groove radius increases the bending/unbending part of the DBRF linearly, or vice versa. When the drawbead radius increases the bending/unbend-ing deformations on the sheet metal decrease as it passes through the drawbead, which results in a decrease in the drawbead restraining force. Furthermore, the sharper radius cause higher contact pressure which preventing the sheet from slipping. Thus, friction part of the DBRF will be increased. (Yang et al. 2002).
The width of the groove and the clearance are directly related to each other. For high clearance the effective bending radius of the sheet is greater than the radius of bead or groove. Therefore, the drawbead restraining force is lower. For small clearance the ef-fective bending radius of the sheet equals the tool radius. Due to this fact, the sheet is forced to conform to the bead and groove radii contour, and a maximum restraining force is generated for a given bead and groove radii. Samuel (2002).
The deeper the penetration and sharper the bead and groove radius will increase the DBRF. However, higher strains will be produced during the bending over the groove and bead radii. This causes higher surface damage on the sheet. Furthermore, geomet-rical parameters which increase the DBRF will cause a decrease in the amount of spring-back.
3.3.2 Material Parameters
The parameters related to blank material are; thickness, flow stress, strain hardening exponent and sheet drawing direction with respect to rolling direction.
As it is explained before, work done in the bending and unbending sequences plus the friction force between the drawbead and the sheet are transformed into the drawbead restraining force. Increasing the sheet thickness and using a material with higher flow stress increases the required force for bending and unbending cycles. Furthermore, a material with higher strain hardening exponent will have higher restraining forces in-crement in every bending and unbending points.
The experimental results based on drawbead simulator (Fırat et al. 2010) indicate that the differences in the calculated restraining force values from different material direc-tions are insignificant when compared with changes due to the drawbead penetration. Although the coefficient of friction in 90𝑜 sample orientation is higher than the
coeffi-cient of friction in 0𝑜 sample orientation, the differences in the calculated drawbead restraining force values from different material directions are negligible.
3.3.3 Process parameters
Some of the process parameters that can affect the drawbead performance are as follows: i) drawing speed, ii) blankholder force, iii) friction characteristics.
The drawing speed is an important process parameter that can affect the frictional con-ditions. Increasing drawing speed decreases the coefficient of friction. Therefore, the higher the drawing speed, the lower the drawbead restraining force is.
Use of drawbeads generally reduces the amount of blankholder force required to draw irregular shaped parts. The direction of the bead hold-down force is opposite to the di-rection of blankholder force, causing a rise of the entire blankholder. Therefore, the blankholder force should be sufficient to ensure that the drawbeads are closed during the press stroke. Lower values of blankholder force contribute for a smaller drawbead penetration and reduce the drawbead restraining force. On the other hand, higher blank-holder force values can create additional frictional resistance on the flat portion of the sheet. It will result an increase of the drawbead restraining force. However, some surface defects can be generated due to high amount of blankholder force.
The friction characteristics affect not only the amount of restraining force, but also the quality of final product as well. Generally, increasing the friction increases the drawbead
restraining force. However, increasing the friction between the sheet and the drawbead can end up with drawbacks such as tool wear and surface defects. Due to the high num-ber of parameters that affect friction characteristics, the influence of friction on draw-bead performance is examined under a separate part.
3.3.4 Influence of Friction
Material flow in the die cavity is influenced by frictional conditions at the draw-bead/sheet metal interface. According to Altan and Tekkaya (2012), friction in deep drawing is influenced by such parameters as sheet metal properties (flow stress and sur-face finish), sheet metal coating, die material properties (sursur-face hardness and sursur-face finish), die material coating, temperature, drawing speed, lubricant, contact length and contact pressure.
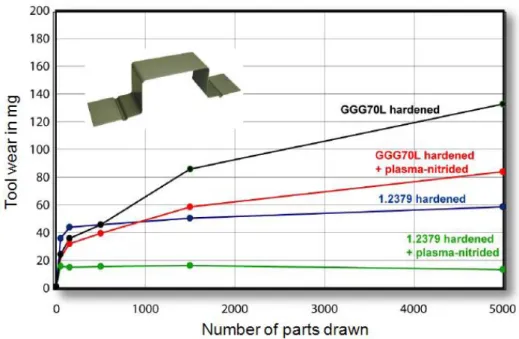
The coefficient of the friction has a great influence on the performance of drawbeads. A higher pulling force is required for a high value of friction coefficient at the same blank-holder force to travel the same stroke. However, improper friction condition can lead to failure in the tooling and/or in the sheet metal. The most common failure mechanism in deep drawing operations is galling (see Figure 3.11).
Figure 3.11: Galled die surface (Kim, 2008).
Galling is a form of adhesive wear that occurs due to material transfer from the sheet to the forming tool during metal forming operations. Galling is described in the American Society for Testing and Materials (ASTM) G40 Standard as "a form of surface damage
arising between sliding solids, distinguished by microscopic, usually localized, rough-ening and creation of protrusions (i.e., lumps) above the original surface; it often in-cludes plastic flow or material transfer or both". Figure 3.12 represents scale views of galling in deep drawing process. In the nanoscopic scale view, galling begins with the transportation of atoms from the atomic layer in sheet surface to the atomic layer in the tool surface. In macroscopic scale view, galling can lead to scratches or surface imper-fections on the formed part and reduction in lifetime of deep drawing tools. Kim (2008).
Figure 3.12: Macroscopic/Microscopic/Nanoscopic scale views of galling in deep drawing operations (Kim, 2008).
Galling is responsible for 70% of the rework (polishing) of automotive dies. Factors that affect galling include the followings: contact pressure, hardness, surface quality, coating and lubrication.
Contact Pressure: Galling is often concentrated at the draw radii or drawbeads
that encounter higher contact pressure compared to other flat surfaces. According to Lascoe (1988), of all galling problems observed, 40% are associated with drawbeads, 22% with die radii, and less than 10% with ironing. High contact pressures degrade the performance of the lubricant, tool coating and tool surface finish, thus it accelerates the initiation of galling as the number of part increases. Reducing the contact pressure is effective in reducing the risk of galling. Contact pressure can be reduced by increasing the contact area (using larger radii) or re-ducing load (using low strength and thin sheet metals). Although experimental