Empirical Economics (i993) 18:431-445
Is Money an Omitted Variable
in the Production Function?
Some Further Results
M. AYNUL HASAN 1
Associate Professor, Department of Economics, Acadia University, Wolfville, Nova Scotia, BOP 1X0, Canada,
SYED E MAHMUD
Associate Professor, Department of Economics, Bilkent University, Ankara, Turkey
Abstract: In recent years, numerous studies have emphasized the role of real balances in the production function in terms of money being useful: as an intermediate good; as liquid reserves for investment; and also serving as a link between aggregate supply and the nominal interest rate. In this paper we report new Canadian empirical evidence regarding the important role of money in the production process of aggregate manufacturing in- dustries based on a flexible translog cost function approach. In general, our results support the hypothesis that money is an important factor in the production function and that there are potential supply side effects of a change in the interest rate.
JEL Classification System-Number: E41
1 Introduction
Over the past two decades a n u m b e r o f papers have a p p e a r e d in the literature to examine the i m p o r t a n c e o f real balances in the p r o d u c t i o n function. T h e theoretical basis for i n c o r p o r a t i n g real balances in the p r o d u c t i o n f u n c t i o n is based o n the premise t h a t m o n e y is held n o t for its own sake b u t as an inter- mediate g o o d for the services it can provide. 2 F r i e d m a n (1969) has also We wish to thank L. Paquin, E. Ghysels, A. Abouchar, C. Christ, M. Khan and, in particular, an anonymous referee for detailed helpful comments. An earlier version of the paper was presented at the Annual meeting of the Canadian Economics Association, Windsor, Ontario, 1988. A part of the paper was revised while the first author was visiting the Johns Hopkins University - he would like to thank the members of the Department of Economics for their hospitality. This project was fnnded by the Harvey T. Reid Summer Fellowship and the SSHRCC General Grant at Acadia University.
2 Indeed money is also held for a variety of other reasons e.g., transaction demand, strategic liquid reserve for investment, speculative money to build up financial assets. (This was pointed out by the referee.)
argued that money should be treated as a productive input analogous to capital or labour in explaining the behaviour of the firm. On the other hand, Harkness (1984) and Jansen (1985) argued that real balances provide a link between real output and the nominal interest rate on the aggregate supply side of the economy. 3 In the literature, however, not much has been explored regarding the macroeconomic supply-side effects of the real money balances via the production function approach. In a similar context, Dennis and Smith (1978) have argued that motives for holding money balances by individual households may be quite different from that of the firms and, therefore, the use of a single equation to represent the demand for money for both these groups in the macroeconomic models would be "too much of a compromise of economic theory".
In the context of the Canadian economy, there are some studies that have investigated empirically the role of real money balances in the aggregate pro- duction function [e.g., You (198i), Sephton (1986) and others]. These studies seem to provide strong evidence for the hypothesis that real money balances do belong in the aggregate production function. The purpose of this paper is to report some new empirical evidence on the role of real balances as a pro- ductive factor for the aggregate Canadian manufacturing industries over the period 1 9 6 5 - 8 7 using a more flexible translog cost function approach. We use Zellner's seemingly unrelated estimation technique to estimate the cost and the factor share equations (capital, non-production worker, production labour and real money balances). Our results, in general, confirm that the real money balance is an important determinant in the production technology of the Canadian aggregate manufacturing industries.
Section 2 explains the derivation of the translog cost function, the asso- ciated factor share equations and various elasticities. Section 3 reports the regression results and elasticity estimates while Section 4 presents a summary and concluding remarks. Appendix A provides the definition and derivation of user cost of capital relevant to the Canadian manufacturing sector. Appen- dix B, on the other hand, presents the discussion on the estimation procedure.
3 Jansen (I985), referring to Lucas and Rapping (1969), argued that the presence of real balance in the aggregate supply function captures the effect of wealth on supply, if there is a statistical justification for the above argument, then, through the real balance, interest rate will appear in the demand function for labour. Consequently, a change in the interest rate may not only have an impact on the aggregate demand side (via money demand func- tion) but now it may also have an influence on the aggregate supply (via labour demand).
Is Money an Omitted Variable in the Production Function? 433
2 A Translog Cost Minimization Modal
In order to empirically estimate the underlying factor demand function for real balances and other inputs of a firm, one can follow either the production function or the associated cost function approach. The application of duality theory to this optimization problem stipulates that, under some regularity conditions [e.g., see Caves and Christensen (1980)], there is a unique cor- respondence between the production function and the cost function. Further- more, all the information about the underlying technology is also contained in each of these functions [Shepard (1970)1.
Suppose a firm uses inputs capital (Xk), production worker (X,), non- production worker (X~) and real money balances (Xm) to produce output Q. The production function can then be written as
Q = F(Xk, Xs, Xu,Xm) 9
(1)
Assuming that Equation (1) is concave, twice differential and that firm minimizes cost, then there exists a cost function that is dual to Equation (1) and relates cost to the output level and factor prices:
c = O(Q, Pk,
(2)
where C is the total nominal cost, Q is the real output and Pis are the factor prices of capital, skilled labour, unskilled labour and real balances.
In this study, we employ the translog cost specification to estimate our em- pirical model. This specification can be viewed as a second-order logarithmic approximation to an arbitrary twice-differential production function [Christensen, Jorgenson and Lau (1973)]. A translog cost function (locally) imposes no a priori restrictions on the substitution possibilities among the factors of production. This is especially desirable in our study where we would like to allow the elasticities of substitution between money and other inputs to be able to assume any value. The translog cost function can be writ- ten as:
in (C) = a0 + aq In Q+ (1/2)
7qq
(ln Q)2 + ~ ai In Pii
+(1/2)
E
~, Yij (lnPi)'(lnPj)+ E 7qi (ln Q) (lnPi) ,i j i
(3)
i,j = k , s , u , m .In order to correspond to a firm's budget constraint, the above cost func- tion must be homogeneous o f degree one in factor prices. This imposes the following adding up restrictions on the cost function:
2a =1;
2 qi=o; 2y j=Ey j=2
2 i;=o.
(4)
i i i j i j
In addition to the adding up restrictions, symmetry on the ?qj matrix is also imposed. The factor demand equations are derived by partially differen- tiating the cost function with respect to the factor prices and applying Shephard's lemma: OC/OP~ = Xi; where i = k, s, u, m. This result may be con- veniently expressed in logarithmic form in the case of the translog function: 0 In C/O In Pi = OC/OPi" P / C = Xi" P / C = S~ ;
(5)
where S; indicates the cost share of the ith factor input. The translog cost function represented by Equation (3) yields the following share equation."Si =- ai q- ~qi In Q + ~ Yij In Pi , where i,j = k , s , u, m .
(6)
i
The cost equation (3) and the four share equations (capital, two kinds of labourers and real money balances) of the form of Equation (6) constitute our model.
Factor Demand Elasticities
Uzawa (1962) has shown that Allen's partial elasticities of substitution for the translog cost function can be computed directly from the cost function equa- tion (3) by the formula.4
= c . G J G G , (7)
where subscripts indicate partial differentiation with respect to factor prices. For the translog cost function specified by Equation (3), Allen's substitution elasticities can be calculated as:
ark = (Yrk + SrSD/SrSk ,
(8)
art = {Yrr+Sr(Sr-
(9)The own price elasticities of factor demand (~,) can be obtained from
Is Money an Omitted Variable in the Production Function? 435
(rr : arrS , (lO)
and, similarly, the cross price elasticities of factor demand can be written as:
= ( 1 1 )
where ~ is interpreted as the percentage change in the demand for the r t h factor as a result of a one percent change in the price of factor k.
3 Data and Estimation Procedure
Data: We estimate the parameters of the cost function in Equation (3) for four factors, namely, capital, production labour, non-production worker and real
money balances using annual data on aggregate Canadian manufacturing in-
dustries over the period 1965-87.
The data on real output, Q, was derived by deflating current dollar gross
domestic product of the total manufacturing sector by its price index. 5 Two different kinds of labour inputs were considered, i.e., production and related workers (Xu) and administrative, office and other non-manufacturing employees (Xs) and they are measured as the total man-hours worked by the employee. Since Statistics Canada (STC) reports only the number of bodies for non-production workers, following Smith and Dennis (1978), we
multiplied the total number of bodies by 37.5 • to obtain annual hours
worked by the non-production employees. The wage rates (P, and Ps) have been derived by dividing total wages and salaries paid to each type of worker by their respective total man-hours.
The data for the real money balances (Xm) has been obtained from the
year-end balance sheet of the total manufacturing sector. Cash and marketable securities have been taken as the measure of nominal money balances. The data for real balances was subsequently derived by dividing nominal money by industry selling price index of the total manufacturing sec- tor. The price of holding one nominal dollar is measured by the interest rate (r). in our model, we assume that the services derived from the nominal
s We are aware of the fact that, under a perfectly competitive equilibrium (zero-profit con-
dition), the output price only covers the unit cost of production which, in the context of du- al, would amount to C = Q. This implies that the gross value of Q must include all costs including the cost of real balances. Since, in this study, we are not making a perfectly com- petitive market assumption (zero-profit condition), the equality of Q = C,. is, therefore, not a binding constraint for our analysis. (We are thankful to the referee for making this point.)
money to the firms are directly proportional to the levels of real stocks of money. The price of holding one real dollar (Pm) is the interest rate multi- plied by the price level. Thus, an increase in the price level will increase the price level of money services.
The data on real capital stock is measured as the mid-year real net capital stock times the capacity utilization rate of the total manufacturing sector. The price of capital stock (Pc) is the user cost of capital and its methodology has been adopted from Lodh (1984). In the construction of the user cost series, Lodh (1984) has employed a discount rate which is inflation free and is a weighted average of real industrial bond rate and real equity. It is important to note that in the construction of the user cost of capital Lodh (1984) has used the notion of adaptive expectations to form the expectations about the effective corporate tax rate and the inflation rate. However, in our empirical model which deals with production decisions of the firms, ignoring the finan- cial portfolio decisions of the firms, we assumed static expectations about all the factor prices and output cost. Given the definitions of all input factors and their respective prices, the total cost (C) is then simply the sum of the total nominal values of these factor inputs. (Appendix A outlines the con- struction of the user cost of capital.)
Estimation Procedures: The parameters of the tranlog cost function can be estimated in one of three ways. First, one can use ordinary least squares to estimate the cost function only. This technique is attractive from the point of view of simplicity. However, it neglects the additional information contained in the cost share equations [Christensen and Greene (1976)1. Secondly, we can estimate the set of share equations in a simultaneous equation framework, ex- cluding the cost equation. For instance, Berndt and Wood (1975) have esti- mated share equations as a multivariate regression system. Finally, Christensen and Greene (1976) have estimated the cost function together with the share equations. We follow this last approach to estimate the parameters of the cost and share equations. (See Appendix B for a discussion on the estimation procedure used in the study.)
4 Discussion of Results
The translog cost function and the three share equations (as presented in Ap- pendix B) for the aggregate Canadian manufacturing industries ~ were esti- 6 We have also estimated the cost and share equations and the corresponding different types of elasticities for the disaggregated 2 digit manufacturing industries. These results are available on request from the authors.
Is Money an Omitted Variable in the Production Function? 437
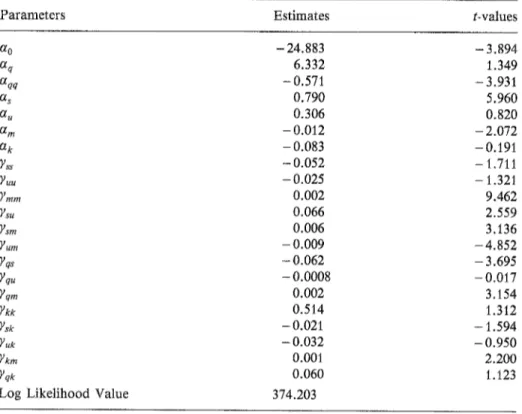
m a t e d using Z e l l n e r ' s seemingly unrelated a l g o r i t h m in the T S P c o m p u t e r p r o g r a m m e . F o u r versions o f t h e m o d e l were e s t i m a t e d b y d r o p p i n g o n e share e q u a t i o n each time. This enables us to check o n the invariance o f the e s t i m a t - ed p a r a m e t e r s w i t h respect to the share e q u a t i o n d r o p p e d . We did o b s e r v e this i n v a r i a n c e p r o p e r t y a n d in Table i, we, however, r e p o r t o n l y the p a r a m e t e r estimates o f the share e q u a t i o n s d r o p p i n g capital. In m o s t cases the e s t i m a t e d p a r a m e t e r s are significantly different f r o m zero at the ninety-five p e r c e n t level o f confidence.
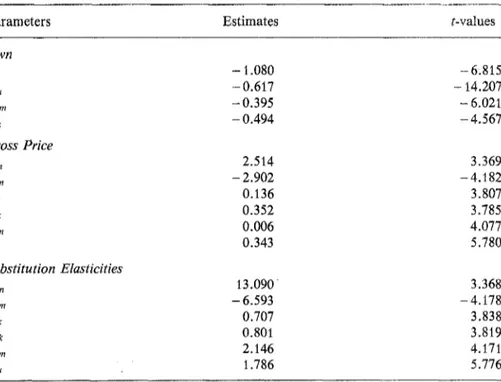
T h e e s t i m a t e d o w n , c r o s s a n d s u b s t i t u t i o n price elasticities are all signifi-
cant at t h e o n e p e r c e n t level a n d they are presented in Table 2. As expected,
the o w n price elasticities o f d e m a n d for the factors were negative. W i t h the
exception o f n o n - p r o d u c t i o n workers (Xs), the o w n price elasticities o f de-
m a n d f o r all o t h e r f a c t o r s including real b a l a n c e s seem to be fairly inelastic.
It is interesting to n o t e t h a t the o w n price elasticity o f real m o n e y b a l a n c e s
f o r the C a n a d i a n m a n u f a c t u r i n g industries is close to the estimates o f Dennis a n d S m i t h ' s (1978) s t u d y b a s e d o n t h e US m a n u f a c t u r i n g sector data. T h e i r estimates o f the price elasticity o f m o n e y r a n g e d b e t w e e n - 0 . 2 2 to - 0 . 4 0 .
Table 1. Translog parameter estimates of the share equations (dropping capital)
Parameters Estimates t-values
a0 - 24.883 - 3.894 aq 6.332 1.349 aqq -- 0.571 - 3.931 as 0.790 5.960 au 0.306 0.820 a m -- 0.012 - 2.072 ak -0.083 -0.191 Yss - 0.052 - 1.711 Yuu - 0.025 - 1.321 Ymm 0.002 9.462 Ys. 0.066 2.559 ~sm 0.006 3.136 ~'um -- 0.009 -- 4. 852 Yqs -- 0.062 -- 3.695 Yq. -- 0.0008 -- 0.017 ~qm 0.002 3.154 ~x 0.514 1.312 Yse - 0.021 - 1.594 Y.k - 0.032 - 0.950 ~km O. O01 2.200 Yqk 0.060 1.123
The signs o f the cross price elasticities o f capital with respect to (w#:t.) m o n e y (Gem) and non-production workers w.r.t, m o n e y (~sm) are positive whereas the elasticity for the production workers (~1) is negative. This in- dicates that capital a n d non-production workers are substitutes to m o n e y whereas production workers are complementary to money. Dennis and Smith (1978) have estimated these elasticities for the US m a n u f a c t u r i n g sector and they also f o u n d the price elasticity between production worker and m o n e y to be complements (in nine out o f eleven industries) whereas m o n e y a n d capital to be substitutes.
The elasticities o f substitution (aij) are calculated using E q u a t i o n (8) a n d they are also reported at the b o t t o m o f Table 2. These substitution elasticity values between capital and production workers (cr,k) and capital a n d non- production workers (as~) are b o t h less t h a n one indicating that the substitu-
tion possibilities are very limited a m o n g these factors o f production. On the other hand, the factors, production a n d non-production workers, seem quite substitutable with each other (e.g., a~u = 1.78). Furthermore, when these
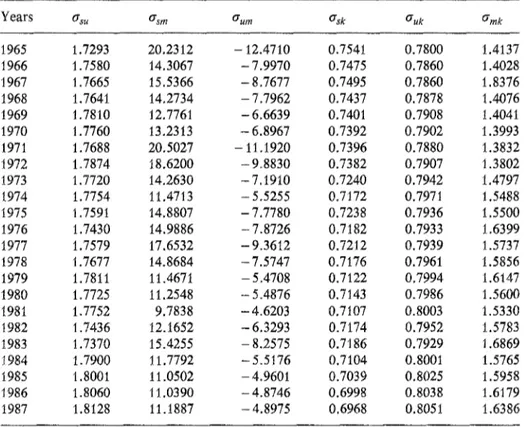
substitution elasticity figures were calculated for each year, as presented in Table 3, they were fairly stable during the entire sample period (1965-87).
Table 2. Factor price elasticities
Parameters Estimates t-values
Own ~,s - 1.080 - 6.815 ~uu - 0.617 - 14.207 ~mrn -- 0.395 - 6.021 ~ - 0.494 - 4.567 Cross Price ~sm 2.514 3.369 ~um - 2.902 - 4.182 ~sk 0.136 3.807 ~,k 0.352 3.785 ~km 0.006 4.077 ~s, 0.343 5.780 Substitution Elasticities asm 13.090 3.368 aum -- 6.593 - 4.178 ask 0.707 3.838 au~ 0.801 3.819 akm 2.146 4.171 as, ` 1.786 5.776
Is Money an Omitted Variable in the Production Function? 439
Table 3. Time series elasticities of substitution
Years as~ asm aum ask auk amg
1965 1.7293 20.2312 -12.4710 0.7541 0.7800 1.4137 1966 1 . 7 5 8 0 14.3067 -7.9970 0.7475 0.7860 1.4028 1967 1 . 7 6 6 5 15.5366 - 8.7677 0.7495 0.7860 1.8376 1968 1.7641 1 4 . 2 7 3 4 -7.7962 0.7437 0.7878 1.4076 1969 1 . 7 8 1 0 12.7761 -6.6639 0.7401 0.7908 1.4041 1970 1 . 7 7 6 0 13.2313 - 6.8967 0.7392 0.7902 1.3993 1971 1.7688 20.5027 -11.1920 0.7396 0.7880 1.3832 1972 1 . 7 8 7 4 1 8 . 6 2 0 0 -9.8830 0.7382 0.7907 1.3802 1973 1 . 7 7 2 0 1 4 . 2 6 3 0 -7.1910 0.7240 0.7942 1.4797 1974 1 . 7 7 5 4 11.4713 -5.5255 0.7172 0.7971 1.5488 1975 1.7591 14.8807 -7.7780 0.7238 0.7936 1,5500 1976 1 . 7 4 3 0 14.9886 -7.8726 0.7182 0.7933 1.6399 1977 1 . 7 5 7 9 1 7 . 6 5 3 2 -9.3612 0.7212 0.7939 1.5737 1978 1 . 7 6 7 7 14.8684 -7.5747 0.7176 0.7961 1.5856 1979 1.7811 11.4671 -5.4708 0.7122 0.7994 1.6147 1980 1 . 7 7 2 5 11.2548 - 5.4876 0.7143 0.7986 1.5600 1981 1.7752 9.7838 -4.6203 0.7107 0.8003 1.5330 1982 1 . 7 4 3 6 12.1652 -6.3293 0.7174 0.7952 1.5783 1983 1 . 7 3 7 0 15.4255 - 8.2575 0.7186 0.7929 1.6869 1984 1 . 7 9 0 0 11.7792 -5.5176 0.7104 0.8001 1.5765 1985 1.8001 11.0502 -4.9601 0.7039 0.8025 1.5958 1986 1 . 8 0 6 0 11.0390 - 4.8746 0.6998 0.8038 1.6179 1987 1 . 8 1 2 8 11.1887 -4.8975 0.6968 0.8051 1.6386
W i t h regard to real balances, it seems to be a substitute w.r.t, n o n - p r o d u c - tion workers (as a~m > 0) a n d a c o m p l e m e n t to p r o d u c t i o n workers (a,m < 0). This latter result provides some interesting evidence for the supply-side effects o f real balances. We m a y explain this in the following way. S u p p o s e t h a t the interest rates (the price o f m o n e y ) in the e c o n o m y increase due to a restrictive m o n e t a r y policy, resulting in a decreased d e m a n d for p r o d u c t i o n workers (as m o n e y is a c o m p l e m e n t to Xu). This, in turn, m a y shift the aggregate supply curve upward a n d to the left. A t the same time, due to higher interest rates it m a y suppress the private investment d e m a n d thereby shifting the aggregate d e m a n d curve d o w n w a r d to the left. Consequently, the e m p l o y m e n t a n d level o f o u t p u t m a y decrease even with higher prices. 7
7 This macroeconomic analysis based on our results should be viewed with caution as our estimates are based on a sectoral level (manufacturing) data and on a cost minimiza- tion approach where the level of output is assumed to be fixed. Thus, in order to draw more general macroeconomic conclusions, further research is needed in this area.
A n o t h e r interesting result based on the elasticity of substitution is the
relative high substitutability between real balances and capital (akin = 2.146).
This result seems fairly intuitive when m o n e y is considered to be a working capital.
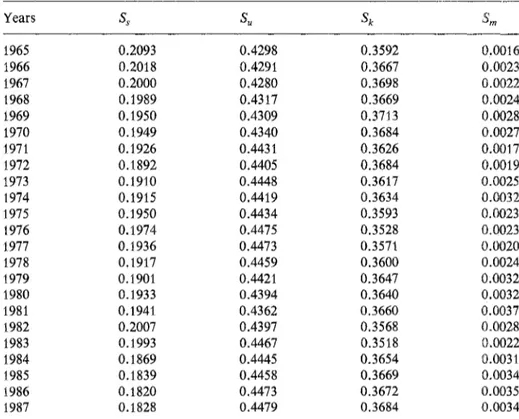
We have also calculated the cost shares o f all the factors for each year bas- ed on the estimated parameters o f the cost f u n c t i o n a n d they are r e p o r t e d in Table 4. T h e share o f money, t h o u g h small in the total cost o f the C a n a d i a n m a n u f a c t u r i n g sector, has, nevertheless, increased over the years. In fact, the share o f real balances has m o r e t h a n d o u b l e d f r o m the mid sixties to the late eighties o n a percentage p o i n t basis. T h e cost share o f capital, o n the other hand, did n o t change m u c h over the years.
T h e time series o f factor cost shares o f p r o d u c t i o n and n o n - p r o d u c t i o n workers reveal some interesting and crucial aspects o f the C a n a d i a n m a n u f a c - turing industries. T h e factor shares o f p r o d u c t i o n workers (unskilled) over the years have steadily increased while, during the same period, the workers o f the n o n - p r o d u c t i o n (skilled) sector experienced some decline in their factor shares in the total cost. O u r findings regarding cost shares o f labourers a n d
Table 4. Factor cost shares
Years S, S,, S k S m 1965 0.2093 0.4298 0.3592 0.0016 I966 0.2018 0.4291 0.3667 0.0023 1967 0.2000 0.4280 0.3698 0.0022 1968 0.1989 0.4317 0.3669 0.0024 1969 0.1950 0.4309 0.3713 0.0028 1970 0.1949 0.4340 0.3684 0.0027 1971 0.1926 0.4431 0.3626 0.0017 1972 0.1892 0.4405 0.3684 0.0019 i973 0.1910 0.4448 0.3617 0.0025 1974 0.1915 0.4419 0.3634 0.0032 1975 0.1950 0.4434 0.3593 0.0023 1976 0.1974 0.4475 0.3528 0:0023 1977 0.1936 0.4473 0.357l 0,0020 1978 0.1917 0.4459 0.3600 0.0024 1979 0.1901 0.4421 0.3647 0,0032 1980 0.1933 0.4394 0.3640 0.0032 1981 0.1941 0.4362 0.3660 0.0037 1982 0.2007 0.4397 0.3568 0.0028 1983 0.1993 0.4467 0.3518 0.0022 1984 0.1869 0.4445 0.3654 0.0031 1985 0.1839 0.4458 0.3669 0.0034 1986 0.1820 0.4473 0.3672 0.0035 1987 0.1828 0.4479 0.3684 0.0034
Is Money an Omitted Variable in the Production Function? 441
capital reinforce some of the similar observations made by researchers elsewhere. [e.g., See Daly and Globerman (1976), Britton and Gilmore (1978), May and Denny (1979), Danny and Fuss (1982), Helliwell (1984), Daly and Rao (1985)]. In this context Bryan (1986, pp. 105-6) writes:
Canadian manufacturing [industry] w dominated by slow-growing in- dustries which in some areas suffer substantial competition from the newer industrialized countries. Many industries are plagued by low pro- ductivity and high labour [production or un-skilled] c o s t s . . .
Another factor that contributes to low productivity is insufficient research and development expenditures [or capital] . . . . Technological advance- ment goes hand in hand with a technically trained labour force and some teehnical sophistieation on the part o f management, both o f which Cana- dian [manufacturing] industry appears to be lacking.
5 Conclusions
The purpose of this paper was to investigate whether or not real balances are important productive inputs of the aggregate Canadian manufacturing in- dustries. To this end, a four input (Xk, X~, X , , Xm) translog cost function was employed for estimating production parameters, demand and substitu- tion elasticities using annual Canadian data over the period 1965-87.
One of the important findings of our study is that the real cash balances are indeed important factors of production for the aggregate Canadian manufacturing sector. This, of course, does not mean that the real balances are like any other factors of production but rather they indirectly help and facilitate the process of production. Our own and cross-price elasticities estimates suggest that the demand for real balances, production worker and capital are fairly inelastic and that the production workers and money appear to be complements to each other. On the other hand, money seems to be a substitute for capital and non-production workers. Another interesting result that emerges from our study is the significance of the potential supply side effect of a change in the interest rate on both labour demand and supply of output.
Finally, although the primary focus of this study was to examine the im- portance of money in the production function, some of our findings on historical factor cost shares based on the estimated translog cost function, however, provide interesting evidence on the cost structure of production and
non-production workers. In particular, our resuks in this regard simply rein- force the assertion that one of the important reasons for the Canadian manufacturing industries to be non-competitive is the increasing cost shares of production workers over the period considered.
Appendix A
In this appendix we present the formulation of the user cost of capital (Pk) services as used by Lodh (1984) for the Canadian aggregate manufacturing sector. The equations defining the user cost are given below:
P~ = ( P I ) [ R + f i ) ( 1 - I T C ) ( I - r e Z ) ] / ( I - r ) , where
R = e e R E + ( 1 - e ) e R B
R B = I R ( I - z ) - Q e
The variables are defined as:
P I is the price of investment good,
R is the real discount rate,
r is the actual effective corporate tax rate, r e is the expected effective corporate tax rate,
c~ is the economic depreciation rate (based on the straight-line method ap- plied to a life span of the capital good),
is the investment tax credit rate,
I T C
;g is the discounted capital cost allowances per dollar of investment, 8 is the actual equity share in total capital,
e e is the expected equity share in total capital,
R E is the real equity cost of capital with inflation adjusted,
R B is the real industrial bond rate (after tax) with inflation adjusted,
I R is the industrial bond rate (McLeod, Young and Weir),
0 e is the expected inflation rate.
The above equations for the user cost of capital have been formulated from the standard Hall and Jorgenson type of model to suit the Canadian context given the data on appropriate variables. The cost of debt capital follows the Feldstein approach that adjusts for inflation expectation in the overall economy and the effective tax rate of the industry. Inflation expectations are, however, based on expected inflation rate of CPI rather than industry-specific inflation rate since the latter has been traditionally difficult to postulate on
Is Money an Omitted Variable in the Production Function? 443
theoretical grounds. The discounted capital cost allowance per dollar of in- vestment was calculated on the assumption that the following variables are known:
a) tax depreciation rate,
b) the expected life span of the capital good, and
c) the knowledge of the depreciation formula to be applied to a particular capital good purchased.
[For a detailed discussion on the appropriateness and shortcomings of dif- ferent variables in the equation, the reader should refer to Lodh (1984).]
Append~ B
In this appendix, we provide a brief discussion on the estimation procedure adopted in the study. Following conventional practice, we specify additive disturbances for the cost function (3) and each of the share equations in (4). We also assume that these disturbances have a joint normal distribution and allow for contemporaneous correlation across equations. Furthermore, the cost shares (by definition) in (4), and the right hand sides of these cost share equations must also add to unity. Hence, the errors in the share equations must add to zero for each observation. This implies that one of the share equations must be dropped as their covariance structure is not of full rank [e.g., Barten (1969)].
Following Zellner (1962), the system can be estimated using the seemingly unrelated regression technique, and the estimates so obtained are invariant to the choice of the equation to be dropped. It has been shown that a maximum likelihood estimate of the share equations guarantees such invariance. Dhrymes (1970) has shown that continuing iteration of Zellner's method, un- til the covariance matrix converges, yields the maximum likelihood estimates. This method is computationally equivalent to maximum likelihood and en- sures invariance of parameter estimates to the choice of the share equation dropped.
Since there are four cost share equations in our model, we used the prop- erty of the invariance to check our estimtes by using the linear homogeneity conditions in Equation (4). For example, solving the homogeneity conditions for the parameters of the capital equation (ak, Ykk, Yks, Yku, ~km,
~qk)
and substituting them into the cost function gives the following set of equations:In (C) = ao + aq In Q+(1/2)aqq (ln Q)2 + as In (PffPk)+ a~ In (PJPk) + a + In (Pk) + (1/2). Ys~lln (Ps/Pk)}2 + (1/2)" y ~ {In (Pu/Pk)}2 + (1/2)" ?mm{ln (Pm/Pk)} z + Ysu In (PJPk) In (P,/Pk)
+ ?sm In (Ps/Pk) in (P,,/Pg)+ Y~m In (P,/Px) In (Pm/Pk) + yq~ In Q In (PffPk)+ Yqu In Q In (Pu/Pk)
-t- )lqm In Q ' l n ( P m / P ~ ) + flc ;
Ss = [(PsXs)/(PsXs + P u X u + P m X m + P k X k ) }
= as + ass In (Ps/Pk) + Ysu In (Pu/Pk) + Ysm In (Pm/PK) + Yql in Q + ~ ; s~ = t(P~x~)/(p~xs + P~x~ + P ~ X m
+P~Xk)}
= a , + Ys, In (PffPk) + ?~ In (Pu/Pk) + ~)um in (Pm/Pk) + }'qu In Q + ]~u ;
Sm= [(PmXm)/(PsXs + PuXu +PmXm + PkXk)}
= arn + Ysm In (PJPk)+ Yum In (P,/Pk)+ Ymm In ( P m / P k ) + ?~qm 111 Q+flm ;
where/~r ttu and/tim are the additive disturbances in the cost, production labour share, non-production worker share and money share equations, respectively. There are six parameters which do not appear in the above equa- tions, namely, a~, Ykk, ~ , Yk~, ?Jkm and ~qk. However, these are linear com- binations of the consistent and asymptotically efficient estimates of other known parameters which are determined residually using the constraint im- posed on the share equations.
References
Barten A (1969) Maximum Likelihood Estimation of a Complete System of Demand Equations. European Economic Review 1:7-73
Berndt E, Christensen L (1973) The Internal Structure of Functional Relationships: Separability, Substitution, and Aggregation. Review of Economic Studies 40:403-410 Berndt E, Wood D (1975) Technology, Prices, and Derived Demand for Energy. Review of
Is Money an Omitted Variable in the Production Function? 445
Binswanger H (1974) A Cost Function Approach to the Measurement of Elasticities of Factor Demand and Elasticities of Substitution. American Journal of Agricultural Economics 56:377-386
Britton J, Gilmore N (1978) The Weakest Link, A Technological Perspective on Canadian Industrial Underdevelopment, Background Study No 43. Science Council of Canada, Ottawa: Supply and Services
Bryan I (1986) Economic Policies in Canada. Butterworths, Second Edn
Caves D, Christensen L (1980) Global Properties of Flexible Functional Forms. American Economic Review 70:422-432
Christensen L, Greene W (1976) Economies of Scale in US Electric Power Generation. Journal of Political Economy 84:655-676
Christensen, L, Jorgenson D, Lau J (1973) Transcendental Logarithmic Production Fron- tiers. Review of Economics and Statistics 55:28-45
Daly D, Globerman S (1976) Tariff and Science Policies: Applications of a model of Na- tionalism. Toronto: Ontario Economic Council
Daly M, Rao P (1985) Some Myths and Realities Concerning Canada's Recent Productivi- ty Slowdown and Their Policy Implications. Canadian Public Policy 9:206-218 Dennis E, Smith K (1978) A Neoclassical Analysis of the Demand for Real Cash Balances
by Firms. Journal of Political Economy 86:793-813
Denny N, Fuss M (1982) Productivity: A Selective Survey of Recent Developments and the Canadian Experience. Toronto: Ontario Economic Council
Friedman M (1969) The Optimum Quantity of Money, and other Essays. Chicago: Aldine Harkness J (1984) Optimal Exchange Intervention for a Small Open Economy. In: Bhan- dari J, Turnovsky S (eds) Exchange Rate Management Under Uncertainty, Cambridge, Mass
Helliwell J (1984) Stagflation and Productivity Decline in Canada, 1974-82. Canadian Journal of Economics 27:191-217
Jansen D (1985) Real Balances in an Ad Hoc Keynesian Model and Policy Ineffectiveness. Journal of Money, Credit and Banking, 17:378-386
Lodh B (1984) Disaggregated Investment Function of Canadian Non-Residential Business Sector: Candide Model 3.0. Mimeograph, Economic Council of Canada
Lucas R, Rapping L (1969) Real Wages, Employment, and Inflation. Journal of Political Economy 77:721-754
May D, Denny M (1979) Post-War Productivity Increase in Manufacturing. Canadian Jour- nal of Economics 12:29-42
Sephton P (1986) Money in the Canadian Production Function Revisited. ACEA Con- ference Paper
Shephard R (1970) Theory of Cost and Production Functions. Princeton University Press Sinai A, Stokes H (1972) Real Money Balances: An Omitted Variable from the Production
Function. Review of Economics and Statistics 54:290-296
Uzawa H (t962) Production Functions with Constant Elasticities of Substitution. Review of Economic Studies 29:291-299
You J (1981) Money, Technology, and the Production Function: An Empirical Study. Canadian Journal of Economics 14:515-524
First version received: January 1989 Final version received: January 1992